Bespoke’s Morning Lineup – 5/18/21 – The Taxman Goeth
See what’s driving market performance around the world in today’s Morning Lineup. Bespoke’s Morning Lineup is the best way to start your trading day. Read it now by starting a two-week free trial to Bespoke Premium. CLICK HERE to learn more and start your free trial.
“You don’t pay taxes; they take taxes.” – Chris Rock
After inflation was the theme last week, this week housing takes center stage. Yesterday it was NAHB sentiment and today we get reports on Housing Starts and Building Permits. Levels for the month of April are expected to come in roughly the same as in March, but we’ll be watching for any signs of a slowdown due to the rising costs of inputs. Outside of these two reports, there is no other data on the docket.
In earnings news, Walmart (WMT) marked the unofficial end to earnings season with a stellar report, and unlike a lot of other companies that have reported positive results and sold off, so far WMT is actually trading higher.
Read today’s Morning Lineup for a recap of all the major market news and events including a recap of overnight economic and earnings data, as well as the latest US and international COVID trends including our vaccination trackers, and much more.

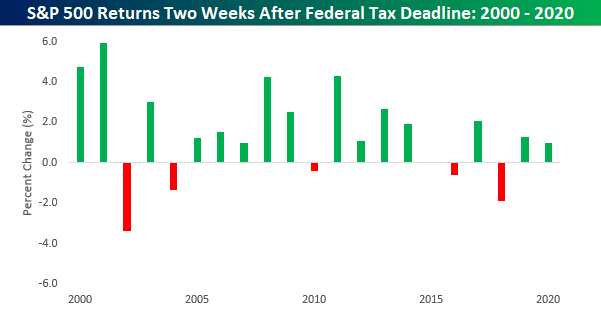
The saying goes, ‘better late than never”, but when it comes to taxes and the delayed deadline for Federal payments most would prefer “better never than late”. Due to the one-month delay and the fact that the 15th of May fell on a Saturday, yesterday (5/17) was the Federal Tax deadline, so if you haven’t filed your return or an extension yet, you are now officially late. You may not be aware, but when it comes to the Federal tax deadline, the last two decades have seen a relatively clear trend of short-term weakness in equities leading up to the tax deadline and strength after.
The chart below shows the S&P 500’s performance in the two after the Federal tax deadline for every year since 2000. In the 21 years before 2021, the S&P 500 has only been down in the two weeks after the tax deadlines five times.
Active Manager Sentiment Sinks
Last week, we highlighted how the recent market declines had struck fear in the hearts of investors as the American Association of Individual Investors (AAII) weekly survey of bullish sentiment dropped to 36.5% – its lowest level since October. Along with individual investors, another sentiment survey of ‘active managers’ also showed a notable reigning in of bullish sentiment.
The National Association of Active Investment Managers (NAAIM) conducts a weekly survey of its members to see how exposed they currently are to the market, ranging from leveraged long (+200) to leveraged short (-200). In last week’s survey, overall exposure dropped from 87.8 (nearly fully invested) down to 46.9 – the lowest level since last April!

Not only did the NAAIM Exposure Index drop to its lowest level since last April, but the magnitude of the drop was even more significant. With a w/w decline of nearly 41 points, the NAAIM Exposure Index experienced its largest decline since last September, and before that, 2008! Up until last week, there was a credible argument that sentiment had become a bit too frothy, but there’s nothing like a market sell-off to get investors back on their toes. Click here to view Bespoke’s premium membership options for our best research available.

Homebuilder Sentiment Holds Steady
The national average on a 30 year fixed rate mortgage currently sits around 3.06%, little changed over the past month. Homebuilder sentiment as measured by the NAHB Housing Market Index similarly went unchanged in May staying at 83. Although it has been six months since the record high of 90 without much of a push back up to those record levels, homebuilder sentiment continues to come in well above anything observed prior to the pandemic. Commentary from the NAHB noted that the strong reading on homebuilder confidence is thanks to the low housing inventories, low rates, and strong demand, despite the headwinds of rising costs. While that could have played into the small decline in traffic, future sales did tick higher.


Whereas the headline number was flat on the month, readings based on each region saw much more variety. By far the largest move was for the Northeast. Since running back up to the record high back in February, homebuilder sentiment in the Northeast has fallen for three straight months and is now at the lowest level since January. The decline in sentiment in the Northeast is relatively recent. Whereas the region tied its record high earlier this year, the other regions all peaked out in the fall. For the Midwest, the declines have kept coming with 3 point declines in each of the past three months alone. The West and South, on the other hand, have found some respite. The South has ticked higher by 2 points in back-to-back months as it reached the highest level since December. Meanwhile, the West was unchanged at 91 in May.

As for homebuilder stocks, the iShares US Home Construction ETF (ITB) had been trading in overbought territory throughout most of the spring but in the past couple of weeks, it has come back down to Earth. Last Wednesday, ITB successfully tested its 50-DMA with a small bounce at the tail end of the week. So far today, it has turned lower alongside the broader market with a 1.35% decline. While that means Friday’s close marks a lower high, for the time being, the uptrend is still intact. Click here to view Bespoke’s premium membership options for our best research available.

May Manufacturing Starting Off Strong
The first manufacturing data for May came out this morning with the release of the New York Fed’s Empire State Manufacturing Survey. General business conditions remain at historically strong levels although there was some slowing in May as was expected. After hitting the highest level since October 2017 last month, it was expected to fall to 23.9 in May. The index did in fact decline, but only to 24.3. While lower, that is still around some of the strongest levels (excluding last month) in three years as more businesses continue to report improvements in business conditions than weakness.

Breadth in this month’s report was pretty mixed; namely with regards to current conditions versus expectations. Every index is still showing an expansionary reading with particular strength out of the indices for the present situation. In fact, most of those indices still sit in the top decile of their historical range with a few like those for unfilled orders, delivery times, and prices even at or just off of record highs. But there were a handful that moved lower: delivery times, inventories, and number of employees.
Regarding expectations, it was much harder to find an increase. Delivery times and technology spending were the only two of these indices to rise month over month. While many indices for expectations still sit at historically strong levels, there are more that are middling within their respective historical ranges. Overall, the report showed that New York area firms have seen a peak in optimism even as they continue to report strong conditions.

Demand certainly appears to be one area without much in the way of weakness. New orders rose 2 points month over month to 28.9. That is the highest level in just over 15 years and the only other readings as high occurred throughout late 2003 to mid-2004. Those orders are making their way out the door at an increased rate too as shipments climbed to 29.7. That index has been making a vertical climb since the winter as it reached its highest level since August 2007.
Despite this, NY area firms are not fulfilling orders fast enough. Last month saw the Unfilled Orders index rise by one of the largest amounts in a single month on record, and it continued to climb albeit by a much smaller 0.2 points in May. The only month on record with a higher reading in unfilled orders was September 2001. Inventories were one of the few current condition indices to fall in May, although the reading still indicated growth. In other words, those unfilled orders are not necessarily drawing down on inventory levels.

Supply chains are one of the main areas that are likely holding things back. Higher readings in the delivery times index mean that businesses are reporting that it takes longer for products to reach their destination. Even after falling 4.5 points in May off of the April record, the current level sits well above the prior record high of 16.2 from March 2018.

In addition to taking longer for products to get to where they are going, the price point is on the rise. Both indices for prices paid and received rose to record highs in May. In fact, over the past two months, there has not been a single respondent to have reported a decrease in prices paid. That is the first time that has occurred since February and March 2012.

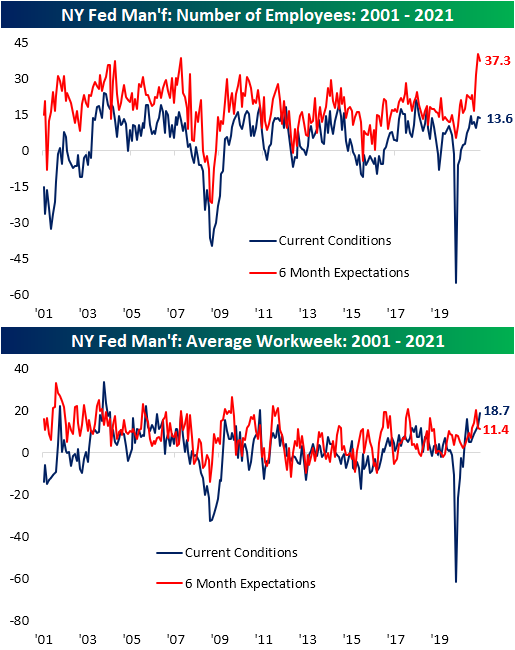
Last week saw a blockbuster job openings report and the Empire Fed survey is showing a similar willingness to take on more workers. The current conditions index for the number of employees continues to show that businesses are on net increasing their workforce, though at a slowed pace from April. Additionally, the index is at a much less elevated part of its range (the 81st percentile) relative to other indices within the report, but the much more elevated reading in expectations (98th percentile) would indicate the businesses would like to take on far more workers. That is, there appears to be a bit of a disconnect between the actual number of new hires and businesses’ expectations to take on more workers. Potentially as a result of an inability to hire enough workers, the average workweek has continued to climb. At 18.7, the index is at its highest level in a decade. Click here to view Bespoke’s premium membership options for our best research available.
Bespoke’s Morning Lineup – 5/17/21 – Mind the Gap
See what’s driving market performance around the world in today’s Morning Lineup. Bespoke’s Morning Lineup is the best way to start your trading day. Read it now by starting a two-week free trial to Bespoke Premium. CLICK HERE to learn more and start your free trial.
“Sometimes buying early on the way down looks like being wrong, but it isn’t.” – Seth Klarman
It’s been a weak morning for equities as futures trade near their lows of the morning. Economic data out of China generally missed expectations, and that has set the negative tone heading into the new workweek as speculative assets like crypto and lumber futures are under pressure.
Read today’s Morning Lineup for a recap of all the major market news and events including a recap of overnight economic data, as well as the latest US and international COVID trends including our vaccination trackers, and much more.
It’s been quite a run for value stocks. Over the last six months, the S&P 500 Value index has rallied more than 22% while its growth counterpart has only rallied half of that amount (11.7%) during that same span. With a performance gap between the two of 11 percentage points, the spread is near historically high levels, and it was even wider earlier last week.
The chart below shows the rolling six-month performance gap between the S&P 500 Value and Growth indices going back to the mid-1990s. At last week’s high of 17.5 percentage points, the spread between the two indices is the widest in just under 20 years (June 2001). It got close to current levels in the months coming out of the financial crisis but peaked just shy of last week’s high. While the spread is currently extreme now, keep in mind that it was at record extremes in the other direction last September, so value stocks are basically just catching up to growth.

Bespoke Brunch Reads: 5/16/21
Welcome to Bespoke Brunch Reads — a linkfest of the favorite things we read over the past week. The links are mostly market related, but there are some other interesting subjects covered as well. We hope you enjoy the food for thought as a supplement to the research we provide you during the week.
While you’re here, join Bespoke Premium with a 30-day free trial!
Papers
The 15-Hour Week: Keynes’s Prediction Revisited by Nicholas Crafts (Warwick Economics Research Papers)
Longer life expectancy in retirement and longer retirement periods mean that non-work hours have risen 60% over the last 90 years or so, meaning Keynes was right about his prediction for less work but wrong about the distribution of when that time would be enjoyed. [Link; 17 page PDF]
School Reopenings, Mobility, and COVID-19 Spread: Evidence from Texas by Charles J. Courtemanche, Anh H. Le, Aaron Yelowitz & Ron Zimmer (NBER)
A new paper argues that reopenings of Texas schools drove 43,000 new COVID-19 cases and 800 deaths in the first two months of reopening for districts, with changes in adult behavior that school reopenings allowed playing significant contributing role in the overall increase. [Link]
Defense Contracts
Luxury jet makers battle over lucrative spy plane niche by Allison Lampert and Tim Hepher (Reuters)
Lower operating costs make Gulfstreams popular platforms for militaries operating intelligence-gathering platforms that sniff around foreign radar and communications networks looking for signals intelligence. [Link]
The Pentagon Inches Toward Letting AI Control Weapons by Will Knight (Wired)
US military leadership is currently considering if they should allow machines to decide whether weapons are used and what they’re aimed at. [Link; soft paywall]
Post Pandemic
Many Vaccinated Americans Are Still Uncomfortable Returning to Public Activities. The U.S. Economy Needs Them by Alex Silverman (Morning Consult)
People who have received a vaccine are at lower risk than their peers, but are still less likely to eat in a restaurant, travel abroad, or go to the gym as concerns that lead them to seek vaccination aren’t totally solved by the dose. [Link]
The people who want to keep masking: ‘It’s like an invisibility cloak’ by Julia Carrie Wong (The Guardian)
Masking has been a necessary step to preventing the spread of COVID, but has also served to keep people anonymous and discrete, which for some holds an appeal that will last long past the pandemic. [Link]
Risk Appetite
New Amazon bond rivals yield on US Treasuries in record-breaking sale by Joe Rennison, Dave Lee and Camilla Hodgson (FT)
Amazon borrowed at a record low spread to Treasuries this week, part of a staggering decline in the risk premiums offered to investors in the US corporate bond market. [Link; paywall]
What Happens to Stocks and Cryptocurrencies When the Fed Stops Raining Money? by Greg Ip (WSJ)
The latest in a long line of opinion columns asking the question “is the Fed entirely responsible for elevated asset prices across financial markets”. [Link; paywall]
From Dutch Tulips to Internet Stocks, How to Spot a Financial Bubble by Jon Hilsenrath (WSJ)
The soaring prices of extremely speculative assets in 2020 and 2021 bear much in common with similarly speculative manias of the past. [Link; paywall]
Malfeasance
Colonial Hacker Group Seeks to Shift Blame for Ransomware by Alyza Sebenius and Ryan Gallagher (Bloomberg)
The hack which has left much of the US Southeast without gasoline may have been conducted by an affiliate group of the hackers whose software was used to execute the attack. [Link; soft paywall]
Crypto Fraudsters Made a Big Bet on Dogecoin, New York Claims by Olga Kharif (Bloomberg)
An NYAG suit alleges a crypto trading platform misused funds by betting the house on Dogecoin, a crypto that started as a joke and has since exploded higher. [Link; soft paywall]
Semiconductors
Your Car, Toaster, Even Washing Machine, Can’t Work Without Them. And There’s a Global Shortage. by Alex T. Williams (NYT)
A detailed look at the global semiconductors shortage and some policy proscriptions for how it might be fixed longer-term. [Link; soft paywall]
Middle East
The War That Shouldn’t Have Been by Neri Zilber (Newlines)
An insightful look at the roots of the most recent flare-up of violence in Israel and Palestine: internal political realignments within both Gazan and Israeli politics have seeded and exacerbated the conflict. [Link]
Education
Catholic Schools Are Losing Students at Record Rates, and Hundreds Are Closing by Ian Lovett (WSJ)
The United States had almost 6,000 Catholic schools before the pandemic, but hundreds have closed and enrollment is falling, with urban dioceses especially pressured by a declining prevalence of Catholicism nationally and difficulties among parents meeting the cost of an education within the faith. [Link; paywall]
Natural World
Groundbreaking effort launched to decode whale language by Craig Welch (National Geographic)
Whales have a language, but knowing it exists and translating it into something that humans can understand (let alone speak back) is a massive challenge for scientists. [Link; soft paywall]
Are These Two Men Going After the Holy Grail of Himalayan Climbing? (Climbing)
There’s speculation brewing that two of the most accomplished climbers in the world are considering a double-ascent of Everest and nearby peak Lhotse in one climb. [Link]
Read Bespoke’s most actionable market research by joining Bespoke Premium today! Get started here.
Have a great weekend!
High Flyers At Much Lower Altitudes
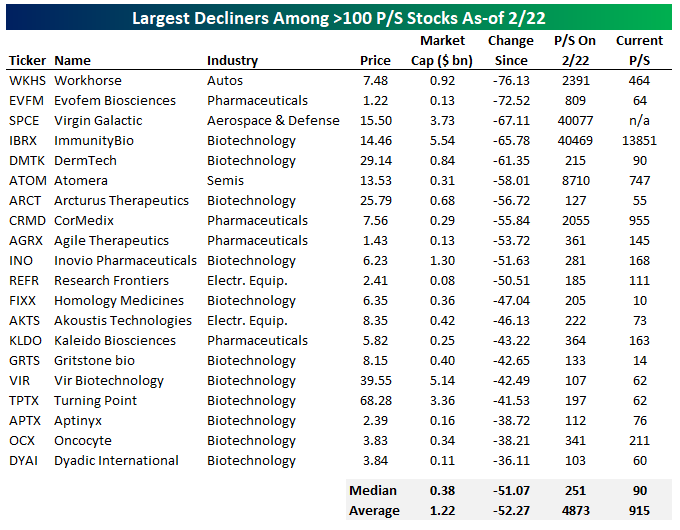
Stocks with extreme valuations have taken a serious haircut since the space peaked on February 22nd. On that date, 59 stocks in the Russell 3000 had a price-to-sales multiple north of 100x. That group had a median price-to-sales multiple of more than 311x on that date. Today, those 59 stocks have a price-to-sales multiple that’s 53.6% lower than it was February 22nd. That compares with a median price decline of 25.4% among the 59 stocks, or -22.5% weighted by market cap. In other words, while prices in this group have been hit very hard, their valuation has compressed substantially more.

Below we show the 20 stocks out of the 59 that have seen the largest drops in price since February 22nd. Among this worse-performing subset, the median stock has plunged 51%, in-line with the median 58% drop in price-to-sales since February 22nd. Despite the huge drops in prices over the last few months, these names are still very aggressively valued at a median price-to-sales multiple of 90x. Virgin Galactic (SPCE) has actually seen an infinite price-to-sales multiple after reporting zero revenue in its most recent quarter. From a valuation perspective, it’s still hard to call any of these stocks attractive. Click here to view Bespoke’s premium membership options for our best research available.
Bespoke’s Morning Lineup – 5/14/21 – Retail Sales Reset
See what’s driving market performance around the world in today’s Morning Lineup. Bespoke’s Morning Lineup is the best way to start your trading day. Read it now by starting a two-week free trial to Bespoke Premium. CLICK HERE to learn more and start your free trial.
“End? No, the journey doesn’t end here.” – J.R.R. Tolkien
If you thought that with this week’s inflation data now behind us that we could coast into the weekend, think again. There’s a ton of data on the calendar this morning, including Retail Sales, Industrial Production, and Michigan Confidence. Futures are building on yesterday’s gains after quiet sessions in Asia and Europe, but that could change following the data releases.
Read today’s Morning Lineup for a recap of all the major market news and events including a recap of overnight earnings reports and economic data, as well as the latest US and international COVID trends including our vaccination trackers, and much more.
It’s been a rocky week for the market, but the overall trend has been lower this week. Over the last five trading days, all eleven S&P 500 sectors are in the red with Consumer Discretionary (-4.66%), Technology (-3.48%), and Communication Services (-2.69%) all trading down at least 2.5%. Sectors that have held up the best include Consumer Staples (-0.06%), Materials (-0.16%), Health Care (-0.32%), and Utilities (-0.38%) which are all down less than half of one percent. Despite the broad-based declines over the last week, not a single sector is oversold, only two are below their 50-DMA, and five are still overbought.

Bullish Sentiment Down Big
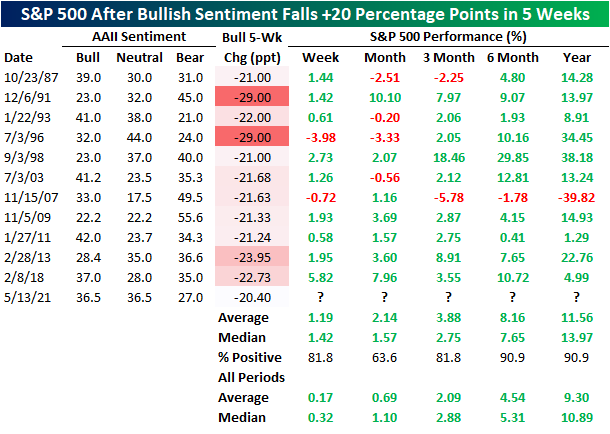
The past week has been one of the worst short term runs for the major indices of the past several months, and sentiment this week is reflecting that negative price action. Bullish sentiment as measured by the AAII weekly sentiment survey took a spill, dropping 7.8 percentage points to 36.5%. Whereas just over a month ago bullish sentiment hit a multi-year high at 56.9%, this week’s reading was the lowest since the last week of October.
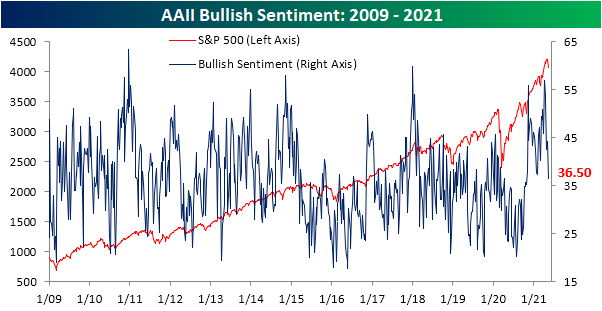
The over 20 percentage point decline in that time was the biggest drop in a span of five weeks since a 22.73 percentage point decline in the five weeks ending February 8th, 2018. In the table below, we show the past 11 periods in which bullish sentiment fell by at least 20 percentage points in five weeks without another occurrence in at least a year. Overall, they have consistently preceded solid runs for the S&P 500 with frequent moves higher that are on average larger than the norm. One and three months later have both seen the S&P 500 trade higher 81.8% of the time and a half year to a full-year out has seen the index lower only one time (in 2007). Additionally, each of the prior instances since 2009 has been marked by the S&P 500 trading higher across all time frames.
With bullish sentiment lower, bearish sentiment gained 3.9 percentage points. At 27%, it is at the highest level since early February though still a few percentage points above the historical average of around 30%.

That has resulted in the bull-bear spread dropping 11.7 points to 9.5. That is the first single-digit reading in the spread since the first week of February, but it still indicates that overall sentiment remains biased towards the bulls.

While bearish sentiment has only risen modestly, neutral sentiment is flying. After gaining another 4 percentage points this week, neutral sentiment hit the highest level since the second week of 2020. Similar to bullish sentiment, the move higher in neutral sentiment over the past few weeks has been one of the largest in roughly three years. Click here to view Bespoke’s premium membership options for our best research available.

Impressive Initial Claims; Anticlimactic Continuing Claims
Last week’s initial jobless claims number had been the first break below 500K since the pandemic began. Although that no longer applies this week after a 9K revision higher to 507K, initial claims continue to impress as the most recent print saw a more considerable break below 500K. Claims this week fell 34K to another new low of 473K. In total over the past two weeks, initial jobless claims have now fallen 117K.

On a non-seasonally adjusted basis, regular state claims combined with claims from the Pandemic Unemployment Assistance (PUA) program totaled 590.97K this week; another pandemic low. The lion’s share of these claims are of the regular state programs as only 103.57K are PUA claims. That reading was ever so slightly higher this week (up 1.76K) and remains just off the lowest level of the pandemic.

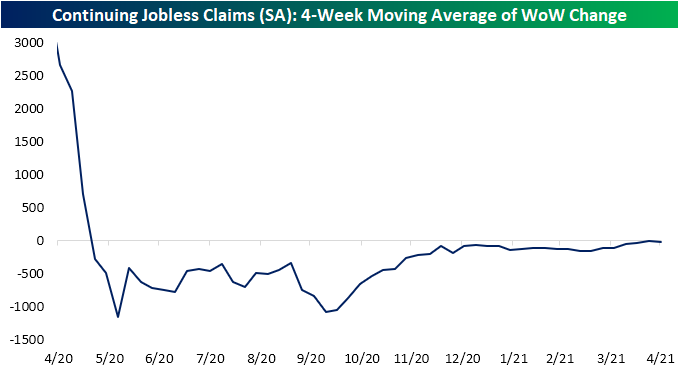
While initial claims have seen great progress over the past several weeks, continuing claims continue to be a bit more disappointing. For the first time since the week of April 9th, seasonally adjusted continuing claims did finally fall, dropping 45K to 3.655 million, but that was 5K less than the decline that had been penciled in by economists. Overall, the general trend remains the same. Whereas there were massive improvements throughout much of 2020, the pace of those improvements slowed last fall. From the end of 2020 through the end of March, claims had averaged around a 100K decline per week. Since the start of April, it has slowed even further with claims averaging only a 14K decline over the past four weeks as shown in the second chart below.

The picture is slightly better when including all programs (although this data is lagged by an extra week). Through the week of April 23rd, total continuing claims across all programs rose 697K to 16.884 million. While lower than most of the pandemic, that had erased the prior two weeks moves lower and was the largest one-week uptick since the first week of March. That uptick was driven almost entirely by PUA claims and Pandemic Emergency Unemployment Compensation. Click here to view Bespoke’s premium membership options for our best research available.

