Individual Investor Sentiment Bounces Back
Last week saw a massive decline in optimism according to the AAII‘s weekly investor sentiment survey. In fact, bullish sentiment saw its largest one-week decline in over two years. Even though the S&P 500 has technically declined more in the week leading up to this week’s survey than last week’s, sentiment actually improved with the percentage of respondents reporting as bullish rising from 22.4% to 29.9%. That was the biggest one-week increase since the first week of July, but the percentage of bullish respondents is still well below the past year’s range.
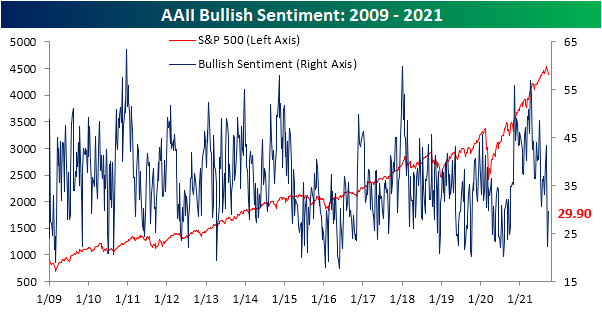
Even though there was a big pickup in bullish sentiment, bearish sentiment was only little changed. This reading only fell 0.1 percentage points to 39.3%. That remains at a level above anything observed since last fall.

That means that mostly all of the gains to bullish sentiment this week borrowed heavily from the neutral camp. Neutral sentiment fell sharply this week shedding 7.4 percentage points. That was the biggest one-week decline since a 7.5 percentage point drop in the first week of August.
We’d also note that while last week saw a big shift in sentiment among individual investors, this week, newsletter writers followed suit as bullish sentiment among that group fell below 50% to 47.1% for the lowest reading since May. Bearish sentiment meanwhile rose to 22.3% which is the highest reading since October 7th of last year. Click here to view Bespoke’s premium membership options.

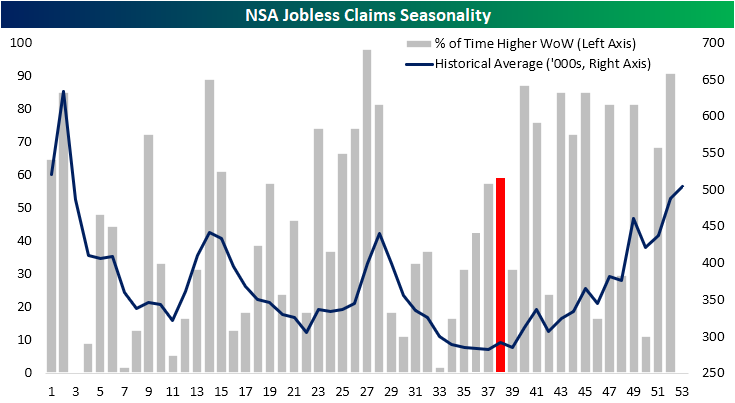
Pandemic Claims Still There
Rather than the expected decline to 320K this week, seasonally adjusted initial jobless claims rose to 351K (from weekly FRED data). That is the second week in a row that claims were higher and in which claims were worse than forecasts. After the past two weeks of increases, claims are also now at the highest level in a month, though, that is still near pandemic lows.

On a non-seasonally adjusted basis, claims were also higher rising by 40.3K week over week. That brings regular state claims back above 300K for the first time since the week of August 13th. Pandemic era programs technically ended in the first week of September and last week’s release was the first data point to capture this. PUA claims did drop substantially that week with an over 70K decline, but they did not fall to zero as one might expect. The same is the case this week with PUA claims falling further to a very low level of 15.16K. As for why PUA claim counts are still being recorded following the end of the program is not exactly clear, but it could be due to backdating of claims.

While PUA claims will likely continue to drop and become even less of a factor than is already the case, we are now past the point of the year in which claims have seasonal tailwinds. As shown below, on average claims historically rise from mid-September through the end of the year with week over week increases happening more than half the time. In other words, pandemic programs falling off have and will keep lowering claim counts but that will also be to some degree offset by seasonality.
Continuing claims are lagged an additional week to initial claims making the most recent data through the week of September 10th. Here too, claims saw a surprise uptick to 2.845 million versus expectations of a further decline to 2.6 million.

The inclusion of all programs adds yet another week’s lag to the data making the most recent data through the week of September 3; the last before the end of pandemic programs. Leading into the deadline for pandemic programs, total non-seasonally adjusted continuing claims fell to a fresh low of 11.26 million. PUA claims and PEUC claims were the biggest contributors to that decline as the former fell by 591K and the latter fell by 161K. Regular state claims also experienced a significant decline of 290K. As those programs all saw significant declines, that was offset by another sizeable increase in extended benefits programs although there is a caveat to that move.
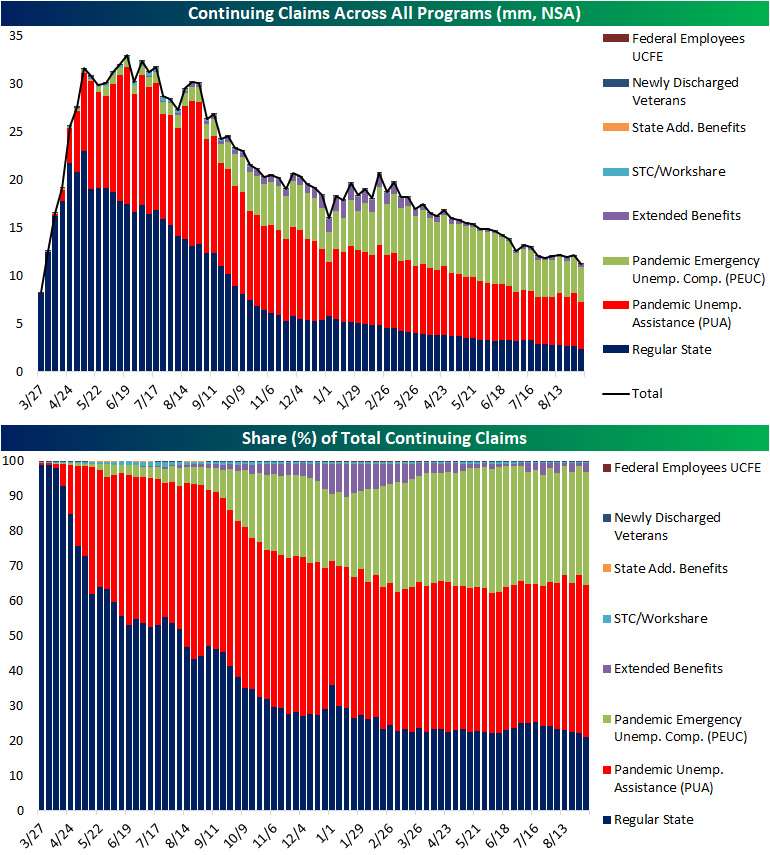
Over the past couple of months, we have frequently made note of the volatility in claim counts for extended benefits programs. Week to week this reading has been in a cycle of big increases followed by big drops. To quantify just how volatile it has been, in the second chart below we show the 8 week rolling average in the program’s absolute week-over-week change. That average not only surpassed last year’s highs but it hit a record last week, surpassing the prior high from after the Global Financial Crisis. Click here to view Bespoke’s premium membership options.

CPI vs Treasury and Dividend Yields
In order for an investor to generate real returns, the yield of an investment must exceed the going rate of inflation. Using the 10-Tear US Treasury Note as an example, if it yields 5% and inflation is running at 3%, an investor’s real yield would be 2%. The chart below shows the yield on the 10-year US Treasury along with Core CPI on a y/y basis going back 50 years. Throughout history, inflation and interest rates have tended to track each other over time, and most of the time, the 10-year yield exceeded the y/y rate of Core CPI. In fact, on a monthly basis, the 10-year yield has exceeded Core CPI more than 85% of the time. The shaded areas in the chart show periods where Core CPI was greater than the 10-year yield. Prior to the Financial Crisis, there were only two periods where it occurred, but since 2010, inflation has exceeded the 10-year yield much more frequently, although the current spread between Core CPI and the 10-year yield is the widest it has been since 1980. In other words, investors aren’t being compensated much for holding US Treasuries.

While it is relatively uncommon for Core CPI to exceed the yield on the 10-year, it is much more common for Core CPI to exceed the dividend yield of the S&P 500. Whereas Core CPI has exceeded the 10-year yield less than 13% of the time since 1971, it has exceeded the S&P 500’s dividend yield more than 75% of the time.

With Core CPI currently higher than both the 10-year yield and the S&P 500’s dividend yield, what does it mean for stock prices? There’s no way to be sure, but looking back over the last 50 years, stock prices have tended to trade relatively well during these periods. Going back on a monthly basis over the last 50 years, we calculated the S&P 500’s forward 12-month return following different scenarios in the relationship between Core CPI and yields on the 10-year US Treasury and the S&P 500. The first section of the table below shows S&P 500 average forward returns when CPI is higher than the 10-year yield or the S&P 500’s dividend yield. Below that, we show performance following periods when Core CPI was below either of those yields, and then lastly, given that Core CPI is above both the 10-year yield and the S&P 500’s dividend yield, the bottom section shows average forward equity market returns under that scenario.
As mentioned above, it’s not common for Core CPI to exceed the yield on the 10-year. While only 13% of months in the last 50 years have met that criteria, the S&P 500’s forward one-year performance was very strong, averaging a gain of 18.7% with positive returns nearly every time. In fact, the only time the S&P 500 had a negative 12-month return following a month that met this criteria was in the 12 months following 9/30/1980. When Core CPI has exceeded the S&P 500’s dividend yield, the S&P 500 was still positive over the next 12 months nearly three-quarters of the time, but the index’s average gain has been a more modest 7.8%.
In the opposite scenarios, when Core CPI is lower than the yield on the 10-year US Treasury, the S&P 500’s average 12-month forward return was a gain of 7.6% with positive returns 72.5% of the time. Performance is much better when Core CPI is lower than the S&P 500’s dividend yield. In the year following those occurrences, the S&P 500 averaged a gain of 13.6% with gains 87% of the time.
Lastly, scenarios like the current one where Core CPI is simultaneously higher than both the 10-year yield and the S&P 500’s dividend yield are very uncommon occurring in less than 10% of all months since 1970. Following those periods, the S&P 500’s average change over the next 12 months has been 15.8% with positive returns over 98% of the time.
While forward 12-month equity market returns have been positive when Core CPI is higher than the 10-year yield, these returns don’t take into account the impact of inflation. Real returns which we alluded to above will not be as strong, but the analysis does suggest that historically, equities have provided some degree of a hedge in a higher inflation environment.
As always, past performance is no guarantee of future results.

IPO ETF Strong Recently
While the broader market has generally trended lower this month, one area of slight outperformance has been the stock market newbies. As shown below, whereas the S&P 500 (SPY) has fallen 2.88% MTD, the Renaissance IPO ETF (IPO) has risen 3.5%. At the moment, the IPO ETF is actually trading overbought (>1 standard deviation above its 50-DMA) while SPY began the day in oversold territory (>1 standard deviation below its 50-DMA).
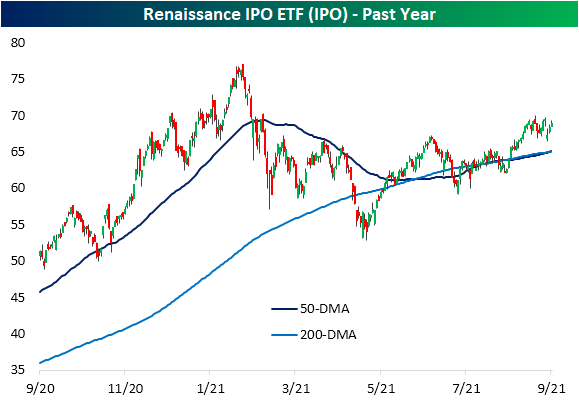
The move higher in the IPO ETF has resulted in the past year’s relative strength line versus the S&P 500 (SPY) to move back into positive territory and taking out the late June high as well. Positive readings and times when the line is trending higher indicate that IPO is outperforming the S&P 500 and vice versa for negative readings. Click here to view Bespoke’s premium membership options.

Singles Miss Out on Housing Strength
Data on residential housing this morning surprised to the upside at the headline level in terms of both Building Permits and Housing Starts. Despite the better than expected results, the internals of the report weren’t great as all of the strength was in multi-family units. In fact, single-family Building Permits were only up 0.6% m/m and were down -0.1% y/y compared to a m/m gain of 15.8% and a y/y gain of 44.3% in multi-family permits. Similarly, single-family Housing Starts actually declined 2.8% m/m and only increased 5.2% y/y compared to multi-family units which rose 20.6% m/m and 52.7% y/y. An increase in multi-family units isn’t necessarily considered a bad thing, but single-family units tend to have more of an economic impact.

Overall, Housing Starts are still trending higher. On a 12-month moving average basis, Housing Starts have been surging in recent months and just came in at the highest level since May 2007. Housing data tends to roll over well in advance of recessions, so as long as Starts keep trending higher, it’s a sign of economic strength.

Looking more closely at single-family Building Permits and Housing Starts, the 12-month moving average of this metric has actually been starting to flatten out in recent months. Housing has been a pillar of the economy in the post-pandemic rebound, so this will bear watching going forward.

It’s always interesting to see how closely homebuilder stocks tend to track trends in Housing Starts, which we show below. Similar to the stall out in starts, we’ve also seen the iShares Home Construction ETF (ITB) start to stall out over the last few months. Click here to view Bespoke’s premium membership options.

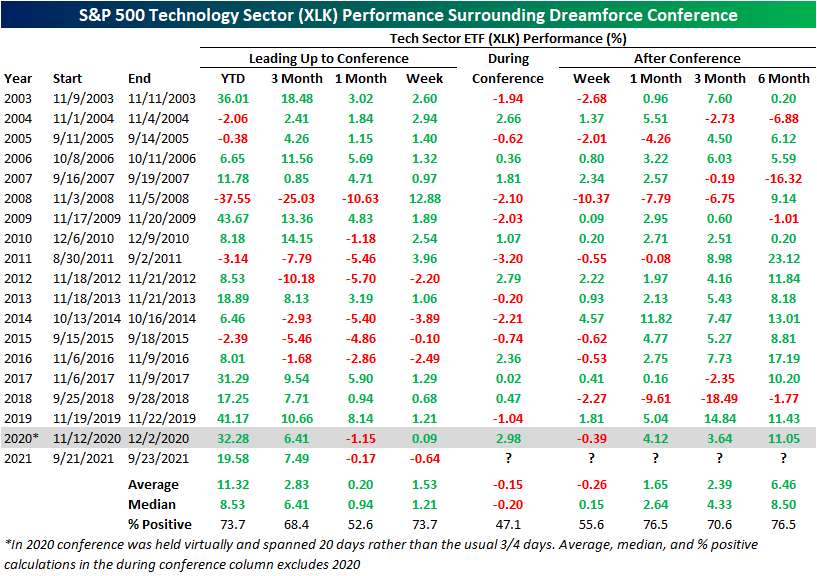
Dreamforce Kicks Off
Salesforce.com (CRM) kicks off its annual Dreamforce conference today. This is the 19th year of the event in which the company showcases its products and hosts various presentations by industry leaders. Like many conferences, in-person attendance is limited again this year with the event streamed online over the next few days. Unlike last year, the conference is back to its usual length of only a few days compared to the 2020 event that went on for nearly a month. The Dreamforce conference typically occurs in the fall but has happened as early as the end of August and as late as early December.
As for how Dreamforce impacts the stock, below we show how CRM’s performance leading up to, during, and after each year’s conference. The stock pretty consistently trades higher around the Dreamforce conference. If you exclude last year when the conference lasted for a much longer period of time, and the Slack takeover acted as a negative catalyst, CRM tends to move higher during the conference. The only notable period of weakness is the week after the conference ends. That period has averaged a 0.93% decline with positive performance less than half the time. Longer-term performance, though, has been more consistent to the upside. Note that because of the extended length of Dreamforce in 2020, performance figures at the bottom of both tables do not take 2020 performance figures into account.

Salesforce.com is a giant in the Tech sector ranking as the eighth largest stock in the S&P 500 Technology sector. As such, the stock’s performance does hold some weight on the broader market. Below we replicate the table above but with the performance of the S&P 500 Tech Sector ETF (XLK). As with CRM, XLK has typically rallied leading up to the conference, but it tends to underperform CRM during the conference falling 20 bps on a median basis during the few days the event takes place versus CRM’s median gain of 0.51%. Following the conference, like CRM, XLK’s short-term performance over the next week is mixed to negative, but one, three, and six months later the stock has traded higher more than two-thirds of the time.Click here to view Bespoke’s premium membership options.
Bespoke’s Morning Lineup – 9/21/21 – Attempting a Turnaround
See what’s driving market performance around the world in today’s Morning Lineup. Bespoke’s Morning Lineup is the best way to start your trading day. Read it now by starting a two-week trial to Bespoke Premium. CLICK HERE to learn more and start your trial.
“You can’t predict, [but] you can prepare.” – Howard Marks
Markets are attempting to stage a turnaround Tuesday this morning with equity futures firmly in the green and Europe also trading firmly higher. Just release economic data has provided a boost as both Building Permits and Housing Starts for the month of August came in significantly better than expected, although the strength was attributable to multi-family rather than single-family units.
Read today’s Morning Lineup for a recap of all the major market news and events from around the world, including the latest US and international COVID trends.
After a rough options expiration week, this week didn’t start any better as the S&P 500 fell 1.7% yesterday. So how common is it for the S&P 500 to trade down more than 1% on the Monday following options expiration? Since the start of 2010, there have been eighteen other occurrences, and yesterday was the second time this year and the seventh time since the COVID outbreak in 2020; so they are occurring with a bit more frequency lately. That being said, a year before COVID it happened three months in a row spanning November 2018 through January 2019. Also, like 2020, there were five occurrences in 2011.

Start a two-week trial to Bespoke Premium and read today’s full Morning Lineup.
Homebuilder Sentiment Surprise
The NAHB released its September reading on homebuilder sentiment this morning. Rather than another decline down to 74 that was expected, the headline reading surprised to the upside coming in slightly higher at 76. We are now approaching the one-year anniversary since homebuilder sentiment peaked at its record high of 90 from last November. While little progress has been made in working back up to that high, the current reading remains at one of the strongest levels on record.

Both Present Sales and Traffic drove the headline index higher this month with the latter seeing the larger move higher of the two. Future sales, on the other hand, went unchanged for the second month in a row. Just like the overall market index, each of these components has pulled back from last November’s highs but remain at historically strong levels.
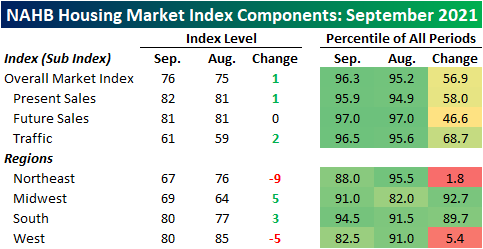
There was a more significant movement based on geography. Starting with the bad news, the Northeast and West experienced particularly large declines of 9 and 5 points, respectively. After that decline, sentiment in the Northeast is at the weakest reading since June of last year and the month-over-month decline ranks in the bottom 2% of all monthly moves. The drop in sentiment in the West similarly was one of the largest declines on record.
Meanwhile, the Midwest and South had much stronger showings this month. Not only were the indices for both of these regions in the top decile of all periods, but they also showed significant improvement in September. The 5 point uptick in the Midwest index ranks in the top decile of all moves while the 3 point increase in the South narrowly missed a 90th percentile move. Click here to view Bespoke’s premium membership options.

Bespoke’s Morning Lineup – 9/20/21 – When it Rains, it Pours
See what’s driving market performance around the world in today’s Morning Lineup. Bespoke’s Morning Lineup is the best way to start your trading day. Read it now by starting a two-week trial to Bespoke Premium. CLICK HERE to learn more and start your trial.
“Failing to raise the debt limit would produce widespread economic catastrophe.” – Janet Yellen
Good Morning Subscriber,
After months of heat, it only seems fitting that problems are boiling to the surface just as Summer winds to a close this week. Between FOMC tapering, slower economic data, the upcoming debt limit, and China’s Evergrande, the problems are starting to mount. Futures opened lower last night, and originally the damage didn’t look like it was going to be too bad, but by 11 o’clock eastern time, things started to deteriorate.
The continuing collapse of Evergrande is obviously the main concern of investors around the world this morning. The fact that most of those Asian markets are closed for holidays today also makes it harder to discern what the overall impact is going to be and that only creates more uncertainty in other markets around the world that are open for trading today.
S&P 500 futures are near their lows of the morning and indicated to open down by over 1.5%, the 10-year yield is down nearly six basis points to 1.30% (it was actually lower than that last Wednesday), and the VIX is back above 25 and at its highest level since May.
Read today’s Morning Lineup for a recap of all the major market news and events from around the world, including the latest US and international COVID trends.
The numbers below are going to look worse in a couple of hours after the US market’s open, but the table below breaks down where sectors stand after last week and heading into this morning’s decline. Last week, both Materials and Utilities were easily the worst performers with declines of 3% or more. As a result of those losses, the Materials sector moved into oversold territory, while Utilities isn’t far behind. Industrials were down by only about half that much, but that was enough to put it into ‘Extreme’ oversold levels. Along with those three sectors, the only others that were below their 50-day moving averages (DMA) as of Friday were Consumer Staples and Communication Services. While only five sectors were below their 50-DMA as of Friday, there’s a good chance that by the end of the day today, either all or all but one of them (Consumer Discretionary) will be below their 50-DMAs. Change has a way of coming quickly in the market.

Start a two-week trial to Bespoke Premium and read today’s full Morning Lineup.
Bespoke Brunch Reads: 9/19/21
Welcome to Bespoke Brunch Reads — a linkfest of the favorite things we read over the past week. The links are mostly market related, but there are some other interesting subjects covered as well. We hope you enjoy the food for thought as a supplement to the research we provide you during the week.
While you’re here, join Bespoke Premium with a 30-day free trial!
COVID
The unvaccinated and the orphans they leave behind by Renée Graham (Boston Globe)
With hundreds of thousands of Americans dying from the COVID pandemic, more than 100,000 children have been orphaned or lost at least one caregiver. [Link; soft paywall]
New Orleans Saints Covid-19 Cases Will Test NFL’s Pandemic Strategy by Andrew Beaton (WSJ)
Hoping that widespread vaccinations would reduce spread risk, NFL teams are required to test personnel weekly rather than daily. But that allows clusters of breakthrough cases (like the New Orleans Saints saw this week) to create a mess if they gain momentum. [Link; paywall]
College
Colleges Have a Guy Problem by Derek Thompson (The Atlantic)
Men dramatically outnumber women on college campuses…but why? This effort to dig into the causes, and concludes that it’s unlikely down to a single factor but a mix of cultural, historical, and economic forces. [Link; soft paywall]
College students reported record-high marijuana use and record-low drinking in 2020, study says by María Luisa Paúl (WaPo)
Time was that college meant binge drinking, and a lot of it. But many college kids are pivoting towards marijuana use instead, with nearly half of college-aged Americans reporting use last year. That’s about twice as large a share as those reporting binge drinking. [Link; soft paywall]
Real Estate
Rust Belt City’s Pitch for a Hot Housing Market: Free Homes by Ben Eisen (WSJ)
A struggling small town in Pennsylvania is hoping desperation among home buyers will make a pretty good deal seem irresistible: agree to fix up a house, and you get it for free. [Link; paywall]
Newsom signs long-awaited bills to increase housing density in California by Alexei Koseff (San Francisco Chronicle)
In addition to staving off a recall attempt this week, Governor Newsom also made it legal to build a duplex on any property zoned for single family housing statewide. The hope is that modest increases in density will free up housing supply in the famously challenged state. [Link; soft paywall]
Politics
Polling error: How one survey changed the Newsom recall campaign by Ben Christopher (CalMatters)
In late July, Democrats in one of the country’s bluest states started to worry their reasonably popular governor would get recalled. One poll specifically spurred a frantic effort to turn out voters, and appears to have led almost directly to the strong results for Newsom in the race, a fascinating example of electoral reflexivity. [Link]
Pests
Die, Beautiful Spotted Lanternfly, Die by Ginia Bellafante (NYT)
The northeast is facing an invasion from gorgeous bugs called spotted lanternflies, putting at risk grape crops and trees across the region. The solution? Put the boot to them. [Link; soft paywall]
Personal Finance
How You Feel About Money by Michael Batnick (The Irrelevant Investor)
A thoughtful review of how our personal experience drives us to think about money, both for good and ill, but in ways that need to be acknowledged and understood. [Link]
Taxes
ETF Taxation In The Crosshairs (NASDAQ)
Democrats are considering removing some of the tax benefits of ETFs, making the funds less likely to track their benchmark and creating tax liabilities for some investors. We note that this is only at the proposal stage and formal language has not even been circulated. [Link]
Fast Food
Taco Bell tests 30-day taco subscription to drive more frequent visits by Amelia Lucas (CNBC)
YUM is testing a program that would let users pick up a daily taco every day for 30 days at a cost of $5 to $10 per month, hoping that the loss leader will drive more frequent visits and purchases of other items. [Link]
Oil
Beijing to release state crude reserves by auctions to ease feedstock costs (S&P Global/Platts)
In an effort to alleviate tight crude supplies, China’s strategic oil reserve will release tens of millions of barrels and cap imports, in a major shift for short-term global crude demand. [Link]
Labor Markets
Spillover Effects from Voluntary Employer Minimum Wages by Ellora Derenoncourt, Clemens Noelke, and David Weil (SSRN)
When Amazon raises wages for its distribution centers, other local employers are forced to bump up pay as well to continue attracting workers. [Link]
Read Bespoke’s most actionable market research by joining Bespoke Premium today! Get started here.
Have a great weekend!