Bespoke’s Morning Lineup – 11/1/21 – Positive Start to November
See what’s driving market performance around the world in today’s Morning Lineup. Bespoke’s Morning Lineup is the best way to start your trading day. Read it now by starting a two-week trial to Bespoke Premium. CLICK HERE to learn more and start your trial.
“If people knew how hard I worked to get my mastery, it wouldn’t seem so wonderful at all.” – Michelangelo Buonarroti
There are less than 45 trading days left in the year, and the major US averages are looking to pick up in November where they left off at the end of October. Today’s economic data includes the ISM Manufacturing report and Construction Spending at 10 AM. In addition to another busy week of economic data and Friday’s employment report, the key event of the week will be Wednesday’s FOMC policy statement and Powell press conference.
Read today’s Morning Lineup for a recap of all the major market news and events from around the world, including the latest US and international COVID trends.
The S&P 500 rallied more than 1% last week but at the sector level just over half of the eleven S&P 500 sector ETFs actually finished the week lower. None of the sector declines were more than 1%, but it does show that last week’s rally wasn’t a tide that lifted all boats. The two worst performing sectors on the week were Financials (XLF) and Energy (XLE), but they are still easily the top-performing sectors YTD and still two of six sectors that head into the new week at overbought levels.
Even in the top-performing sector last week – Consumer Discretionary (XLY)- the rally was far from even. The sector’s 4.36% surge was primarily all due to the rally in Tesla (TSLA) which surged over 20%. On an equal-weighted basis, the sector’s performance was much more muted at just 0.45%.

Start a two-week trial to Bespoke Premium to read today’s full Morning Lineup.
Bespoke Brunch Reads: 10/31/21
Welcome to Bespoke Brunch Reads — a linkfest of the favorite things we read over the past week. The links are mostly market related, but there are some other interesting subjects covered as well. We hope you enjoy the food for thought as a supplement to the research we provide you during the week.
While you’re here, join Bespoke Premium with a 30-day free trial!
Climate
Unlimited Sand and Money Still Won’t Save the Hamptons by Polly Mosendz and Eric Roston (Bloomberg)
How the federal government is investing billions to give some of the most expensive coastal real estate in the world a chance at survival amidst rising seas and intensifying storms. [Link]
The Engineer Who Made Electric Vehicles Palatable for the Pickup-Truck Set by Alejandro De La Garza (Time)
A profile of the veteran Ford engineer who is driving the company towards widespread battery-electric adoption that will be predicated on selling millions of electric pickups she helped design. [Link]
Economic Research
Labour markets and inflation in the wake of the pandemic by Frederic Boissay, Emanuel Kohlscheen, Richhild Moessner and Daniel Rees (BIS Bulletin)
A helpful cross-country analysis of the very different labor market shifts brought on by the pandemic. The US saw an unusual uptick in average hours worked but much more unemployment, while other developed markets typically reduced labor activity via fewer hours. [Link; 9 page PDF]
A C-Shaped Recovery? by JW Mason (JW Mason)
Unlike in a typical recession, a massive policy response meant that real incomes actually rose during this recession, and the biggest gains came at the bottom of the income distribution, a complete mirror image of the typical downturn. [Link]
Monitoring the Inflationary Effects of COVID-19 by Adam Hale Shapiro (FRBSF Economic Letter)
A somewhat dated (from August 2020) but useful analysis of COVID-related inflation and disinflation that uses volume changes to identify which categories of prices are being driven by supply versus demand shifts. [Link]
Strange Pastimes
Crypto Investors Are Bidding to Touch a 1,784-Pound Tungsten Cube Once a Year by Edward Ongweso Jr (Vice)
Just when you thought the NFT craze couldn’t get any weirder, and Illinois company is selling one that allows users to touch a big cube of metal. [Link]
Inside the jaw-clenching world of cricket fighting in China by Emily Feng (NPR)
A thousand year old tradition in China involves setting bugs against one another while a referee watches closely to pick a winner. The little insects are rarely injured by their grappling, and owners never allow fights to the death. [Link]
Tech, For Good Or Bad
For the First Time, Drones Autonomously Attacked Humans. This Is a Turning Point. by Kyle Mizokami (Popular Mechanics)
While somewhat dated, this article is still an important milestone in the evolution of warfare: the first time a drone has made a decision to attack and kill a human without another human being involved. [Link]
3-D Printed Houses Are Sprouting Near Austin as Demand for Homes Grows by Nicole Friedman (WSJ)
New technology is being deployed to help reduce the costs of home construction, with builder Lennar (LEN) hoping to free up more supply with the new approach. [Link; paywall]
You Could Be Competing With Bots to Buy Gifts This Christmas by Joshua Hunt (Bloomberg)
Inside the desperate competition for sneakers sold by retailers that pit botnets versus consumers looking to buy shoes for themselves. [Link; soft paywall]
Oops
Covid cases: Immensa lab failures preceded huge spikes in South West as large number of positives were missed by Thomas Saunders (iNews)
As much as a quarter of the positive COVID tests in South West England were missed thanks to an error at a lab that generated more than 40,000 false negative test results in September and October. [Link]
Demographics
The First Population Bomb by Davis Kedrosky (Substack)
How a massive surge in population preceded the fastest economic growth of England’s industrial revolution, driven by a range of factors from earlier marriages (thanks to better labor incomes) to longer life expectancy. [Link]
Cigarette Sales Rose in 2020 for First Time in 20 Years by Talal Ansari (WSJ)
With less money spent on travel, gas, and entertainment, more money got spent on cigarettes, driving the first annual increase in cigarette volumes for more than two decades. [Link; paywall]
Read Bespoke’s most actionable market research by joining Bespoke Premium today! Get started here.
Have a great weekend!
The Bespoke Report Newsletter – 10/29/21 – Over the Hump
This week’s Bespoke Report newsletter is now available for members.
With the peak of earnings season ahead, including reports from the five largest companies in the S&P 500 (at the time), investors were looking at quite a hill to climb heading into this week. Based on past precedent, expectations weren’t great. In the past, when the five FAAMG stocks (Facebook, Apple, Amazon, Microsoft, and Alphabet) have reported earnings in the same week, their performance and the performance of the S&P 500 during that week has generally been poor. In the five prior occurrences where this occurred since 2015, the S&P 500 was down during that week four out of five times, and the only positive return was a modest gain of 0.14% in the week ending 4/30/21.
This week came and went, and the bulls were unfazed by the challenge. Despite mixed reports from the companies reporting– three of which were down on their earnings reaction days– the S&P 500 managed to rally more than 1% and hit record intraday highs on four of the week’s five trading days.
In this week’s Bespoke Report, we discuss all the issues impacting the market this week along with what to expect in the final two months of the year. To read this week’s full Bespoke Report newsletter and access everything else Bespoke’s research platform has to offer, start a two-week trial to one of our three membership levels.


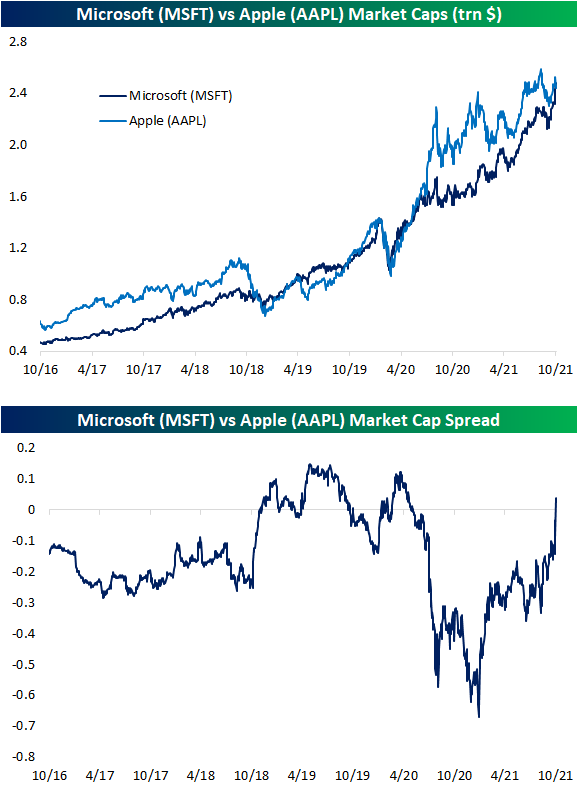
Microsoft (MSFT) Back on Top of Apple (AAPL)
Only two days ago as the stock was seeing a strong reaction to earnings, we noted how Microsoft (MSFT) was gaining ground on Apple (AAPL) for the title of world’s largest stock by market cap. After reporting inline EPS and lower than expected revenues last night, AAPL is lower on earnings for the fifth quarter in a row. Meanwhile, MSFT has risen 6.5% since reporting top and bottom-line beats. In terms of market cap, MSFT has tacked on $149 billion over the past few days while AAPL has lost $82 billion today alone. Those inverse moves have lifted the market cap of Microsoft above that of Apple for the first time since June 2020. As shown in the second chart below, over the past few years MSFT and AAPL have battled back and forth for the largest stock spot. From last summer until recently, AAPL held significant ground on MSFT, but that is obviously no longer the case. Click here to view Bespoke’s premium membership options.
Heard on Conference Calls
Below are some of the most interesting things we heard on quarterly conference calls from Corporate America this week:
Supply Chain
In terms of days of supply, Ford has historically averaged 75 but ended Q3 with about 20. CFO John Lawler commented, “we are not going back there.”
![]()
In terms of the chip shortage, Ford’s Lawler added, “we’re doing everything we can to get our hands on as many chips as we can. But we do see that running through 2022. It could extend into 2023, although we do anticipate the scope and severity of that to reduce as we move through ’22 into ’23.”
In terms of plane production rates, Boeing CEO David Calhoun added, “Raw materials, logistics, and labor availability will also be key watch items for future rate increases.”
![]()
According to 3M CEO Mike Roman, “ocean freight costs have more than doubled over the last year, and the number of containers on the water is up 70% because of port congestion.”
![]()
Apple CEO Tim Cook stated, “We estimate these constraints had around a $6 billion revenue dollar impact, driven primarily by industrywide silicon shortages and COVID-related manufacturing disruptions.”
![]()
Amazon CEO Andy Jassy revealed, “In the fourth quarter, we expect to incur several billion dollars of additional costs in our consumer business as we manage through labor supply shortages, increased wage costs, global supply chain issues, and increased freight and shipping costs.”

Labor
Automatic Data Processing CEO Carlos Rodriguez stated, “Our clients are eager to hire, and we are seeing workers return to the labor force, even if it’s gradual.”
![]()
According to McDonald’s CEO Chris Kempczinski, “Our US franchisees have never been better positioned to weather the labor and inflation pressures while still investing in growth.”

Microsoft CEO Satya Nedalla stated, “as more people change jobs than ever before, we saw record engagement as they increasingly turn to LinkedIn to connect, learn, grow and get hired.”
![]()
COVID related
In Q3, the airline industry saw “global departures increase slightly to an average of 67% of 2019 levels, up from 59% the previous quarter,” according to Calhoun.
Alphabet CFO Ruth Porat commented, “people increasingly are embracing a hybrid work model.” Porat added that the consumer shift to digital is “real and will continue.”
![]()
Alphabet CEO Sundar Pichai explained, “as consumers, businesses and schools continue their shift towards hybrid work… customers are turning to Google workspace and our cyber security platform.”
Broader Economy
Evercore CEO John Weinberg stated, “momentum in capital raising for financial sponsors continues and secondary market activity remains high.”

In terms of secular changes, Evercore management believes, “there is clearly a great deal of liquidity in the system that it’s not going to go away soon… we see real opportunity on corporate balance sheets as there is a lot of leverage available.”
According to Baker Hughes CEO Lorenzo Simonelli, “the oil field services market is in the early stages of a broad-based multi-year recovery.”
![]()
Johnson & Johnson CFO Joe Wolk stated, “Cost of products sold improved by 200 basis points, driven by recovery from prior year COVID-19 related impacts and favorable enterprise mix [in pharmaceuticals.]”
![]()
Wolk added, “in the United States, they are ramping up again and resuming elective procedures.” However, the CFO referenced, “the growing impact from reduced medical staffing on constraining procedure volumes” as a possible headwind.
United Rentals CEO Michael Flannery commented “virtually all key indicators point to a sustained recovery,” adding, “We’re also seeing work build across the entire easy supply chain. Plant maintenance is another big driver for us. We’re seeing that work start up again after being paused for COVID.”
![]()
In summary, although the broader economy has largely recovered from the COVID recession, we are still dealing with multiple repercussions, including the global chip and labor shortage. COVID and resulting policies have significantly altered the way in which people work and engage in commerce.
The quotes above are from our detailed Conference Calls publications. Throughout earnings season, we publish Conference Call summaries for select companies. These summaries include information regarding each company’s financial results, growth by segment, as well as some aspects of the business that management expects to impact future results. As always, none of these summaries should be construed as recommendations to buy or sell any securities, and investors should do their own research and/or consult with a financial professional before making any investment decisions.
Our Conference Calls reports are available to Bespoke Institutional subscribers only. If you’re not currently a Bespoke Institutional subscriber, click here to sign-up for or upgrade to Bespoke Institutional now.
Conference Calls Reports So Far This Earnings Season:
Apple (AAPL)
Amazon (AMZN)
Merck (MRK)
United Rentals (URI)
Ford (F)
Automatic Data Processing (ADP)
Boeing (BA)
Evercore (EVR)
McDonald’s (MCD)
Alphabet (GOOGL)
Microsoft (MSFT)
Digital Realty (DLR)
3M (MMM)
Facebook (FB)
Olin (OLN)
Tesla (TSLA)
Equifax (EFX)
Baker Hughes (BKR)
Netflix (NFLX)
Intuitive Surgical (ISRG)
Johnson & Johnson (JNJ)
NextEra Energy (NEE)
Bespoke’s Morning Lineup – 10/29/21 – Apple (AAPL) Falls From the Tree
See what’s driving market performance around the world in today’s Morning Lineup. Bespoke’s Morning Lineup is the best way to start your trading day. Read it now by starting a two-week trial to Bespoke Premium. CLICK HERE to learn more and start your trial.
“Nature is pleased with simplicity. And nature is no dummy” – Isaac Newton
Futures are indicating a negative end to the week and the month, but it probably could have been worse. With Apple (AAPL) and Amazon.com (AMZN) both down close to 4%, they are accounting for just about all of the weakness in equities at the open. Even with the losses, though, October is on pace to be the best month for the S&P 500 since last November and the best October since 2015.
In the latest dump of economic data, the only outliers relative to expectations were the Employment Cost Index (ECI) which came in higher than expected, and Personal Income which declined more than expected. The only remaining reports scheduled are Chicago PMI and Michigan Confidence shortly after the opening bell.
Read today’s Morning Lineup for a recap of all the major market news and events from around the world, including the latest US and international COVID trends.
It may seem like the law of gravity sometimes gets suspended, but it usually makes its presence felt at some point. In the case of Apple’s (AAPL), that was last night as the company traded down in reaction to weaker than expected earnings and lowered guidance citing the impact of supply chain issues. With the stock indicated to gap down close to 4% at the open, it is on pace for its worst earnings reaction day in exactly a year.
Heading into last night’s earnings report, AAPL still held the title of the company with the largest market capitalization in the world at $2.46 trillion, but its lead over Microsoft (MSFT) was slim at ‘just’ $20 billion. When the opening bell rings today, though, MSFT will move into the top spot by virtue of not falling as much as AAPL. Looking at the performance of each stock over the last year, there has been a growing divergence between the two stocks. Up until late February of this year, both were performing relatively in line with each other, but ever since March, MSFT has been widening the gap over AAPL. Based on where each stock is trading in the pre-market, MSFT’s gain of 59.69% over the last year is just over double the gain of AAPL.

Start a two-week trial to Bespoke Premium to read today’s full Morning Lineup.
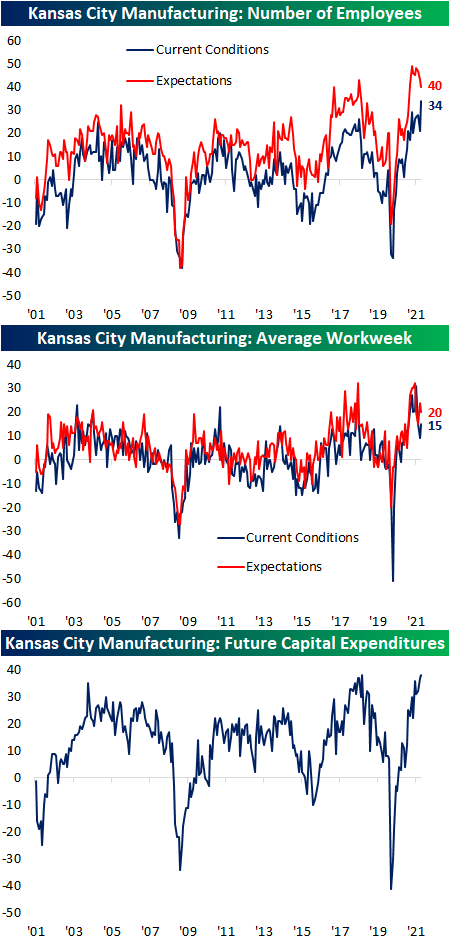
Tenth District Manufacturing Flying
The fifth and final regional Fed manufacturing survey results came in this morning from the tenth district, and like the Richmond and Dallas Fed results, the region’s manufacturing activity saw a significant acceleration in October. The Kansas City Fed’s Composite Index tied the April record high at 31 after rising 9 points month over month. That was the largest one-month uptick since August 2020. While expectations were slightly lower, the past several months’ readings have been less volatile hovering around record highs.

Feeding into the very strong composite index were historically high readings across almost every other category. All but two indices came in the 90th percentile or better and there were three indices—Number of Employees, Prices Paid, and Supplier Delivery Times—that hit record highs. For some of those categories, this month’s upper decile readings also mark a significant improvement from the prior month. For example, Production, Shipments, and New Orders were coming from readings in the 40th percentile range. Additionally, breadth was very strong this month with only two indices falling month over month: Backlog of Orders and Material Inventories. Expectations on the other hand saw weaker breadth in terms of month over month moves and less elevated readings relative to their historical ranges.

As previously mentioned, the most improved area of the report was concerning demand. New Orders, Production, and Shipments all surged MoM with each one seeing double-digit gains. Whereas last month these three indices were somewhere in the 40th percentile range, this month there were in the upper decile of their historical range. Each of those indices experienced big declines last month, so the huge gains in October bring them back to levels last seen in July or August. While those are positives, expectations for Production and Shipments saw large declines ranking in the bottom 3.3% and 1.2% of month-over-month moves. Given current conditions for production and shipments moved significantly higher, firms were able to work off backlogs as that index fell 7 points to 23 which is the lowest reading since January.

That is not to say supply chains improved though. Delivery times surged yet again to set another record high for both current conditions and expectations. The MoM increase in expectations we would also note was the largest to date.

Additionally, Prices Paid continued to rise also hitting records for both current and future indices. While Prices Received were also higher, the indices for that category are off their peak from earlier this year.

The other record high reached this month was for Number of Employees. The index rose 13 points to 34, but potentially because positions are being met, expectations for hiring were weaker. That index continued to roll over falling to 40 in October. While lower, the current reading is still at historically strong levels. Although expectations for increasing hiring have been pulling back, Capital Expenditure expectations have continued to rise with that index tying the record high of 38 set back in September 2018. Click here to view Bespoke’s premium membership options.
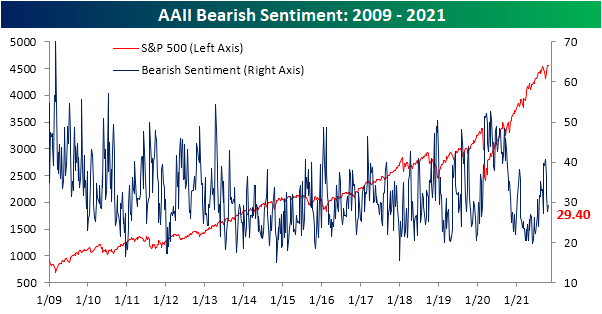
Sentiment Steps Back
The weekly sentiment survey from AAII saw a surge in optimism in recent weeks, but it took a step back this week even with the S&P 500 at new highs. Bullish sentiment fell from a recent high of 46.9% down to 39.8% this week. Outside of last week, that is still the highest level since the first week of September.

While bullish sentiment saw a significant 7.1 percentage point drop, a relatively small share of those losses turned to the bearish camp. Bearish sentiment only rose 1.6 percentage points to 29.4%. That is still below levels from two weeks ago and is in line with the average from throughout the summer.
The corresponding moves in bullish and bearish sentiment resulted in the bull-bear spread to fall but bulls continue to outweigh bears by 10.4 percentage points.

As previously mentioned, the largest share of losses to bulls did not go to bears, but instead were picked up by those reporting neutral sentiment. That reading moved back above 30% this week gaining 5.3 percentage points. Again, that does not mark any sort of new high or low but instead brings sentiment back to similar levels seen only a month or two ago. Click here to view Bespoke’s premium membership options.

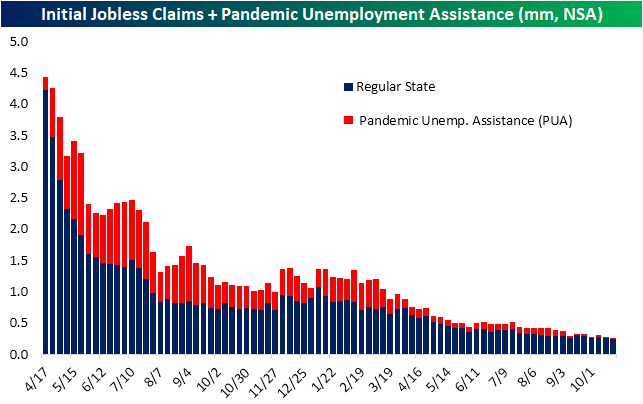
NSA Claims Back Below March 2020 Levels
Both initial and continuing jobless claims once again came in below expectations and at new pandemic lows this week. Seasonally adjusted initial claims fell to 281K this week, exceeding expectations by 7K and a 10K drop from last week’s 1K upwardly revised reading. Claims are now only 25K above the level from the week of March 13, 2020; the last week before claims began to print in the millions.

From a seasonal perspective, the fourth quarter and the current week of the year typically see jobless claims move higher having done so 85% of the time historically since 1967. This week went against those seasonal trends as the unadjusted number fell from 257.2K to 245.5K. While the seasonally adjusted reading is still above, that is actually below the March 13, 2020 reading. In other words, claims are essentially back to where they were just before the pandemic. That is also the case considering PUA claims are basically negligible around 2.5K for a second week in a row as support for the program has ended.
Continuing claims also set a pandemic low coming in at 2.243 million versus expectations of a decline to 2.42 million. That 237K decline week over week was the largest since the week of July 23rd and the fifth week in a row in which continuing claims were lower.

Including all programs delays the data through the week of October 8th for the most recent reading. Total claims across all programs fell to 2.84 million that week as the unwind of pandemic era programs continue alongside the declines in regular state programs. PUA and PEUC programs once again were the biggest decliners falling by almost 250K and 87K, respectively. In total since the official end of these programs in early September, these two programs have seen claims fall by 8.78 million. Through the week of October 8th, PUA, PEUC, and Extended Benefits programs only accounted for 632K claims combined which are likely to continue to decline in the near future. Click here to view Bespoke’s premium membership options.

Bespoke’s Morning Lineup – 10/28/21 – Deal or No Deal?
See what’s driving market performance around the world in today’s Morning Lineup. Bespoke’s Morning Lineup is the best way to start your trading day. Read it now by starting a two-week trial to Bespoke Premium. CLICK HERE to learn more and start your trial.
“Don’t find fault, find a remedy; anybody can complain.” – Henry Ford
While just about every company reporting earnings has lamented about the semiconductor shortage impacting their business, in Ford’s (F) earnings report last night, the company took a more constructive tone noting that “revenue, net income, adjusted earnings before interest and taxes, cash flow from operations, and adjusted free cash flow were all sharply higher from the second to the third quarter of 2021, driven by significant increases in semiconductor availability and wholesale vehicle shipments from Q2.” The company didn’t say that the shortage is behind us, but it was nice to hear some positive news for a change.
Equity futures are higher this morning with the Nasdaq leading the way, but the gains aren’t even enough to bring us back to levels the major averages were trading at in the final hour of trading yesterday. The S&P 500 is marginally higher on the week, but which side of unchanged it finishes the week will likely hinge on earnings reports from Apple (AAPL) and Amazon.com (AMZN) after the close today.
As if all the earnings news wasn’t enough, there’s also a ton of economic data to contend with both today (Jobless Claims, GDP, Pending Home Sales, and KC Fed) and tomorrow (Employment Cost Index, Personal Income and Spending, Chicago PMI, and Michigan Sentiment). The ECB just announced no major changes to policy in its latest statement noting that its pandemic program will remain in place until at least March, but there will likely be more details to come in the press conference at 8:30 AM. Back here at Home, President Biden is expected to announce details for a framework of a $1.75 trillion social-spending and climate package. Whether Congress can pass it is a whole other story.
Read today’s Morning Lineup for a recap of all the major market news and events from around the world, including the latest US and international COVID trends.
There were some really disparate moves in the US Treasury market yesterday as investors sold the short end of the curve on fears of more aggressive policy tightening down the line. At the same time, they were buying the long end betting that more aggressive tightening will cause a slowdown in growth. You can really see the dynamic playing out in the snapshot from our Trend Analyzer below. The ETFs listed below are sorted by where they closed Wednesday within their respective trading ranges, but they are also perfectly sorted by the maturities of the treasuries they track from the short-end of the curve (most oversold) to the long-end (closest to or above their 50-day moving averages).

The charts below show the performance of the 1-3 Year US Treasury ETF (SHY) and the 20+ Year Treasury ETF (TLT). While the magnitudes of the moves are much smaller for SHY, its price chart looks like a steep cliff, while TLT has seen a nice bounce over the last few days.

Start a two-week trial to Bespoke Premium to read today’s full Morning Lineup.