Communication Services Regaining Its Footing
In the past year, one interesting internal disconnect for the S&P 500’s Communication Services sector has been between price and breadth. By the time price peaked in the late summer, breadth, as measured by the cumulative advance-decline (A/D) line, had been trending lower for several months. In other words, in the middle of last year, an increasingly smaller number of stocks were pulling the sector higher. This past fall, bad breadth hit a climax as the cumulative (A/D) line started to collapse just after the sector’s price set a lower high. Since the recent low for both price and breadth in the first days of December, the two lines have been moving more in tandem with each other.
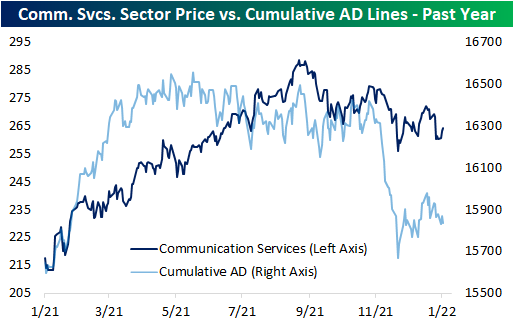
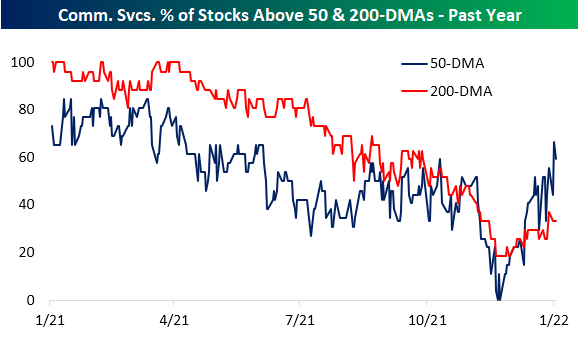
While the cumulative A/D line and price still have plenty of room for further improvement, there has been a significant pickup in the percentage of the sector’s stocks that are trading above their 50 and 200-DMAs. While the reading pulled back slightly to 59.26% yesterday, two-thirds of the sector finished last week above their 50-DMAs which was the strongest reading since April of last year. That reading comes just a little over a month after there was not even a single stock in the sector above its 50-day. The percentage of stocks above their longer-term 200-DMAs has been less impressive with only a third of stocks in the sector currently above that level, but that too has improved in recent weeks. The start of December saw readings in the high teens which marked the worst readings since the COVID Crash. Click here to view Bespoke’s premium membership options.
Another CPI Spike… Now What?
As mentioned in today’s Morning Lineup, the consumer price index (CPI) rose 7.0% year over year in December, the highest rate of increase since 1982. Consumers across America are paying higher prices for everything from bread to gas due to supply chain constraints, labor shortages, easy fiscal and monetary policy, and robust demand. Although this number was in line with estimates, the y/y increase is certainly notable.

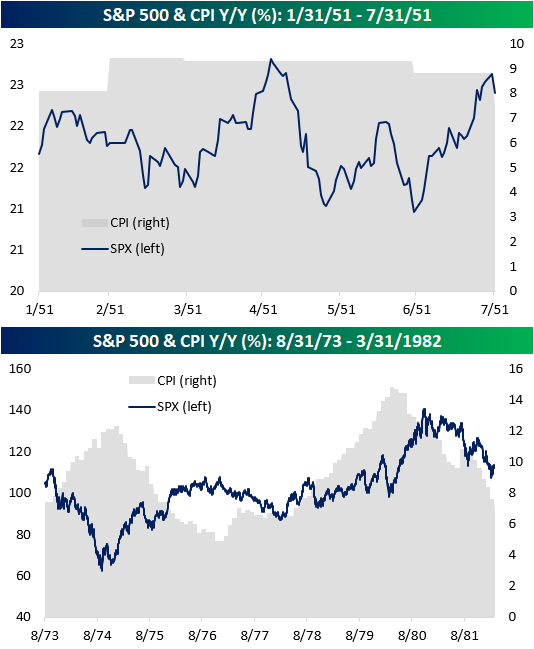
As shown in the chart above, there have only been four other periods since 1950 that y/y CPI reached 7.0% or more (1951, 1973, 1977, 1978), and in the table below we have summarized the performance of the S&P 500 during and after each of those prior periods. Overall, returns were mixed. In January 1951, the S&P 500 was just 0.4% off of its 52-week high when CPI first eclipsed 7%. During the seven months in which CPI remained above 7% on a y/y basis, stocks rallied 3.4%, and one year later, the S&P 500 was up 11.4%.
The longest streak of 7%+ y/y readings occurred between 1978 and 1982 and spanned 46 months. During this streak, the S&P 500 gained just 15.1% over the course of almost four years and just 1.8% in the year following the first reading over 7.0% in May 1978.
In between the 1951 and 1978 periods, there were two other occurrences where CPI eclipsed 7% on a y/y basis in 1973 (28 months) and 1977 (one month), and during both of these periods, equities traded lower.

As you can see from the charts below, the S&P 500 has acted differently each time CPI topped 7.0% on a Y/Y basis. In the first half of 1951, it appeared to trade independently of the elevated inflation readings, moving sideways as CPI readings remained elevated. For much of the 1970’s, however, CPI and the S&P 500 tended to move in opposite directions. Nonetheless, much of the gains experienced in the 70’s were in periods when the rate at which prices were increasing was on the decline. Inflation has typically been considered a negative backdrop of equity prices but a key factor behind that performance is how long-lasting the inflation is. In the early 1950s, when the elevated level of inflation was short-lived, equities, which were already near 52-week highs, performed fine. In the 1970s, though, when inflation was more entrenched, the backdrop for equities was negative. Stay on top of market trends by becoming a Bespoke subscriber today. Click here to view Bespoke’s premium membership options.
The Best and Worst of Q4 Earnings
Earnings season begins this week as corporations report their Q4 results and wrap up fiscal year 2021. Earnings season unofficially begins when the large banks begin reporting their earnings and concludes when Walmart (WMT) releases its results.
We do a lot of earnings season analysis using our Earnings Explorer tool, which is available to Bespoke Institutional subscribers. One type of analysis is tracking how share prices typically react to earnings reports. Since the start of 2011, there have been certain companies that have excelled after reporting Q4 results specifically, while others have historically struggled. Of the companies that have at least five years worth of Q4 reports, Netflix (NFLX), Etsy (ETSY), and SolarEdge (SEDG) have been the S&P 500’s three top performers, averaging 12.4%, 9.6%, and 8.3% gains on their Q4 earnings reaction days, respectively. Charles River Laboratories (CRL), Darden Restaurants (DRI), Signature Bank (SBNY), and Lamb Weston (LW) have beaten Q4 sales estimates every time, while ETSY, Fortinet (FTNT), EPAM Systems (EPAM), Meta Platforms (FB), and LW have beaten Q4 EPS estimates 100% of the time.

Using our Earnings Explorer, below is a look at how Netflix (NFLX) has historically performed on its earnings reaction days broken out by quarter. (For a stock that reports in the morning before the open, that day is its “earnings reaction day.” For a stock that reports after the close, the next trading day is its “earnings reaction day.”) Remarkably, NFLX has historically averaged declines on its earnings reaction days for Q1, Q2, and Q3 earnings releases, but it has absolutely soared on its Q4 earnings reaction days. As shown, the stock has historically averaged a one-day gain of 10.72% on its Q4 earnings reaction day with positive returns 74% of the time. (Conversely, the stock has historically averaged a decline of 6% on its Q2 earnings reaction day (typically in July) with positive returns just 20% of the time.)

As shown, post-COVID, Netflix (NFLX) has had seven quarterly earnings releases, and the only one that the stock reacted positively to was its Q4 2020 report last January when it gained 16.85%. The stock fell 2% or more on each of its six other earnings reaction days post-COVID.

SolarEdge (SEDG) is a stock from the table above that has traded positively on every single one of its Q4 earnings reaction days. Below is a snapshot of SEDG’s historical Q4 reports from our Earnings Explorer tool. As shown, SEDG has historically averaged a one-day gain of 8.3% on its Q4 earnings reaction day with positive returns six out of six times.

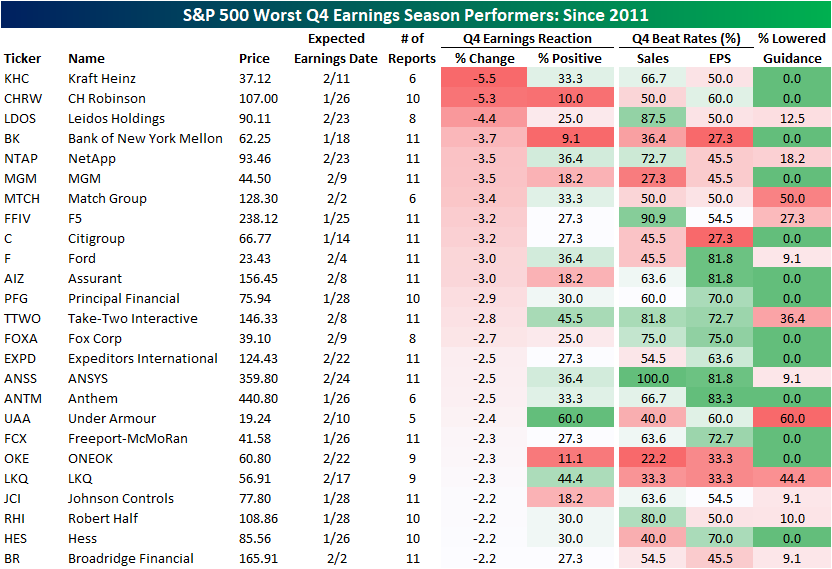
On the other side of the equation, Kraft Heinz (KHC), CH Robinson (CHRW), and Leidos Holdings (LDOS) have historically been the S&P 500’s worst performers after reporting Q4 earnings, averaging a decline of 5.5%, 5.3%, and 4.4% on earnings reaction days since 2011, respectively. None of these names have declined 100% of the time since, but Bank of New York Mellon (BK), CHRW, and ONEOK (OKE) have performed positively less than 15% of the time on Q4 earnings reaction days. Match Group (MTCH) and Under Armour (UAA) have lowered guidance at least 50% of the time on Q4 earnings, and BK, MGM (MGM), Citigroup (C), Ford (F), Under Armour (UAA), OKE, LNQ (LNQ), and Hess (HES) have missed Q4 sales estimates over half of the time.
Turning back to our Earnings Explorer, since the start of the 2020, NetApp (NTAP) has traded lower following an earnings report three times, two of which occurred in Q4. Interestingly, in the Q4 of fiscal year 2020 release, revenues and EPS beat estimates, but the equity still traded lower by nearly 14.5%. NTAP has not experienced gains on a Q4 earnings reaction day in four consecutive years.

As always, past performance is no guarantee of future results, and this is not a recommendation to buy or sell any specific securities.
If you want to stay up to date on earnings reports, we recommend that you start a 14-day trial to our Bespoke Institutional package. With this subscription, you will receive earnings coverage for the most crucial companies through our Conference Call Recaps section.
Small Pickup in Small Business Sentiment
The NFIB’s reading on small business sentiment has generally been on the decline over the past few years, although it’s also well off the lows set during the depths of the pandemic. In October, the index hit the lowest level since last March, and the past two months have seen a modest bounce off that October low, leaving small business sentiment middling versus its historical range.

While the headline number is far from any significant high or low, the individual components of the report are showing another story. Employment-related indicators are around some of the highest readings on record while a handful of other categories like Expectations for the Economy to Improve are near some of the lowest.

Rising slightly off the November reading, which was tied with November 2012 for the lowest on record, firms continue to have a historically sour outlook for the economy. While there are some other areas that are at the low end of their range of historical readings, this index is by far the most depressed area of the report.

One potential reason for the pessimistic outlook could of course be the resurgence of COVID cases, but another likely reason, as we noted in today’s Morning Lineup, is inflation. The index tracking the rate at which firms report higher prices peaked in November but remains extremely elevated at 57. Meanwhile, a record high 22% of responding businesses reported inflation as their biggest concern.
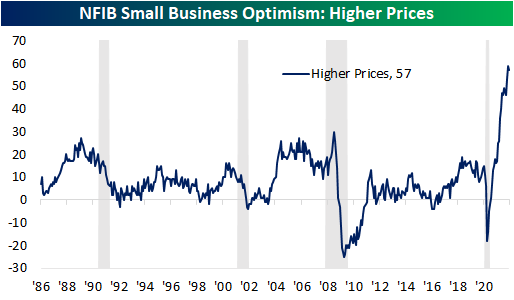
Although costs are soaring, on the bright side, the employment situation is very strong. Firms reported an increase in hiring plans with the index rising to 28, the highest level since August while the net change in employment was positive for the first time since April. That is also only the second positive reading since the pandemic began. As with other costs, compensation is at an unprecedented level with the index setting a new record high in December. Compensation plans have now gone unchanged at 32 in back-to-back months. Responding firms also are reporting continued difficulties hiring with the Job Openings Hard to Fill index maintaining its lofty readings after gaining one point in December. Click here to view Bespoke’s premium membership options.

Dividends Outperform With Discrepancy
In last week’s Bespoke Report, we performed a decile breakdown of year to date performance of Russell 1,000 members based on a variety of factors ranging from valuations to performance in 2021. One standout attribute of stocks that has been driving performance this year has been dividend yields. Expanding to the broader Russell 3,000, as shown below, the decile of stocks that pay no dividend is down a dramatic 5.69% on average this year. Meanwhile, deciles 7 through 10 with the highest dividend yields are all firmly in the green with average gains ranging from 1.93% to 2.38%.

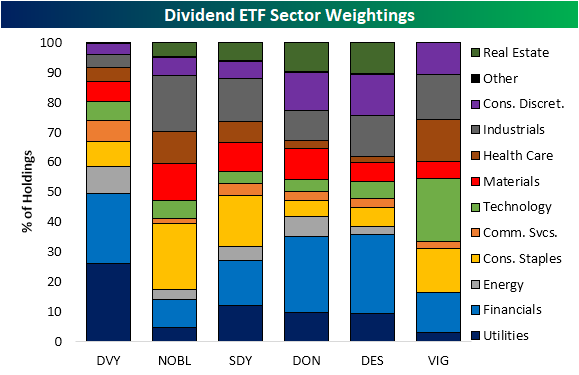
With dividend payers significantly outperforming, it is worth mentioning which stocks tend to have the highest dividend yields. In the chart below, we show the average dividend yield for stocks of each sector of the Russell 3,000. Utilities, Real Estate, and Financials all top the list with average yields above 2% while Health Care and Technology stocks, on an average basis, offer hardly any yield at all.

Given the outperformance of high-yielding stocks this year, some dividend-focused ETFs are up the most versus other investment styles highlighted in the styles screen of our Trend Analyzer, but there is a decent bit of dispersion for various ETFs tracking this theme as they have slightly different methodologies/more granular focuses.
The iShares Select Dividend ETF (DVY) is currently up the most year to date ( 2.5%) as it has also outperformed for most of the time since the start of last year (dark blue line). Additionally, the recent move higher resulted in a significant breakout to the upside. The next best performing dividend ETFs this year have been market cap focused with the WisdomTree SmallCap Dividend ETF (DES) gaining 0.09% and its mid-cap centered peer (DON) which has risen 0.29% YTD. Like DVY, these two ETFs have also tended to outperform over the past year, though neither has broken out in the same way as DVY, stopping short of prior highs even with solid gains late last year and to start this year.
On the other hand, dividend growers proxied by ETFs like the S&P 500 Dividend Aristocrats (NOBL), Dividend Appreciation ETF (VIG), and S&P Dividend ETF (SDY) have underperformed some of their peers since the end of 2020, but recently hit new highs and have generally trended higher since last year. More recently in 2022, though, they have actually sold off and are each in the red YTD.
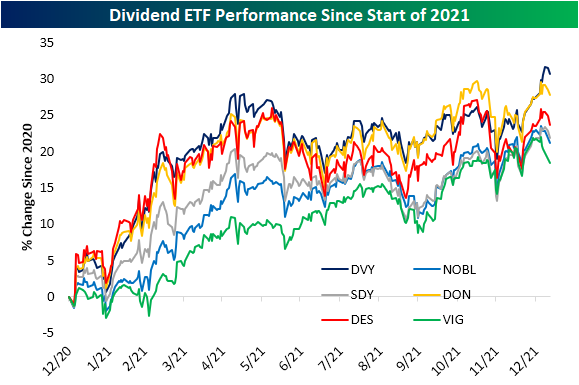
Again, each of the ETFs shown above have different methodologies for selecting their holdings, ranging from a history of dividend growth or market cap size which factors into performance. One other factor, however, for the difference in performance also has to do with sector exposure. This year, Financials have been one of the top-performing sectors and as mentioned earlier, is one of the highest yielding sectors. The top-performing dividend ETFs have the highest weight in Financials. DVY, DON, and DES each have around a quarter of their holdings in this sector. The other best performing sector this year, Energy, also accounts for a significantly larger portion of DVY and DON versus other dividend ETFs. Conversely, VIG has a much larger weight in Tech and Health Care, which have been the second and third-worst performing sectors this year, and that exposure helps to explain much of its YTD underperformance. Click here to view Bespoke’s premium membership options.
J.P. Morgan Health Care Conference Kickoff
The 40th annual J.P. Morgan Health Care Conference kicks off today, and because of COVID concerns, this year’s event will be held virtually. One of the largest conferences for the Health Care sector, especially in regards to health care investment, this conference brings together investors and hundreds of companies to stay up to date on the pulse of the Health Care sector. Looking back since 2001, the conference has coincided with solid performance for the S&P 500 Health Care sector with positive performance 62% of the time and an average gain of 0.56% during the four-day event. During last year’s conference, which was also held virtually, the Health Care sector declined 0.7% which was the worst performance since 2009. As for the biotech industry, which the conference’s focus is rooted in since it began in the early 1980s, it heads into this year with three consecutive years of positive performance. Compared to the broader sector, the S&P 500 Biotech industry has averaged an even better 1.15% gain during the annual conference since 2001 and has seen a move higher a little better than three-quarters of the time. Click here to view Bespoke’s premium membership options.

Differentiation Within Growth
So far in 2022, growth stocks have broadly sold-off and the Russell 1000 Growth Index has declined by 6.9%. However, not all growth stocks are the same, and it may be inaccurate to say that “growth stocks” in general are getting hit with this market downturn. Within the Russell 1,000 Growth index, names with the most aggressive valuations and higher multiples have performed far worse than those will lower multiples. Certain groups of the Russell 1000 Growth Index members have outperformed the S&P 500 on a year-to-date basis. The 20% of members with the lowest price to earnings ratios have averaged a YTD decline of just 1.7% while the S&P 500 has lost 3.3% of its value. The 10% of stocks with the lowest price to book ratio have outperformed the market as well, declining just 1.8% this year. As you can see from the charts below, the higher the multiple, the worse the 2022 performance. The 20% of members with the highest P/B ratios have averaged a loss that is over three times that of the S&P 500 (10.5%). The 20% of stocks with the highest PE ratios in the index have averaged a reduction of 12.6%, almost four times the loss of the S&P 500.


A similar trend is seen when comparing YTD performance against price to sales deciles. The 10% of members with the highest P/S ratios have averaged a 15.9% turn down in 2022, while the 40% of names with lower P/S ratios have averaged a decline of 3.5%.

For investors looking for growth, there are two ways to look at this. The first line of thought is to believe that the most aggressive equities (think RIVN, PLUG, DOCU, CVNA, and UBER) have sold off at unreasonable rates, and there are presently buying opportunities. The other available option is to think that the outperformance from growth at a reasonable price stocks (i.e. OLN, RKT, OPEN, VRM, and GS) will continue moving forward as, among other factors, the fed hikes interest rates. Stay on top of market trends like growth versus value by becoming a Bespoke subscriber today. Click here to view Bespoke’s premium membership options.
Of the 25 stocks with the lowest P/E ratios in the Russell 1000 Growth Index, the average YTD performance is -1.5% (median: -1.4%), which is far better than the broader market. The average stock on this list is off of its 52 week high by 20.6% (median: 18.0%) and returned 33.3% from price appreciation alone in 2021 (median: 33.7%). 48% of these names are positive so far in 2022, which is impressive given that the Russell 1,000 Growth index has already fallen by 6.9% this year.

Bespoke Brunch Reads: 1/9/22
Welcome to Bespoke Brunch Reads — a linkfest of the favorite things we read over the past week. The links are mostly market related, but there are some other interesting subjects covered as well. We hope you enjoy the food for thought as a supplement to the research we provide you during the week.
While you’re here, join Bespoke Premium with a 30-day free trial!
COVID Country
COVID-positive nurses say they’re being pressured to work while sick, and they’re petrified of infecting patients by Allan Akhtar and Aria Bendix (Insider)
Nurses that still have symptoms of confirmed positive COVID infections are being asked to return to work in hospitals in Kentucky and around the country. [Link]
White House, USPS finalizing plans to begin shipping coronavirus test kits to U.S. households by Jacob Bogage and Dan Diamond (WaPo)
The White House and USPS are finalizing plans to ship half a billion at-home COVID tests across the country with the first packages rolling out the door by mid-January if everything goes according to plan. [Link; soft paywall]
Belief in Having Had COVID-19 Linked With Long COVID Symptoms by Anita Slomski (JAMA)
While there is no doubt that some COVID sufferers have symptoms which last much longer than the acute infection, there’s a lot of uncertainty over how pervasive and severe long COVID is. This study showed that while belief that a person had actually been infected with COVID wasn’t correlated with the presence of antibodies for the disease, that same belief was positively correlated with “long COVID” presentations, suggesting a material psycho-somatic effect. [Link]
Indiana life insurance CEO says deaths are up 40% among people ages 18-64 by Margaret Menge (The Center Square)
Indiana insurance company OneAmerica reported that death rates for 18-64 year-olds had risen 40% versus pre-pandemic, a historic increase that illustrates just how heavy the burden of COVID has been on American society. [Link]
COVID & Children
Characteristics and Clinical Outcomes of Children and Adolescents Aged <18 Years Hospitalized with COVID-19 — Six Hospitals, United States, July–August 2021 by Alentine Wanga et al (CDC)
A survey of COVID cases in Southern hospitals identifies potential risk factors for children: over 80% had an identified underlying medical condition, two-thirds were obese, and virtually none were vaccinated. [Link]
Pandemic babies displaying developmental delays — even if their mothers didn’t have COVID (Study Finds)
Pandemic babies are showing slower cognitive and social development than pre-pandemic children, regardless of whether or not expecting mothers had COVID. [Link]
No Way to Grow Up by David Leonhardt (NYT)
Children are falling behind in school, suffering more mental health crises including suicide attempts, exposed to more gun violence, and are exhibiting more behavioral issues as the weight of the pandemic falls on the youngest members of society. [Link; soft paywall]
Embrace The Cold
Could Being Cold Actually Be Good for You? by Max G. Levy (Wired)
A range of studies of showed that being cold regularly is a good way to stimulate your body’s metabolism and force adaptations that can help reduce the effects of diabetes. [Link]
BTCS First-ever Nasdaq-listed Company to Offer a Dividend Payable in Bitcoin (Yahoo! Finance/Globe Newsire)
A NASDAQ-listed company which has delivered 69% losses per year since the end of 2010 announced it would start paying dividends denominated in bitcoin. Shares were up 40% in response but if history is any indication will return to their habitual declines soon. [Link]
Energy
Harold Hamm: ‘Republican, Democrat . . . I’m an oilocrat’ by Derek Brower (FT)
The Continental Resources founder wants coal plants closed so his natural gas empire can profit (and with a side of carbon reduction. Battery-electric vehicles, wind, and solar? Right out. [Link; paywall]
Is Nuclear Power Part of the Climate Solution? by Gernot Wagner (WSJ)
As most of the world’s nuclear reactors age and approach retirement (along with the 10% of global electricity they produce), the technology is at a turning point amidst demands for decarbonized power. [Link; paywall]
Labor Markets
‘Hottest it’s ever been’: why US labour market is stronger than it seems by Colby Smith, Andrew Edgecliffe-Johnson, and Christine Zhang (FT)
Official data points are finally catching up to anecdotes, as illustrated by this excellent round-up off labor market data. [Link]
Read Bespoke’s most actionable market research by joining Bespoke Premium today! Get started here.
Have a great weekend!
Help Wanted: Predicting Monthly Employment
Predicting economic data has been difficult in the post-pandemic era, but economists have had a particularly difficult time trying to forecast the monthly number of jobs created in the US economy. This Friday’s Non-Farm Payrolls (NFP) report was a perfect example. While economists were expecting growth in payrolls of around half a million, the actual reading came in much weaker at 199K. December’s whiff wasn’t just a one-off either. Last month, economists were even further off the mark when actual payrolls in November came in 340K below forecasts. Since the pandemic really started to impact the economy in March 2020, the monthly NFP has been more than 100K off the mark in 17 out of 22 months, or 77% of the time. Prior to the pandemic, meanwhile, NFP forecasts were only off the mark by more than 100K less than 20% of the time.
Another way to highlight just how difficult it has been for economists to forecast the monthly number of jobs created in the US economy, in the chart below we compare the average spread between actual and estimated monthly payrolls from 1998 through 2019 versus the spread for each month in 2021. For this analysis, we left out 2020 as the magnitude of the disruption to the economy was. admittedly, impossible to predict. Even in 2021, though, the only month where economists were closer than average to predicting the actual number of jobs created was for the January 2021 report where the consensus forecast was less than 60K off the initially reported level of payrolls.
As the start of the pandemic moves further back in the rearview mirror, it should become easier for economists to gauge the performance of the economy, but as 2021 has shown us, there’s still plenty of room for improvement. Click here to view Bespoke’s premium membership options.

Corporate America Quotes From Early Earnings Reports
With earnings season on the horizon, we wanted to provide you with insights into some of the issues (both positive and negative) experienced by companies that have already reported. Although every company handles challenges differently, these commentaries can prepare investors for what to expect throughout the upcoming earnings season. We selected some of the largest companies that reported this week and went through their conference calls and pulled some quotes concerning key macro issues each one has experienced. For a deeper dive into earnings calls that we find vital, click here to see our Q4 Conference Call Recaps. Throughout earnings season we will continue to update this analysis with key insights into both macroeconomic and company-specific trends.
Constellation Brands (STZ)
- Consumer-facing prices appear to be rising as CEO Bill Newlands stated, “We expect price increases within our beer portfolio to last, slightly above our typical 1% to 2% range.”
- Newlands continued, “we continue to expect our gross margin to be negatively impacted for the fiscal year as benefits from price and cost savings agenda are expected to be more than offset by cost headwinds… as the inflationary environment resulting from economic supply chain and other by-products of the pandemic continues to be dynamic and vertical.”
- Diving even deeper into the inflationary pressures, Newlands added, “We expect significant cost increases for the business including supply chain disruption inflationary cost pressures on product freight and warehousing costs… and we are diligently working to address the brown glass shortage that is acting as a headwind.”
Bed Bath & Beyond (BBBY)
- Supply chain concerns appear to be persistent as CEO Mark Tritton commented, “While we effectively offset higher freight costs that have been at the core of global supply chain pressures, increasing inventory disruptions impacted our ability to meet demand during the holiday season… we experienced a slower start to sales in September and October.”
- Tritton proceeded, “The customer experience was compromised as strong demand wasn’t met with strong product availability.”
- On a positive note for retailers, in-person shopping appears to be picking up. “We’re also pleased to see customers return to brick-and-mortar shopping this year as our U.S. stores delivered mid-single-digit sales comps over this five-day holiday [Thanksgiving weekend] period,” according to Tritton.
Conagra Brands (CAG)
- Although CAG experienced the same inflationary headwinds, it was more optimistic about the future. According to CEO Sean Connolly, “We expect margins to improve in the second half of the fiscal year as a result of the levers we pulled and continue to pull to manage the impact of inflation… Given the magnitude of the cost increases, our actions also include additional inflation-driven pricing.”
- Connolly explained, “We’re increasing our organic net sales guidance based on stronger than expected consumer demand and lower than anticipated elasticities,” which implies that price hikes are having little impact on demand, meaning companies are likely to continue increasing consumer-facing prices.
Helen of Troy (HELE)
- Although sales grew year over year, “online sales declined approximately 7% in the quarter, reflecting similar channel trends to those we saw in the second quarter.” As per CEO Julien Mininberg, consumers appear to be decreasing the rate at which they engage in commerce online, which may be a headwind for companies like SHOP, EBAY, and AMZN.
- Methods used to combat rising cost pressures “include a strategic increase in inventory, leveraging of pre-negotiated sea freight container rates, several efficiency and cost control initiatives, and price increases,” according to Mininberg.
Lamb Weston (LW)
- CEO Tom Werner stated, “We generated strong sales and solid demand across our food-away from home channels, drove volume growth, and the initial benefits of our recent pricing actions began to offset inflationary pressures.”
- The labor market seems to be improving for LW, and Werner commented, “Our efforts to stabilize our manufacturing operations are on track, including increasing staffing at our processing plants to improve production run rates and throughput.”
- Giving insight to consumer eating habits, Werner added, “In the US, overall fry demand and restaurant traffic in the quarter remained solid, especially at quick-service restaurants where demand has continued to be strong and above pre-pandemic levels. Traffic at full-service restaurants during the quarter was also solid but remained below pre-pandemic levels… Demand at non-commercial outlets also improved during the quarter but continued to be below pre-pandemic levels.”
Lindsay (LNN)
- CEO Randy Wood commented, “Turning to the current operating environment. Material cost increases and supply chain constraints continue to impact our business and we expect that to persist through the spring and summer seasons… we continue to pass through cost increases and see a rational pricing environment in the market.” The inflationary pressures do not seem to be going anywhere, as companies across the board have reported continued cost increases on the supply side.
- As labor issues persist, companies are increasingly finding ways to replace humans with automation. According to Wood, “we continue to enhance both the FieldNET and RoadConnect platforms. We see growth in adoption of these technologies that reduce labor and improved efficiency for our customers”
- International farmings markets appear to be strong. Wood explained, “In international irrigation, we see some of the same positive market drivers linked to strong commodity prices and farm income in the developed markets including Brazil, where we continue to set shipping records, Australia, New Zealand and Western Europe.”
Schnitzer Steel (SCHN)
- Although steel demand remained strong, supply chain issues caused slippage. CEO Tamara Lundgren stated, “Our record results this quarter would have been even stronger had several contracted shipments for November not slipped into December, due to COVID-19 related supply chain disruptions… the supply chain impact on shipments is currently difficult to predict.”
- However, the operating environment was still favorable for SCHN. Lundgren explained, “Demand for finished steel continued to increase with prices reaching their highest levels on record. Supply flows remain robust in Q1, despite trucking and COVID related labor shortages in certain markets.”
Walgreens Boots Alliance (WBA)
- WBA offers unique insight into the realm of COVID, as they conduct a solid share of testing and vaccinations. CEO Rosalind Brewer expressed, “Our testing and vaccinations are tailwinds for our business. I’m very proud of the continued success of our core businesses, the strong growth in US retail, and robust recovery in our international market.”
- Brewer added, “In the US, we administered 15.6 million COVID-19 vaccinations within the quarter.”
- CFO James Kehoe disclosed that “Inflation is also on the rise and finally we expect to pass through the majority of these higher costs, but there may be some short-term impacts.”
Acuity Brands (AYI)
- Building management demand appears to be strong, which provides investors with insight into a variety of industries. CEO Neil Ash delineated, “Demand across our end markets remain strong. At the same time, the availability and cost of key inputs remain challenging. In short, it’s the best of times and the most challenging of times.”
- Ash proceeded, “In this dynamic pricing environment, we have been prudent and successful passing on price increases.”
- Consistent with the rest of the companies on this list, AYI faced production restraints. Ash disclosed, “There is a gap in time between when we receive orders and when we fulfill them in normal times, and that is even greater now… While we don’t disclose backlog, what I will say is that it is meaningfully higher than during normal periods.”
Summary
Inflation pressures were at the center of almost every conference call thus far and with supply chain disruptions and labor shortages leading the way as causal factors, are not likely to dissipate any time soon, Due to strong demand, companies appear able to pass these costs directly on to consumers, so do not expect reduced prices at the grocery/department store any time soon. On the bright side for retailers and small businesses, consumers have increased the rate at which they shop in person. Click here to view Bespoke’s premium membership options.