Bespoke’s Morning Lineup – 2/15/22 – On Again, Off Again
See what’s driving market performance around the world in today’s Morning Lineup. Bespoke’s Morning Lineup is the best way to start your trading day. Read it now by starting a two-week trial to Bespoke Premium. CLICK HERE to learn more and start your trial.
“What we know is a drop, what we don’t know is an ocean.” – Isaac Newton
Investors have breathed a sigh of relief this morning on headlines that some Russian troops on the border of Ukraine are starting to return to their bases. Setting aside the fact that it wouldn’t make a lot of sense to take comments from a would-be invader seriously, investors will take any positive news while they can get it. The bottom line is that like the quote above, there is much more we don’t know about the situation at hand than what we do know, and that doesn’t even include the FOMC and the state of the US economy. On the latter, the economic calendar starts to pick up today and for the rest of the week. Today’s reports include PPI and Empire Manufacturing which will both be released at 8:30. For our first take on the data, make sure to listen to our Twitter Spaces where we will break it all down.
Read today’s Morning Lineup for a recap of all the major market news and events from around the world, including the latest US and international COVID trends.
A potential easing of Russia-Ukraine tensions has caused WTI crude oil prices to fall over 3% from yesterday’s close to the lowest levels since – hold on for it – last Friday. With energy prices lower, you would expect Energy stocks to show weakness today, and that’s exactly what we’re seeing in the pre-market with the Energy Select Sector ETF (XLE) trading down nearly 2%. While the positive correlation between crude oil prices and energy stocks is holding up so far today, we would note that in yesterday’s trading the two traded inverse with each other as WTI traded up over 2% while energy stocks traded down more than 2%. That was the first time in over a year that energy stocks were so weak on a day that crude oil was up over 2%.

Despite yesterday’s inverse trading, crude oil and energy stocks have been joined at the hip for the last year. Through the close yesterday, WTI was up 59% over the last year while the Energy sector was up 53%. While those performance numbers are already similar to each other, before Monday’s divergence, less than one percentage point separated their performance over the trailing twelve months. If tensions over Ukraine do in fact ease over the coming days, look for energy prices and therefore energy stocks, to take a breather from their torrid performance this year.

Start a two-week trial to Bespoke Premium to read today’s full Morning Lineup.
One of These Sectors Is Not Like the Others
Looking across the charts of each sector from our Daily Sector Snapshot, trends range from well-defined and longer-term downtrends as is the case for Communication Services to more sideways price action like what we’ve seen lately in the Financials and Industrials sectors. Then there’s Energy. In spite of the broader market weakness, the Energy sector has continued to roar higher having closed at overbought levels (at least one standard deviation above its 50-DMA) every day since the start of the year. In fact, while most sectors are firmly in the red on a year-to-date basis, Energy has rallied over 25%, and it’s only mid-February!
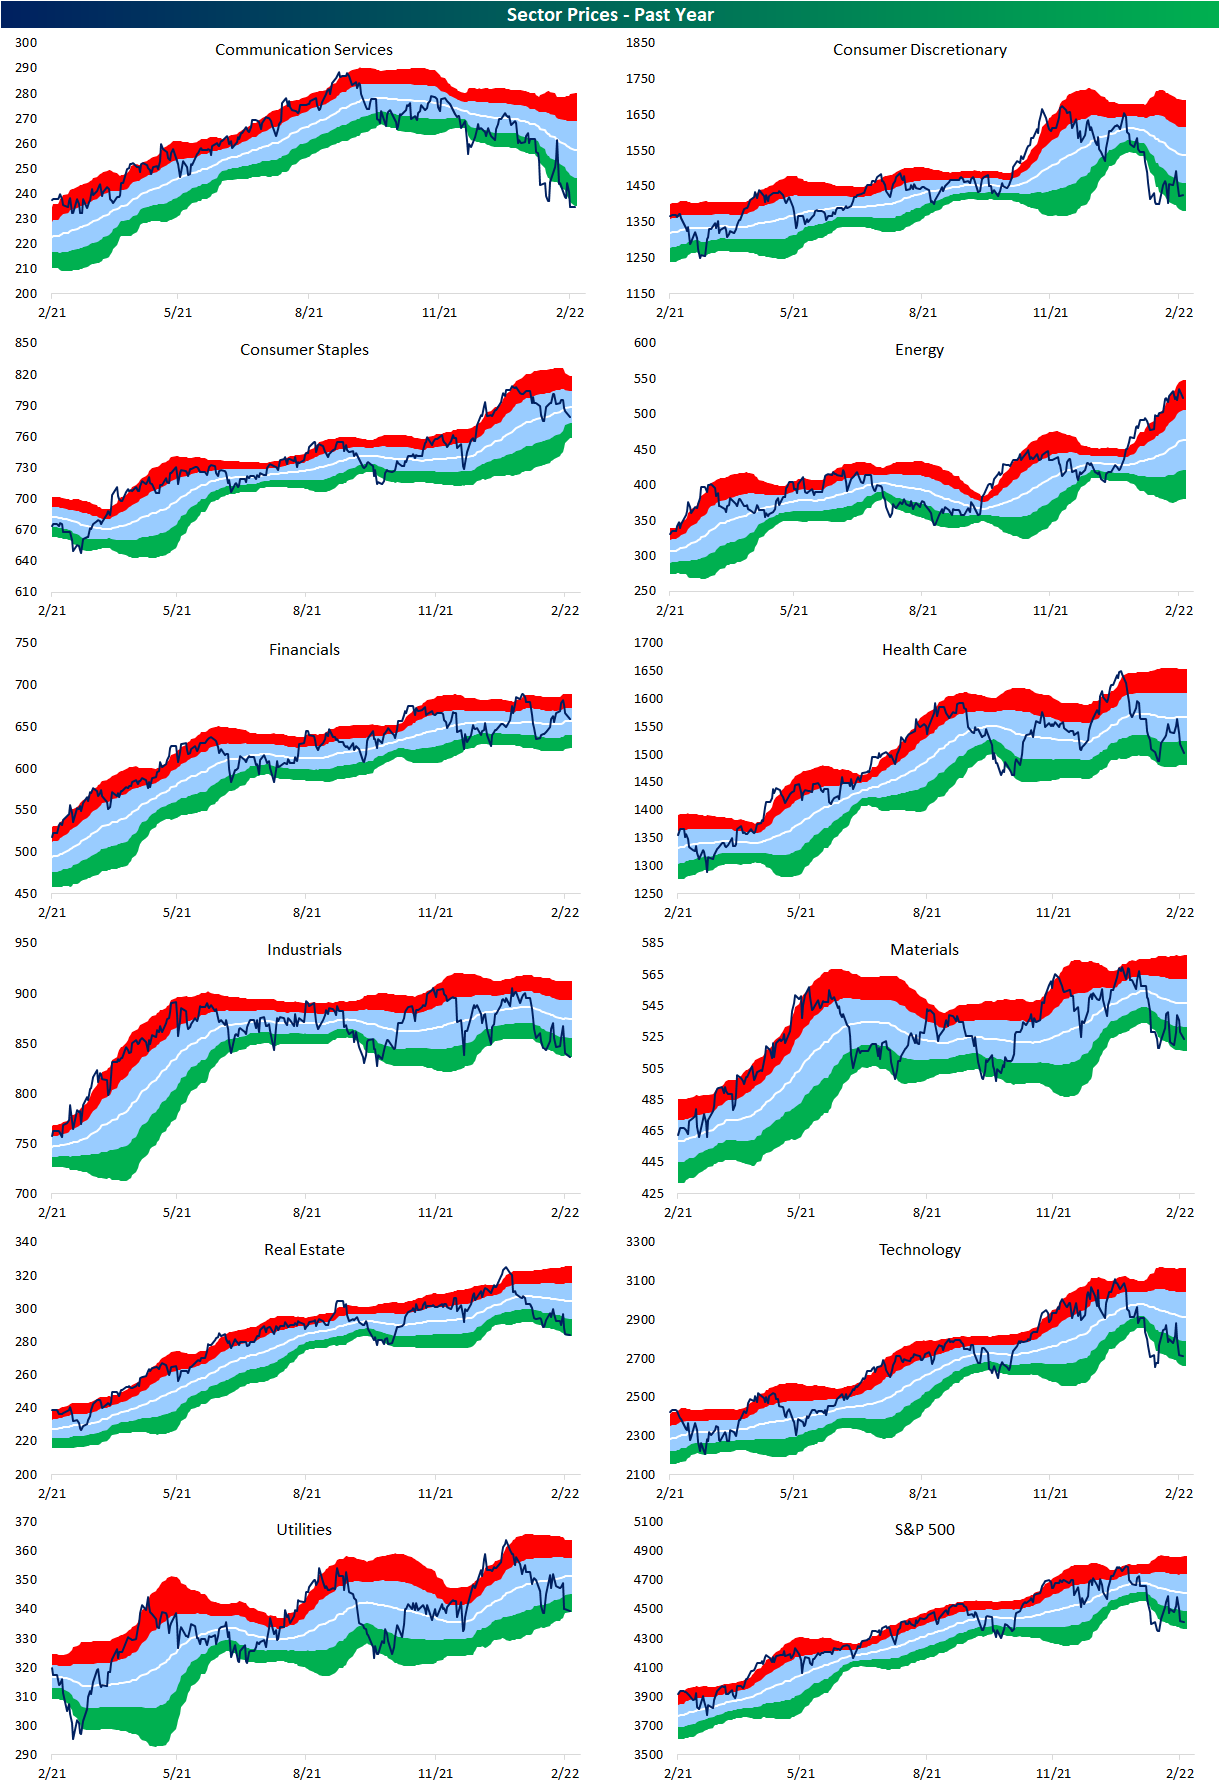
As a result of Energy stocks’ continued outperformance, the ratio of the sector versus the S&P 500 has made a sharp and significant move higher. Ever since the Financial Crisis, the ratio has consistently been grinding lower, meaning Energy has underperformed the broader market. Over the past two months, though, the ratio has seen a record-sized move having risen nearly 35% surpassing the previous record set almost a year ago in March 2021 when the ratio rose 33% in a two-month span. Click here to view Bespoke’s premium membership options.


Bespoke’s Morning Lineup: 2/14/22 – Russia, Russia, Bullard
See what’s driving market performance around the world in today’s Morning Lineup. Bespoke’s Morning Lineup is the best way to start your trading day. Read it now by starting a two-week trial to Bespoke Premium. CLICK HERE to learn more and start your trial.
“I’m just one person on the committee.” – James Bullard
It was looking like a rough start to the week as European equities traded down well over 2% and US futures were lower by more than 1%, but comments from Russian Foreign Minister Sergei Lavrov that appeared to open the door to diplomacy have caused some relief and a rebound in futures. Now, attention has shifted to St. Louis President James Bullard who is being interviewed on CNBC for further insight into his views on inflation.
Read today’s Morning Lineup for a recap of all the major market news and events from around the world, including the latest US and international COVID trends.
After two weak days heading into the weekend, all of the major averages closed out last week back below their 200-day moving averages (DMA). As recently as Wednesday, the DJIA (DIA) was above its 50-DMA, but Thursday’s CPI and subsequent comments from Bullard and then the Russia tensions on Friday pushed the index back below both of those levels. For the Russell 2000 (IWM), neither the 50 nor 200-DMA ever even came into play last week. The Nasdaq 100 (QQQ) managed to barely close above its 200-DMA on Wednesday but closed out the week near its lows as sellers took control. Last but not least, the S&P 500 (SPY) looked to make a run for its 50-DMA on Wednesday but couldn’t quite get there before the tide turned into the end of the week. In down trending markets, moving averages shift from acting as support to resistance, and based on the last several days of trading, moving averages for the major indices have increasingly acted as a ceiling on prices rather than a floor.

Start a two-week trial to Bespoke Premium to read today’s full Morning Lineup.
Bespoke Brunch Reads: 2/13/22
Welcome to Bespoke Brunch Reads — a linkfest of the favorite things we read over the past week. The links are mostly market related, but there are some other interesting subjects covered as well. We hope you enjoy the food for thought as a supplement to the research we provide you during the week.
While you’re here, join Bespoke Premium with a 30-day free trial!
Cashflow
Peloton CEO John Foley to Step Down, Firm to Cut 2,800 Jobs by Cara Lombardo (WSJ)
After a drop-off in demand, connected fitness company Peloton has re-oriented towards slower growth and cut back on ambitions for massive scale. [Link; paywall]
This Could Be When Shale Driller Discipline Cracks, Citi Warns by David Wethe (Bloomberg)
Tight oil management companies are getting ready to raise capex by 40% to take advantage of high crude oil prices, in a move that may cap prices amidst a massive rally in WTI this year. [Link; soft paywall]
Inflation
Bottlenecks and monetary policy by Philip R. Lane (ECB)
A thoughtful examination of the drivers of post-pandemic inflation and how they have been influenced by supply chains and swings in durable goods demand. [Link]
What Are You Expecting? How The Fed Slows Down Inflation Through The Labor Market by Skanda Amarnath and Alex Williams (Employ America)
A critical examination of the conventional wisdom around how monetary actually works in practice, which is likely to leave you wondering whether conventional monetary policy approaches are worthwhile. [Link]
Searching for Maximum Employment by Sarah Albert and Robert G. Valletta (FRBSF)
A series of adjustments to headline labor market data seeking to answer the question “How close are we to maximum employment?”. [Link]
Transportation
Transit Time: Golf cart market picks up speed by Cristina Bolling (The Charlotte Ledger)
With auto prices high and amenities close by, some senior citizens are turning to golf carts for transportation around their neighborhoods. [Link]
Car Insurers Rush to Raise Rates as Inflation Takes a Toll by Leslie Scism (WSJ)
With claims rising thanks to higher prices for repairs, replacement parts, and rental cars, insurers are raising rates to offset the increased cost of covering their clients’ claims. [Link; paywall]
Good Tech
Nuclear fusion heat record a ‘huge step’ in quest for new energy source by Iam Sample (The Guardian)
A test fusion reactor in the UK has set a new record for heat generated during a fusion reaction, emitting the same amount of energy as more than 30 pounds of TNT in a 5 second burst. [Link]
New FDA-approved eye drops could replace reading glasses for millions: “It’s definitely a life changer” (CBS News)
A new eye drop product corrects vision loss that can lead to a need for reading glasses, with drops lasting six to ten hours and costing about $80 for a 1 month supply. [Link; auto-playing video]
Bad Science
SpaceX Satellites Falling Out of Orbit After Solar Storm by Marcia Dunn (Cheddar)
A geomagnetic storm caused by elevated solar activity knocked 40 SpaceX Starlink satellites out of orbit by making the atmosphere thicker and dragging them back to earth. [Link; auto-playing video]
Kids are flocking to Facebook’s ‘metaverse.’ Experts worry predators will follow. by Will Oremus (WaPo)
While Meta’s virtual reality is supposed to be adults only, large numbers of children appear to be getting access to spaces that have few safety tools and present serious dangers to young people. [Link; soft paywall]
Crypto
Alfa Romeo unveils new electric-hybrid SUV with NFT, blockchain technology by Michael Wayland (CNBC)
A new Alfa Romeo model will come with an NFT for buyers, part of the iconic brand’s shift towards electric vehicles by 2027. [Link]
BlackRock Planning to Offer Crypto Trading, Sources Say by Ian Allison (CoinDesk)
The $10trn asset manager is adding crypto trading and credit facilities that allow clients to trade and borrow against existing positions. [Link]
Smart Money
The craziest ways Wall Street is spending this year’s record-setting bonuses by Zachary Kussin and Christopher Cameron (NYP)
Flush with bonuses from booming issuance and strong markets activity, bankers are leaning in to big payouts with caviar, cars, and wine all seeing robust demand. [Link]
Adults Back in Charge of Stock Market as Fed Awakens Big Money by Lu Wang (Yahoo!/Bloomberg)
The retail trading craze has subsided, with institutional volumes ramping up activity as smaller amateurs and market newcomers leaving the scene. [Link; auto-playing video]
Models Behaving Badly
Climate Scientists Encounter Limits of Computer Models, Bedeviling Policy by Robert Lee Hotz (WSJ)
Models for the earth’s climate are necessarily extremely complex, but sometimes adding more detail only makes problems worse. That presents a unique challenge in the effort to better understand how the climate shifts. [Link; paywall]
DNA
Macron refused Russian COVID test in Putin trip over DNA theft fears by Michel Rose (Reuters)
French authorities were so concerned Russian intelligence were trying to get ahold of President Macron’s DNA that they refused to submit to a PCR test during a recent state visit. [Link]
Read Bespoke’s most actionable market research by joining Bespoke Premium today! Get started here.
Have a great weekend!
Super Bowl Indicator
Americans across the country are gearing up for Super Bowl LVI this Sunday. The Rams are currently a four-point favorite, and the Bengals could struggle to contain the league’s best defensive line. Both teams come into this game with their respective offenses on fire, and the last few weeks of the playoffs have resulted in nail-biting finishes.
One outlandish market theory suggests that when the NFC wins the Super Bowl the market will perform better than average. Conversely, when the AFC wins, the market underperforms. Although there is no basis of truth to justify these claims, the conclusion has historically been accurate. As you can see from the table below, the S&P 500 averages a gain of 10.3% from the Super Bowl through year-end when the NFC takes home the Lombardi trophy. On the other hand, when the AFC wins the Super Bowl, the S&P 500 averages a gain of 6.2%, which is 4.1 percentage points lower. The positivity rates have slightly favored an NFC victory as well (78.6% vs 70.4%).
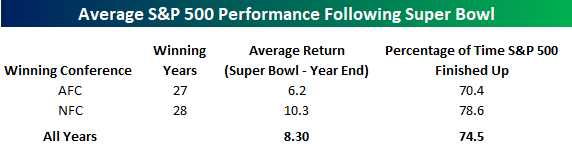
Neither the Rams nor the Bengals have won multiple Super Bowls. The Rams have won just once (in 2000), and this is the Bengals third time competing in the Super Bowl. Of the teams that have won multiple Super Bowls, the S&P 500 has performed best through year-end when the Steelers, 49ers, Broncos, or Bucs take home the trophy. After the Dolphins, Raiders, and Giants won Super Bowls, forward returns were negative on an average basis.
Given that the one Super Bowl the Rams won was in 2000, you would think that the last thing a bull would want to see on Sunday is a win by Matt Stafford and crew. On the other hand, in the two prior Super Bowls that the Bengals played in and lost, the S&P 500 was up over 20% for the remainder of the year both times, so it’s a bit of a push. Within the Bespoke crew, the Bengals are a near but not unanimous pick, Who has heads on the coin toss? Like these charts? See more stock market research from Bespoke by starting a two-week trial to Bespoke Premium today.

Biggest Losers Bounce the Most
The near-term closing low for major US equity indices occurred back on January 27th. Since then, the average stock in the Russell 1,000 is up just under 7% through Friday morning. You can see the low made in the charts below of select ETFs like SPY, QQQ, and ARKK.

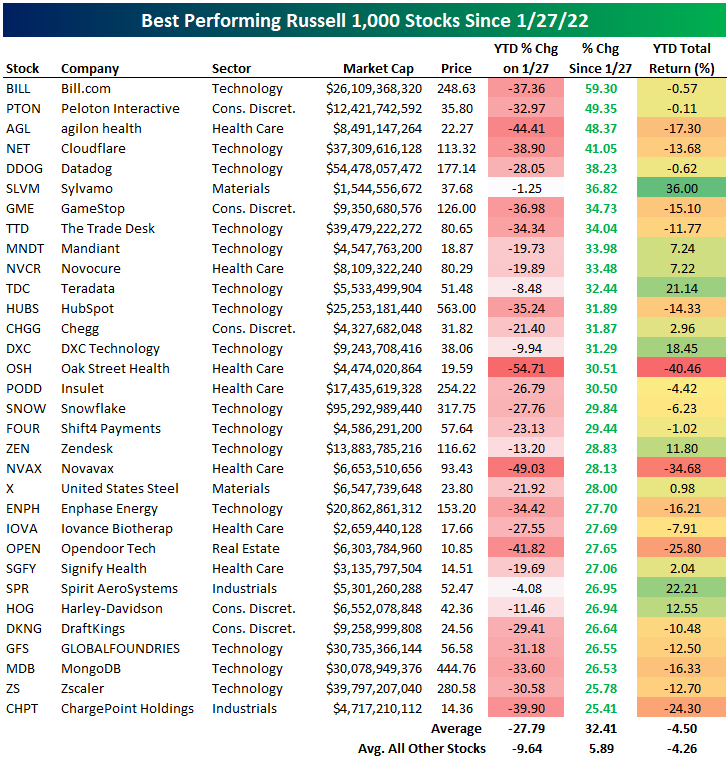
What we’ve seen since the January 27th low is a rip higher in the stocks that had been hit the hardest on a year-to-date basis up to that point. On January 27th, the bottom 10% of stocks in the Russell 1,000 in terms of YTD performance were already down an average of 33.3% on the year! As shown below, this decile of stocks has seen an average bounce back of 14.8% since January 27th. Conversely, the decile of stocks that had held up the best YTD through January 27th are up an average of 4.9% since 1/27.

Below is a list of the 32 stocks in the Russell 1,000 that have rallied 25% or more since the January 27th close just over two weeks ago. At the top of the list is Bill.com (BILL) with a gain of 59.3%. Three other stocks have risen more than 40% — Peloton (PTON), agilon health (AGL), and Cloudflare (NET), while another 12 have risen more than 30%. Other notable stocks on the list include GameStop (GME), Chegg (CHGG), Snowflake (SNOW), Zendesk (ZEN), US Steel (X), Enphase Energy (ENPH), Harley-Davidson (HOG), DraftKings (DKNG), and ChargePoint (CHPT).
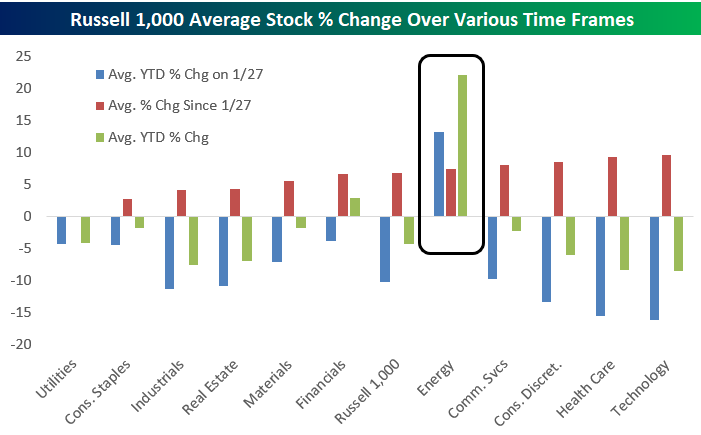
Below we show the average performance of Russell 1,000 stocks by sector over three different time frames: YTD through 1/27, since 1/27, and YTD through today. Technology stocks were down the most YTD on 1/27, they’ve bounced back the most since 1/27, and they’re still down the most YTD of any sector. The biggest standout is Energy, where the average stock is up over each of the three time frames. Year-to-date, the average Energy sector stock is now up more than 22%. Financials is the only other sector that has seen the average stock post gains on a year-to-date basis. Like these charts? See more stock market research from Bespoke by starting a two-week trial to Bespoke Premium today.
Bespoke’s Morning Lineup – 2/11/22 – Nowhere to Hide
See what’s driving market performance around the world in today’s Morning Lineup. Bespoke’s Morning Lineup is the best way to start your trading day. Read it now by starting a two-week trial to Bespoke Premium. CLICK HERE to learn more and start your trial.
“If you’re not a risk taker, you should get the hell out of business.” – Ray Kroc
After yesterday’s E.F. Hutton impersonation by St Louis Fed President James Bullard where he literally spoke and tanked the market, equities are looking to end the week on a high note as futures have erased earlier losses and are now flat to slightly higher. After the market became increasingly concerned with a 50 bps rate hike at the March meeting, some Fed officials were out overnight (Daly and Barkin) downplaying the chances. The only economic indicator on the calendar today is Michigan Confidence which is expected to decline modestly, but the key thing to watch will be inflation expectations.
Read today’s Morning Lineup for a recap of all the major market news and events from around the world, including the latest US and international COVID trends.
One of the more notable aspects of this year’s weakness in the equity market has been the fact that there has been nowhere for investors to hide. Through yesterday’s close, both the S&P 500 and long-term US Treasuries were down over 5% YTD. While there have been other times in the past where the S&P 500 or long-term US Treasuries were down 5% over a six-week period, it’s extremely rare to see them both down 5% at the same time.

The scatter chart below shows the rolling 30-day performance of the S&P 500 ETF (SPY) and the iShares 20+ Year US Treasury ETF (TLT) for every day since 2003. During that span, there have only been 26 days where the rolling 30-trading day return for both ETFs was below negative 5% at the same time. Interesting times indeed!

Start a two-week trial to Bespoke Premium to read today’s full Morning Lineup.
Sector and Index Ratios
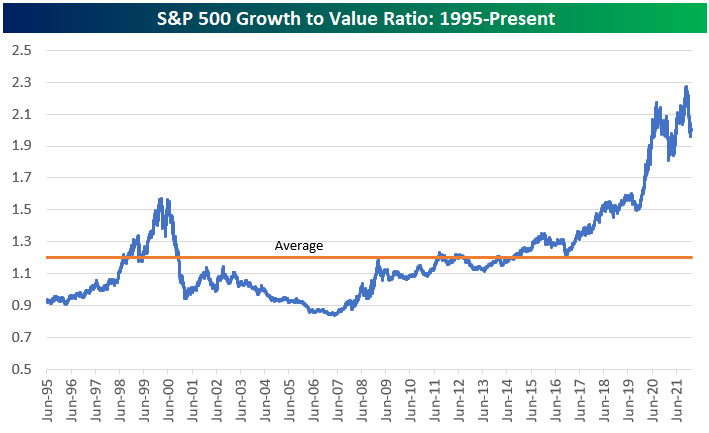
Today we wanted to highlight a number of charts looking at the historical ratio between different stock market indices, sectors, or ETFs. In the first chart, we show the historical ratio between the S&P 500 Growth and Value indices going back to 1995. In this chart, a rising line means Growth is outperforming Value, while a falling line means Value is outperforming Growth. As you can see, Value had a long period of outperformance during the early and mid-2000s after the Tech Bubble burst, but Growth has generally been trending higher versus Value since 2007. The last five years (especially at the onset of the COVID outbreak) saw Growth rapidly outperform Value, taking the ratio to new highs. Over the last month or so, we have seen Value perform well while Growth has stumbled, but this ratio is still significantly above its historical average.
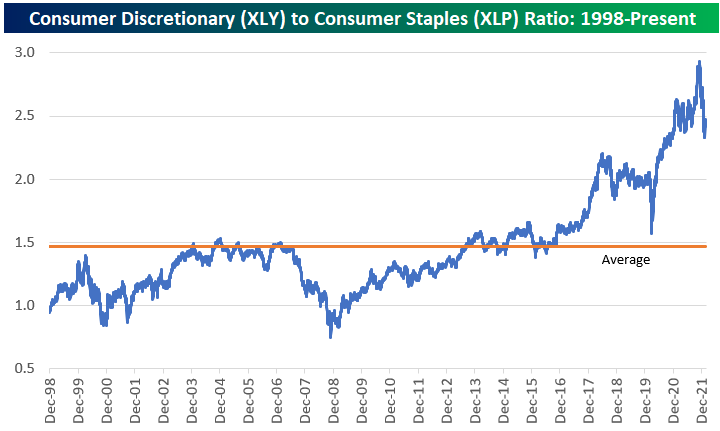
The Consumer Discretionary (XLY) to Consumer Staples (XLP) ratio is somewhat similar to Growth versus Value, as discretionary goods and services are viewed as cyclical while staples are viewed as defensive and non-cyclical. The Consumer Discretionary sector is also heavily weighted towards Amazon.com (AMZN) and Tesla (TSLA). Consumer Discretionary has significantly outperformed Consumer Staples going back to the mid-2010s, but the ratio has dropped quite dramatically over the last couple of months similar to the drop seen during the COVID Crash in February and March 2020. Here again, though, the ratio remains well above its long-term average even after its recent drop.
The S&P 500 Technology (XLK) to Utilities (XLU) ratio is another interesting sector ratio chart. This ratio exploded higher during the late 1990s Tech Bubble, but then it plunged from the peak in early 2000 and continued lower right through the Financial Crisis that ended in early 2009. After hitting 2.5 at the peak of the Dot Com Bubble, the ratio got all the way down to 0.5 at its low. Just recently, the ratio briefly ticked above 2.5, eclipsing its prior high made more than 20 years ago. While the Tech sector has struggled over the last couple of months as the prospect of higher interest rates has weighed on growth stocks, this ratio shows that there is still A LOT to unwind if a new secular shift has begun.

Below we show the ratio of the S&P 500 to the Philly SOX Semiconductor index going back to 1994. In this chart, a rising line means the S&P 500 is outperforming semis, while a falling line means the semis are outperforming. As the “Transports of the 21st Century,” many investors view the semiconductor group as a leading indicator for the broad market. In the bull market of the mid-2000s that followed the bursting of the Dot Com bubble, the S&P actually outperformed the semis throughout. Since the end of 2012, however, we’ve seen the semis steadily outperform. While the semis have underperformed slightly over the past month or so, the move thus far hardly registers on the long-term ratio chart.

Our final two charts relate to US versus international equity markets. Below we highlight the ratio of the S&P 500 (SPY) ETF to the All-World ex-US ETF (CWI) going back to 2007. While international markets outperformed the US coming out of the Dot Com bust during the early and mid-2000s, the US has absolutely crushed the rest of the world over the last ten years. At the moment, the ratio between SPY and CWI is just below its all-time high of 16, which is nearly double the historical average. Similar to growth versus value, the relationship between the US stock market and the rest of the world has stretched dramatically in recent years.

The emerging markets ETF (EEM) goes back to 2003, so we can see its ratio versus the S&P 500 (SPY) a little further back than CWI (shown above). After outperforming SPY significantly from 2003 through 2008, EEM has been underperforming ever since. This is another ratio that has a lot to unwind to get back to “average” levels if a big shift were to occur. Like these charts? See more stock market research from Bespoke by starting a two-week trial to Bespoke Premium today.

Neutral Sentiment Crosses Above 40%
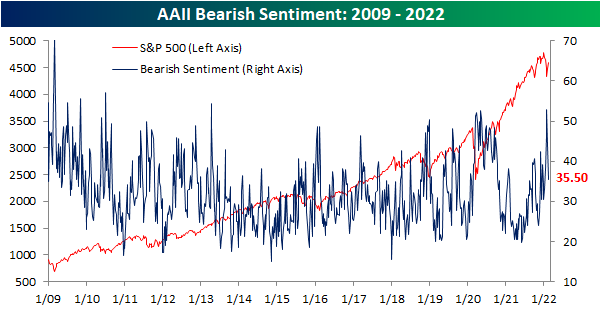
The past week has seen the S&P 500 regain some of its losses as yesterday’s close ran right up to the high from one week prior. In spite of that rally, sentiment has shifted lower with the percentage of respondents to the weekly AAII sentiment survey reporting as bullish falling back below 25% this week after two weeks of higher bullish sentiment readings.
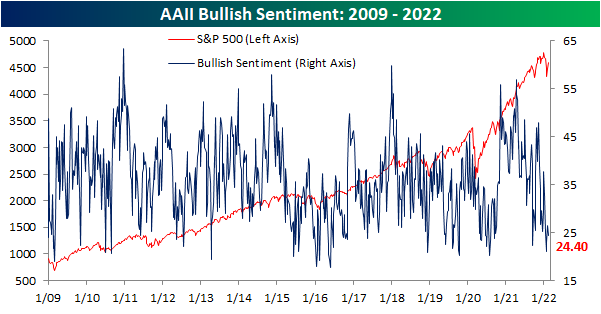
While bulls were lower, bearish sentiment actually experienced another large decline falling from 43.7% last week to 35.5%. That is the lowest level of bearish sentiment since the first week of the year, though it remains above the historical average reading of 30.5%. The two-week decline in bearish sentiment now stands at 17.4 percentage points which is the largest two-week decline since January 2019 when it had fallen over 20 percentage points.
As a result of the moves in bullish and bearish sentiment, overall tones among individual investors remain pessimistic albeit less so than the past couple of weeks.

Given that both bullish and bearish sentiment fell, neutral sentiment borrowed from both readings. Jumping 10.3 percentage points from last week, it was the first time neutral sentiment rose by double-digit percentages week over week since September of last year. While that increase several months ago was actually larger than this week’s rise, the actual level of neutral sentiment is higher this time around. At 40.2%, neutral sentiment saw the highest reading since the first week of 2020.

Crossing above 40%, neutral sentiment is reaching the upper end of its historical distribution of readings. In the past when a similar percentage of respondents have reported that they expect the S&P 500 to be flat in the next six months, the S&P 500 has actually tended to consistently perform positively with longer-term outperformance relative to the norm. Click here to view Bespoke’s premium membership options.

January Peak in Claims Wearing Off
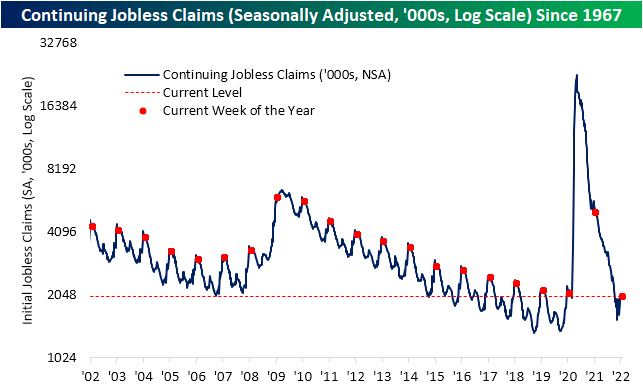
The January spike in jobless claims has continued to unwind in the most recent week’s data. Seasonally adjusted initial claims fell by 16K to 223K versus last week’s 1K upwardly revised reading of 239K. That does not set a new low for claims, only reaching the lowest level since the last week of December and still 35K above the low from the week of December 3rd, but it does mark a third consecutive week of improvement.

On a non-seasonally adjusted basis, claims improved falling to 228.9K. The seasonal peak in claims is now well in the rearview and this week’s reading was essentially right in line with the levels of the comparable week for the few years prior to the pandemic. Historically, the current week of the year has been mixed when it comes to seasonal patterns with claims rising week over week 44% of the time, but in recent years the seasonal tendency has been one of improvement. Other than last year, every year since 2016 has seen NSA claims fall WoW during the current week of the year (6th) with this year marking the largest decline of those.

Continuing claims are delayed an extra week to the initial jobless claims number meaning the most recent print is as of the last week of January. Continuing claims remain below the range of readings in the few decades prior to the pandemic, unchanged versus last week at 1.621 million.

While initial claims are in line with pre-pandemic readings for the same week of the year, continuing claims set a new low for the current week of the year. Click here to view Bespoke’s premium membership options.