Best Performers Since 3/14 Pivot
Early last week, the US equity market pivoted, gaining 1%+ for four consecutive days between last Tuesday and last Friday (3/15-3/18). Sentiment has shifted amongst the investing community for the time being. For now, it seems that the market may have largely priced in some of the most hawkish Fed tightening scenarios. Remember, we already saw huge drops of 50%, 60%, 70%, even 80%+ in many of the most interest-rate sensitive growth stocks before the Fed even lifted off of 0%. How much further were investors expecting them to go?
Since the 3/14 pivot, certain members of the S&P 1500 have already gained over 20%, but still remain well off of 52-week highs. Of the top 35 performers since last Monday, the average stock is still 43.4% off of its 52-week highs (median: 47.1%). Although there is much recovery room left for many of these high-flyers, this is a move in the right direction. The top performing stock since the 3/14 close is GameStop (GME), which has moved 58.0% higher on the back of a 30.9% move today. This may imply that investors have increased their risk appetite, or that retail investors viewed the dip as a buying opportunity, which would likely apply to the broader market from a retail perspective. Selectquote (SLQT) and Nektar Therapeutics (NKTR) rank immediately below GME, gaining 53.7% and 45.9% respectively. Both of these stocks are operating at a loss on the bottom line, which tells us that the risk-on trade has performed strongly over the last week. Other noteworthy names on the list include Tesla (TSLA), Avis Budget (CAR), Etsy (ETSY), NVIDIA (NVDA) and PayPal (PYPL).
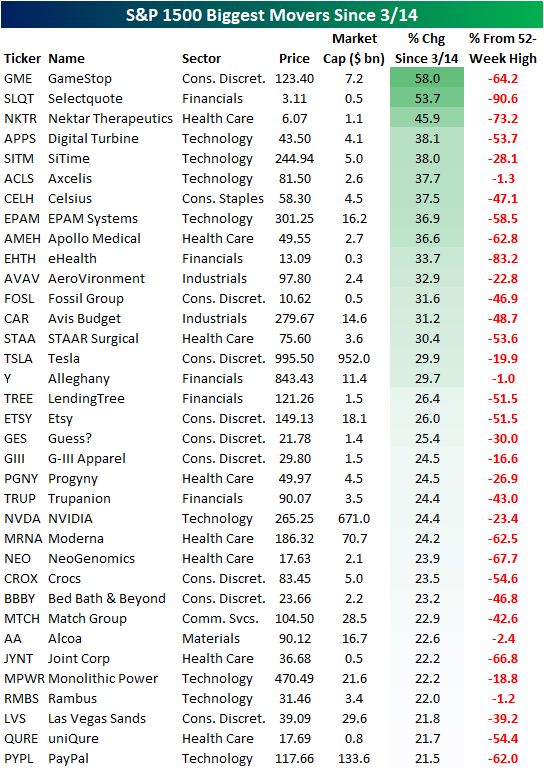
Breaking this down further, the sectors that help up strongly in the face of a downturn earlier this year have performed the worst since the 3/14 pivot. Utilities and Energy members of the S&P 1500 have only gained 0.6% and 2.6% on average, respectively, since last Monday. On the other hand, Consumer Discretionary, Health Care, and Technology members of the S&P 1500 have gained 7.8%, 8.1% and 10.6% on average, respectively. Based on the data below, the sectors most off their highs have rallied the most aggressively since the pivot, while the sector leaders from pre-3/14 have lagged. Click here to try out Bespoke’s premium research service.

None of the information in this report or any opinions expressed constitutes a solicitation of the purchase or sale of any securities or commodities. This is not personalized advice. Investors should do their own research and/or work with an investment professional when making portfolio decisions. Past performance of any investment is not a guarantee of future results. Bespoke representatives or clients may have positions in securities discussed or mentioned in its published content.
Housing Affordability Slides Out of Reach
After a massive surge in housing prices during the pandemic and recovery, the sticker price of housing has soared. Now, with the Federal Reserve starting to raise interest rates and bond markets creaking under the stress, mortgage rates are up to 4.5% and are nearing the highest levels in over a decade. The result is that the cost of occupying a home (that is, monthly payment needed to cover the cost of a house) has soared. As shown in the chart below, the mortgage payment required to cover the median existing home price at the national average mortgage rate is up nearly 30% over the past year, the fastest advance since at least 1987.

Of course, affordability is also a function of income. If wages are rising rapidly, higher mortgage rates and home prices might be offset by more income to cover those payments. To account for this, we convert the monthly payment implied by the median existing home price and the national average mortgage rate into hours, dividing it by the average hourly earnings of non-managerial workers. As shown in the chart below, at the average hourly wage today, a worker would have to work 51.1 hours to cover a monthly mortgage payment. That’s the highest since August of 2008, and shows that the combination of higher home prices and mortgage rates mean that housing is increasingly outpacing incomes. Of course, with supply still tight, demand could fall quite a bit without a big hit to home prices. But the housing market is getting harder and harder to buy in to for most Americans. That also doesn’t include the fact that down payments are rising rapidly. The median existing home required 2,756 hours worth of average hourly earnings assuming 20% down in February; that’s only been surpassed by the blow-off top for home prices in the mid-2000s. Assuming 5% down, which many first-time buyers are eligible for, the numbers look less scary with 689 hours worth of wages needed. But that’s still rising rapidly. Bottom line: housing prices are rapidly outpacing incomes and that will suppress demand, even if it might not be enough to make up for record low inventories. This analysis was first published last Friday in The Bespoke Report, Bespoke’s weekly newsletter. To receive The Bespoke Report and all of Bespoke’s other reports covering sentiment and positioning, sign up for a two-week trial today.

Richmond Rebounds Sans Expectations
So far this month, regional Federal Reserve District readings on manufacturing have been mixed with a stronger than expected reading out of Philadelphia and a much weaker than expected reading out of New York. Today’s release of the Richmond Fed’s index saw the composite reading rise by 12 points to 13 rather than the modest single-point increase that was expected.

The one-month swing in the composite index was on the large side relative to the report’s history. The 12 point month over month gain ranks in the 90th percentile of all monthly moves bringing the index from the low end of its historical range (35th percentile) to the upper end (79th percentile). Given the large increase, breadth in this month’s report was strong across categories with a majority of categories seeing significant month over month increases. Expectations, however, were generally more dour.

Quantifying just how wide of a difference there was in the changes of current conditions and expectations, in the chart below, we show the average spread across each categories month over month change in the current conditions versus expectations indices. In other words, more positive readings would mean current conditions are rising much more rapidly than expectations and vice versa for more deeply negative readings. This month’s reading was the second-highest reading on record outside of March 2020. In other words, this month’s report saw a historic disconnect between the moves in readings on the present situation versus the future outlook.

Whereas the February report saw new orders contract alongside order backlogs and shipments, this month, each index saw a sizeable rebound. New orders grew at a healthy rate as the index rose to 10 and the shipments index is now in a similar area of its historical range after an even larger monthly increase. In fact, one month after one of the largest monthly declines on record for the index, this month’s 20 point gain came up just short of a top 5% monthly increase. Given the strength in new orders, order backlogs also rose while supply chain stress showed further signs of easing as the vendor lead times index fell to 41. While still above December’s low, it marks a significant improvement from October’s high of 67.
Although there were broad improvements in the current condition indices for these categories, expectations were far weaker. The expectation indices for New Orders, Shipments, and Order Backlogs experienced declines ranking in the bottom few percent of all month-over-month changes on record. Similarly, vendor lead times saw a top decile month-over-month gain. In other words, Richmond area manufacturers do not appear to expect the improvement in conditions to carry through over the next several months.

Likely as a result of the abating number of COVID cases, employment metrics improved in March. Firms reported taking on more workers and raising wages at a higher rate. Meanwhile, the length of the average workweek saw a huge 19 point rebound back into positive territory. Firms also reported it was harder to find workers with necessary skills, though, that reading remains significantly improved from record lows set a little under one year ago. We would also note, while demand metrics saw big declines and much weaker levels of expectations indices, expectations indices for employment categories continue to sit at much more historically elevated levels even in spite of some modest declines in March.

Manufacturers continue to report massive price increases relative to other periods in the survey’s history. Prices paid were reported to have risen at an 11.05% annualized rate and prices received rose at a 9.16% clip. While elevated, both readings are still off their January peaks.Click here to view Bespoke’s premium membership options.

Bespoke’s Morning Lineup – 3/22/22 – At the End of the Day…
See what’s driving market performance around the world in today’s Morning Lineup. Bespoke’s Morning Lineup is the best way to start your trading day. Read it now by starting a two-week trial to Bespoke Premium. CLICK HERE to learn more and start your trial.
“Patience and fortitude conquer all things.” – Ralph Waldo Emerson
Treasuries have continued to sell-off this morning following yesterday’s trouncing in the wake of Powell’s comments regarding the potential for a 50 bps rate hike at upcoming FOMC meetings. Equities, on the other hand, have seemingly ignored the higher rates and traded higher. In the commodity space, crude oil and gold are both essentially flat.
In the Russia-Ukraine war, talks for a potential ceasefire have seemingly stalled as the Russians argue that Ukraine is dragging its heels, while Ukraine asserts that it will not cede any land to Russia. Zelensky has now even asked the pope to step in and mediate. As the talks stall, Russia hasn’t let up with its military strikes even after reports suggest that its ground game has been faltering.
Read today’s Morning Lineup for a recap of all the major market news and events from around the world, including the latest US and international COVID trends.
The last week of trading has really seen some extraordinarily strong finishes for the market. The chart below shows the S&P 500’s performance in the last hour of trading so far in 2022. For much of January and through February, the majority of days saw the equity market sell-off into the close. In fact, at one point in late January, the performance of the S&P 500 in the final hour of trading was the weakest since October 1987. Over the last five trading days, though, in the middle of a war in Europe where you would think concerns of overnight headline risk would be at their highest, we have seen five straight days where the S&P 500 has gained at least 0.33% in the last hour of trading. It may not be uncommon to see one or two days of similar gains in the last hour of trading, but to see five straight is extremely rare. In fact, to find the last time this happened, you have to go all the way back to July 2002! Talk about finishing off on a high note!

Start a two-week trial to Bespoke Premium to read today’s full Morning Lineup.
Boeing (BA) and 737 Crashes
Shares of Boeing (BA) are down nearly 4% in today’s session as of this writing on news of a fatal crash of one of the company’s 737 jets in China. Any plane crash which results in fatalities is obviously a tragedy, and our hearts go out to all the victims and their families. While it’s hard to pivot to the market-related implications of these types of events, investors in Boeing and related companies are obviously interested in how these types of events, whether due to mechanical or other issues, will impact their investments. Today’s crash involved one of the company’s 737-800 planes and not the 737-MAX (the variant which was involved in crashes in 2018 and 2019). At this point, there are no details regarding the cause of the crash, but details will likely be forthcoming in the days and weeks ahead.
In the chart below, we show the chart of BA since the start of 2000 and include red dots indicating each time that there has been a fatal incident involving a 737 (any generation of the plane). There have been a total of three dozen incidents internationally prior to today, and historically, these past events have not had any consistent impact on the performance of BA stock.

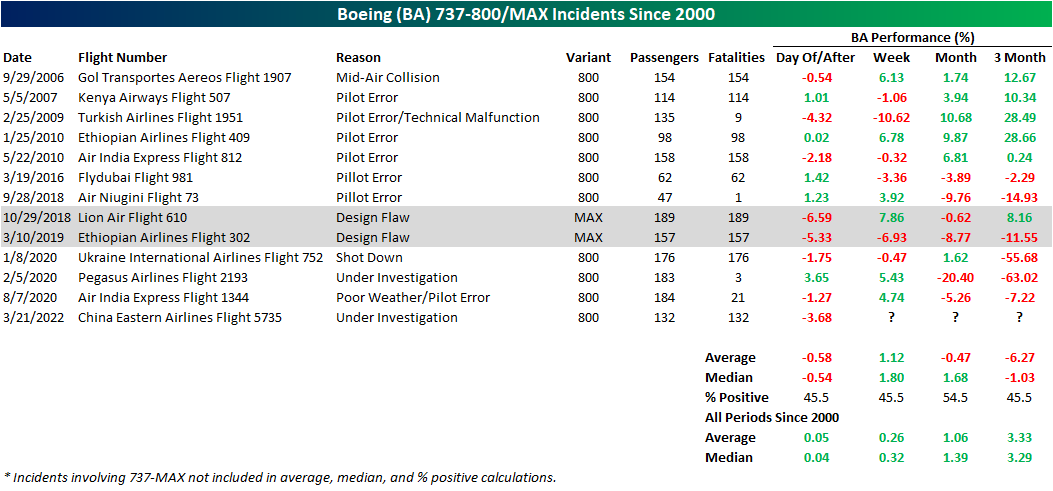
That being said, the immediate reaction in today’s session is set to rank pretty high up on the list of worst declines after a crash involving a 737. Below we show the daily percent change of BA in the first session after a 737 variant had a fatal incident. As might be expected, the 737-MAX crashes in 2018 and 2019 were the two worst single-day declines for the stock of these instances with drops of 6.59% and 5.33%, respectively. The Turkish Airlines Flight 1951 crash in 2009 ranks as the next largest drop of 4.32%. In general, since the 737 MAX issues surfaced, on news of any fatal incident involving 737s, investors have been quick to sell first and ask questions later.

The 737 Next Generation (abbreviated 737NG) which includes the 737-600, 700, 800, and 900 variants is the generation that Boeing produced from 1996 and ceased assembly of in 2019 as the company’s production switched to the 737 MAX. Of the 737NG generation, the 800 variant (the variant involved in today’s crash) is the most common. Given this, in the table below, we show those fatal incidents involving the 800 series since 2000 as well as the two MAX crashes given their importance in recent years. This was the seventh fatal incident involving this plane without any survivors.
Boeing’s stock has mostly seen a negative reaction in response to these incidents and even though the next week has typically seen the stock rebound, performance over the next one and three months, especially since the issues with the MAX began, have tended to be followed by declines. Of course, each of these incidents has a fair degree of nuance to each one. For example, there are numerous reasons as to why these crashes occurred, and the majority had nothing to do with an inherent flaw in the BA aircraft. Whereas the 737-MAX problems were accredited to a design flaw, and thus are more directly negative for Boeing, many of the other incidents were on account of the flight crew or pilot error. Additionally, there is also the issue of poor timing like the early 2020 instances which lined up with the COVID crash. In other words, the weak performance following these crashes had more to do with factors outside of the crashes themselves. Again, any crash, whatever the cause, is a tragedy, but from a market perspective, it’s important to differentiate between the cause behind them. Click here to view Bespoke’s premium membership options.
Bespoke’s Morning Lineup – 3/21/22 – Every Dog Has Its Day
See what’s driving market performance around the world in today’s Morning Lineup. Bespoke’s Morning Lineup is the best way to start your trading day. Read it now by starting a two-week trial to Bespoke Premium. CLICK HERE to learn more and start your trial.
“Let Hercules himself do what he may / The cat will mew and dog will have his day.” – William Shakespeare
After a big rally last week, equity markets are heading into the week a bit groggy this morning as futures are indicated lower to kick off the week. As we note in the commentary of this morning’s report, though, it’s not unprecedented to see weakness following a strong rally into a triple witching options expiration.
Oil prices are near $110 per barrel this morning as Russia-Ukraine tensions show no signs of abating. In fed-speak, there’s a number of speakers on the calendar and the week kicked off with Atlanta Fed President Bostic who said he sees a total of six rate hikes for 2022 and another two in 2023.
Read today’s Morning Lineup for a recap of all the major market news and events from around the world, including the latest US and international COVID trends.
In what was a strong week for the equity market, it was clearly an example of every dog having its day as the worst-performing sector’s YTD led the rally while Energy, the one sector that was up YTD heading into the week, finished in the red. Whether you want to call it a dash for trash or some other variation, sectors that had faced the most serious selling pressure had their shining moment of 2022.

Start a two-week trial to Bespoke Premium to read today’s full Morning Lineup.
Bespoke Brunch Reads: 3/20/22
Welcome to Bespoke Brunch Reads — a linkfest of the favorite things we read over the past week. The links are mostly market related, but there are some other interesting subjects covered as well. We hope you enjoy the food for thought as a supplement to the research we provide you during the week.
While you’re here, join Bespoke Premium with a 30-day free trial!
From The Front Lines
Ukrainian Counteroffensive Near Mykolaiv Relieves Strategic Port City by Yaroslav Trofimov (WSJ)
Russian forces have been pushed back from Mykolaiv in the biggest Ukrainian counter-attack since the start of the war. How the people are digging out as the steady steam of war dead continue to flow back from the front. [Link; paywall]
Ukraine
Economic complexity emerges as a new restraint on wars of conquest by George Pearkes (Atlantic Council)
Sanctions levied against Russia in response to the war in Ukraine illustrate the new, existential restraint on wars of conquest: the threat of broken value chains which underpin the staggeringly complex web of production that supports modern standards of living. [Link]
Aircraft Insurers Brace for Deluge of Russia Claims, With Lloyds on Hot Seat by Katherine Chiglinsky, Siddharth Vikram Philip, and Max Reyes (Bloomberg)
Companies that own commercial aircraft and lease them to airlines are facing massive losses from the requisition of those planes by the Russian government. The question is, how much of that hit will be absorbed by insurance companies? [Link; soft paywall]
Commodities
The $140 Billion Question: Can Russia Sell Its Huge Gold Pile? by Eddie Spence (Yahoo!/Bloomberg)
Gold holdings were meant to “sanctions-proof” the Russian central bank’s massive reserve hoard. In practice, it’s proving hard to deploy that hoard of value to protect the Russian economy from western sanctions, bringing in to question the utility of holding gold as reserves. [Link]
Energy traders call for ‘emergency’ central bank intervention by Claire Jones, Neil Hume, and Martin Arnold (FT)
European commodities trading firms have requested central bank liquidity facilities to help them manage unprecedented disruptions from Russian sanctions and the war in Ukraine. [Link; soft paywall]
Food Prices
How is the Egyptian government dealing with the global wheat crisis? by Nada Arafat (Mada Masr)
A detailed review of policy steps being taken by the world’s largest wheat importer (heavily dependent on Ukrainian and Russian supply specifically) to secure sufficient grain volumes amidst the loss of supply from the breadbasket of Europe. [Link]
We’re Not Facing a Global Food Crisis by Aaron Smith (UC Davis)
While the loss of wheat and to a lesser degree corn supplies from Russia and Ukraine will be significant, the overall shock is largely priced in at this point and unlikely to cause a significant global shortage. [Link]
High & Low Drama
Inside the Succession Drama at Scholastic, Where Harry Potter and Clifford Hang in the Balance by Joy Press (Vanity Fair)
A real-life version of Succession is pitting the girlfriend of the former CEO for children’s book company Scholastic against his sons. [Link; soft paywall]
California city may declare Chick-fil-A a “public nuisance” by Kate Gibson (CBS News)
Huge lines for the fried chicken purveyor in Santa Barbara are spilling into streets and blocking lanes for hours at a time, leading civic leaders to slap the business with penalties. [Link]
Tech
How the Pandemic Broke Silicon Valley’s Stranglehold on Tech Jobs by Christopher Mims (WSJ)
Remote work is becoming more prevalent, and it’s most concentrated in tech where powerful geographic network effects have historically concentrated talent in a narrow cluster of cities around the country. [Link]
Vimeo is telling creators to suddenly pay thousands of dollars — or leave the platform by Mia Sato (The Verge)
Price hikes have been rolled out on video sharing website Vimeo’s users, many of whom use the site because of its integration with popular subscription platform Patreon. [Link]
Whoops
UPS missed Nantucket ferry reservation window: ‘It’s going to put us in a world of hurt’ by Joshua Rhett Miller (NYP)
An early priority window for booking Nantucket busy season ferry capacity was missed by UPS, leaving the shipping company scrambling to figure out how it will book capacity and businesses on the island wondering how they will ship and receive packages this summer. [Link; auto-playing video]
Everyone Was Surprised By The Senate Passing Permanent Daylight Saving Time. Especially The Senators. by Paul McLeod (BuzzFeed)
Apparently the Senate was too busy deliberating this week to notice that they had accidentally passed legislation that (if passed by the House and signed by the President) would eliminate the bi-annual changing of the clocks. [Link]
Stress
Cold Showers, Hot Saunas and the New Way to Tame Stress by Betsy Morris (WSJ)
Occasional bursts of stress may help the body adapt to more permanent stress, with exercise, temperature changes, and fasting all playing a role. [Link; paywall]
Veto Points
Why America can’t build quickly anymore by Alan Cole (Full Stack Economics)
A proliferation of ways for individuals and groups opposed to development have created huge logjams for major projects, with environmental reviews raising project risks and pushing timelines for construction of everything from transit to wind energy into the years. [Link]
Read Bespoke’s most actionable market research by joining Bespoke Premium today! Get started here.
Have a great weekend!
Bespoke’s Morning Lineup – 3/18/22 – Finishing Up on a Down Note
See what’s driving market performance around the world in today’s Morning Lineup. Bespoke’s Morning Lineup is the best way to start your trading day. Read it now by starting a two-week trial to Bespoke Premium. CLICK HERE to learn more and start your trial.
“Economics is a very difficult subject. I’ve compared it to trying to learn how to repair a car when the engine is running.” – Ben Bernanke
Early weakness in the futures yesterday gave way to the luck of the Irish as the major averages all closed sharply higher bringing the string of 1%+ gains for the S&P 500 up to three. Futures are a bit weaker this morning than they were at this time yesterday, so it may prove more difficult to turn the tide again today. This morning’s call between Biden and Xi at 9 AM could be an important catalyst regarding how the war in Ukraine plays out. China has been more favorable to the Russian side and has ramped up criticism of the US in recent days, with some officials in Washington worried that the country will start providing direct assistance to Russia.
The economic calendar is relatively quiet today with Existing Home Sales and Leading Indicators (both at 10 AM) the only reports on the calendar. St. Louis President James Bullard has already been out this morning saying he advocates a 3% Fed Funds rate by year-end and a more rapid reduction in the balance sheet.
Read today’s Morning Lineup for a recap of all the major market news and events from around the world, including the latest US and international COVID trends.
Movements in the crude oil market have been pretty nuts both recently and over the last two years. For starters, think about this. Over the last two years, crude oil has traded at both its lowest level EVER and within 12% of its highest price ever. 88% of its entire historical range in less than two years!
Over a shorter time window, prices have also been volatile. For just the sixth different period since the early 1980s, WTI crude oil has seen its average daily move exceed 4% over the last 50 trading days. As shown in the chart below, the last 50 trading days join 1986, 1990, 2008, 2016, and 2020 as one of the most volatile two-month periods for the commodity on record.
Not only has crude oil traded erratically, but the equity market’s reaction to moves in the crude oil market have also been hard to decipher. Take the equity market’s reaction to the daily moves on March 1st and yesterday. On both days, WTI rallied more than 8% and broke above $100 in the process. Yet on 3/1, the S&P 500 fell 1.55% in reaction to the move, while yesterday it rallied 1.23%. It just goes to show you that even if you could predict the future, knowing the market’s reaction would be far from a layup.

Start a two-week trial to Bespoke Premium to read today’s full Morning Lineup.
Craziness In Emerging Markets
Volatility in Chinese markets has caused the broader emerging markets ETF, EEM, to move aggressively to both the upside and downside over the last few trading days. Yesterday, EEM gained 8.05%, but the move came after the ETF moved 6.1% lower between last Thursday and Tuesday’s close. All-in-all, the ETF round-tripped to the levels seen on Wednesday of last week, but EEM is still down 8.5% year to date. Since EEM began trading in 2003, the ETF has gained a little over 300%, which constitutes annualized performance of 7.7%.
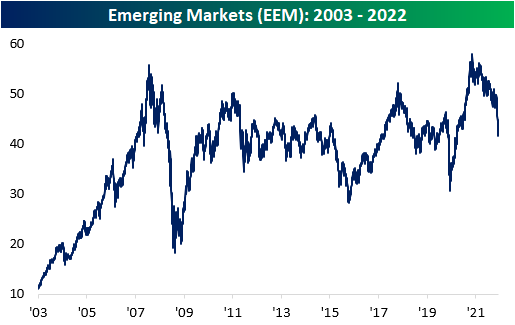
The move yesterday was high relative to historical daily moves, ranking as the 13th largest single-day upside move in its history. Larger moves were seen during the Financial Crisis and the COVID Crash. Obviously, these are not great periods to be compared to, but the occurrences were near the bottom of the pullbacks.

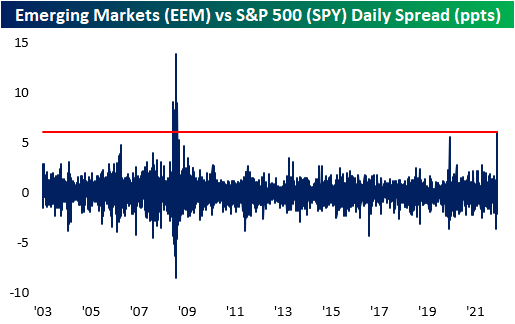
EEM’s daily spread versus the S&P 500 yesterday reached its highest positive level since the Financial Crisis. The last time the daily spread was above that of yesterday was on 11/21/08, in which the daily spread was +9.0%. The last time the spread even came close to this figure was during the COVID crash. Yesterday’s reading was 6.1%.
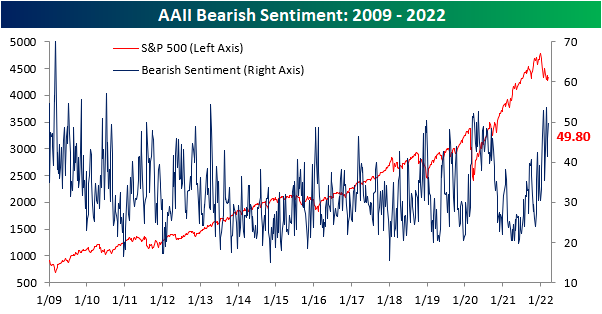
Bears Come Out of Hibernation in Spite of Rebound
In spite of the S&P 500 gaining back some ground in the past week, sentiment has continued to shift in an increasingly pessimistic direction. For a second week in a row, less than a quarter of respondents to the AAII sentiment survey reported a bullish. At 22.5%, however, current levels are still slightly above the low of 19.2% from one month ago.

Bearish sentiment meanwhile climbed another 4 percentage points with just under half of respondents reporting as such. Albeit elevated, bearish sentiment is not as high as the 50%+ readings reached in January and February. As for another reading on bearish sentiment from the Investors Intelligence survey, bearish sentiment is at the highest level since the March 2020 COVID low.
The bull-bear spread is extremely low at -27.3 but that is not quite as low as those past couple of weeks when over half of respondents reported as being bearish.

Not all of the increase to bears came from bulls. As shown below, neutral sentiment fell from 30.2% down to 27.8%. That is only the lowest level since the end of February. While bullish and bearish sentiment are both over a full standard deviation away from their historical averages, neutral sentiment is much more inline with its own historical average. Whereas all weeks since the start of the survey has seen neutral sentiment average a reading of 31.4%, this week’s reading was only a few percentage points away. Click here to view Bespoke’s premium membership options.
