The Bespoke 50 Growth Stocks — 8/11/22
The “Bespoke 50” is a basket of noteworthy growth stocks in the Russell 3,000. To make the list, a stock must have strong earnings growth prospects along with an attractive price chart based on Bespoke’s analysis. The Bespoke 50 is updated weekly on Thursday unless otherwise noted. There were no changes to the list this week.
The Bespoke 50 is available with a Bespoke Premium subscription or a Bespoke Institutional subscription. You can learn more about our subscription offerings at our Membership Options page, or simply start a two-week trial at our sign-up page.

The Bespoke 50 performance chart shown does not represent actual investment results. The Bespoke 50 is updated weekly on Thursday. Performance is based on equally weighting each of the 50 stocks (2% each) and is calculated using each stock’s opening price as of Friday morning each week. Entry prices and exit prices used for stocks that are added or removed from the Bespoke 50 are based on Friday’s opening price. Any potential commissions, brokerage fees, or dividends are not included in the Bespoke 50 performance calculation, but the performance shown is net of a hypothetical annual advisory fee of 0.85%. Performance tracking for the Bespoke 50 and the Russell 3,000 total return index begins on March 5th, 2012 when the Bespoke 50 was first published. Past performance is not a guarantee of future results. The Bespoke 50 is meant to be an idea generator for investors and not a recommendation to buy or sell any specific securities. It is not personalized advice because it in no way takes into account an investor’s individual needs. As always, investors should conduct their own research when buying or selling individual securities. Click here to read our full disclosure on hypothetical performance tracking. Bespoke representatives or wealth management clients may have positions in securities discussed or mentioned in its published content.
Normalizing Sentiment
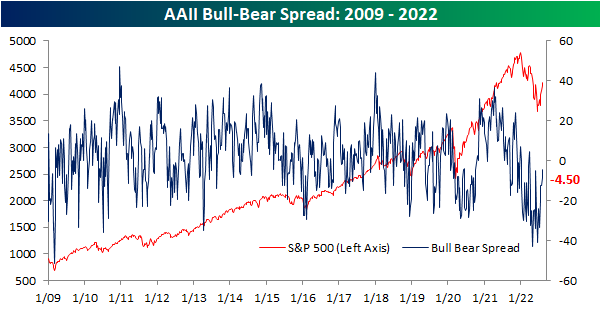
Sentiment has continued to head back towards more normal levels as equities press higher. The latest reading from the AAII on the percentage of investors that are bullish on the S&P 500 over the next six months reached the highest level since March. At 32.2%, bullish sentiment is now only 5.5% below the historical average.

The reading on bearish sentiment meanwhile has dropped to 36.7% which is also the lowest reading since the end of March; the last time this reading was below 30%.

Although both bullish and bearish sentiment are closing in on one another, bears continue to outnumber bulls. The bull-bear spread rose to -4.5 this week extending the streak of negative readings to 19 weeks long. At the moment, that is the third longest streak on record and would need to continue for at least three weeks more to tie the second-longest streak on record of 22 weeks ending in December 1990.
While the bull-bear spread remains negative for the AAII survey, other sentiment surveys have been showing more bullish sentiment. The Investors Intelligence survey has had a positive bull-bear spread for three weeks in a row now, and the NAAIM exposure index has shown investment managers have been quick to add exposure to equities in recent weeks. Standardizing these three survey results (measuring each one in how many standard deviations from the long-term average they are), the NAAIM and Investors Intelligence surveys are now back into positive territory. In other words, these two surveys are actually showing sentiment as having moved slightly above what has been the historical norm. Meanwhile, the AAII reading is far more negative even if it is trending higher.

Additionally, those are the first positive readings in some time. For the NAAIM index, the z-score has not seen a positive reading in 15 weeks. That is the longest stretch without a positive reading since the first quarter of 2016 and prior to that, there have only been a handful of other streaks that have gone on as long. For the Investors Intelligence survey, it was an even rarer streak ending at 29 weeks long. That was the longest since one that went on for roughly a year and ended in May 2009. Prior to that, you would have to go all the way back to 1995 to find a longer streak.
Then there are the AAII results. Still going at 32 weeks long, the z-score has only been negative for as many consecutive weeks once in the survey’s history, and that was during 2020. All of this is to say that the AAII survey has been leaning more pessimistically than other surveys even as overall sentiment has largely made its way back to historically normal levels. Click here to learn more about Bespoke’s premium stock market research service.

Another Week, Another New High In Claims
Prior to revisions, last week’s reading on jobless claims rose back up to 260K which was only 1K below the post-pandemic high from two weeks prior. Although that number was revised lower by 12K this week, the latest week’s reading rose up to 262K. That marks the highest level for initial claims since mid-November and a level that would have been the highest since September 2017 excluding pandemic readings.

This time of the year is usually when initial claims tend to head lower from a seasonal perspective, however, in the current week that has less often been the case. That was also true this year as unadjusted claims rose back above 200K. At 203.6K, claims are above the comparable weeks of 2017 through 2019. Looking forward to next week, it has historically been one of the best weeks of the year for claims. The only year on record in which NSA claims have risen week over week for this specific week of the year was in 2020.

In last Thursday’s Closer, we highlighted just how large of a disconnect there has been between initial and continuing claims as the ratio of the two has surged to levels rarely seen in the history of the data. Continuing claims continue to run at far healthier levels than initial claims with this week’s reading well below the lows of the several decades before the pandemic. That being said, this week did see a modest increase to a new high of 1.428 million; the most elevated reading since the first week of April. Click here to learn more about Bespoke’s premium stock market research service.

Bespoke’s Morning Lineup – 8/11/22 – Inflation Encore
See what’s driving market performance around the world in today’s Morning Lineup. Bespoke’s Morning Lineup is the best way to start your trading day. Read it now by starting a two-week trial to Bespoke Premium. CLICK HERE to learn more and start your trial.
“My fellow Americans, I am pleased to tell you today that I’ve signed legislation that will outlaw Russia forever. We begin bombing in five minutes.” – Ronald Reagan, 8/11/1984

Below is a snippet of content from today’s Morning Lineup for Bespoke Premium members. Start a two-week trial to Bespoke Premium now to access the full report.
Politicians are always getting themselves into trouble with hot mics, and with US Presidents, it has happened more than once with respect to Russia. Besides the Reagan comment above, remember ten years ago when President Obama was caught telling Russian President Medvedev that he would have more ‘flexibility’ after the election? Outside of Russia, President GW Bush was once caught on audio at a rally telling VP Cheney that a certain New York Times reporter was a “major league ___-hole”? And then there’s President Biden. Who can forget the ceremony for the signing of the Affordable Care Act into law when Biden as VP grabbed the President and told him that “This is a big f___-ing deal!”
Politicians live their lives under the camera, so it’s only natural that they get caught making these embarrassing comments from time to time, but in a society where everything is recorded, a parent’s advice that you should never say or do anything that you would be embarrassed for your parents to see or hear is more fitting than ever.
In markets today, futures suggest that yesterday’s rally will have additional legs, but PPI and Initial Jobless Claims will have a say over whether these gains can continue throughout the trading day. PPI was much weaker than expected at both the headline and core level and jobless claims were right about in line with expectations. Treasury yields are lower at the long end of the curve, bitcoin is higher and crude oil prices are back above $90 even as OPEC says it sees the market moving into a surplus at some point this quarter.
Today’s Morning Lineup discusses earnings and market news out of Europe and the Americas, overnight economic data, and much more.
Usually, when the market rallies, the VIX declines, and after yesterday’s rally, the VIX closed below 20 for the first time since April 4th after a run into the low 30s during the worst of the market declines earlier this year. One notable aspect of the sell-off during the first half of 2022 was the fact that the VIX didn’t reach extremely high levels that have been typical of prior sell-offs. Therefore it had less distance to fall in order to get back below 20. You’ll notice in the chart below that during the rally in late Q1, the VIX also managed to briefly close below 20 before bouncing back into the 30s, so it will be important to watch and see whether it can stay around these levels in the future.

The streak of VIX closes above 20 lasted 90 trading days, the longest since the 246 trading day streak that ended in March 2021 coming out of the COVID crash. That was the second longest streak of closes above 20 on record trailing only the 331 trading day streak that ended in December 2009. Before the COVID crash, in order to find another streak of 90 or more closes above 20 in the VIX or even 30 for that matter, you have to go all the way back to 2012.

Start a two-week trial to Bespoke Premium to read today’s full Morning Lineup.
High Short Interest Revival
As we detailed in last night’s Closer, whatever name that it might be given—meme stocks, yolo trades, or “stonks”—there has been a trend recently in which there has been strong performance of highly volatile names loved by the most risk tolerant retail investor. That is roughly a year and a half to the day of the meme stock mania where highly shorted names saw massive short squeezes driven by the retail community.
Since the mid-June lows, highly shorted names have again been outperforming. Below we show the chart of an index covering the 100 most highly shorted stocks going back to early 2020. The vast majority of 2020 gains have been erased, however, this index has also risen 46% since its June 16th low (the same date as the broader market’s low). On a relative basis, the most heavily shorted stocks have been outperforming the Russell 3,000 in that time resulting in the relative strength line to break out of the downtrend that has been in place since the peak of the meme stock mania in late January of last year. That being said, the index itself has much further to go in order to break out of its downtrend off of that high in price.

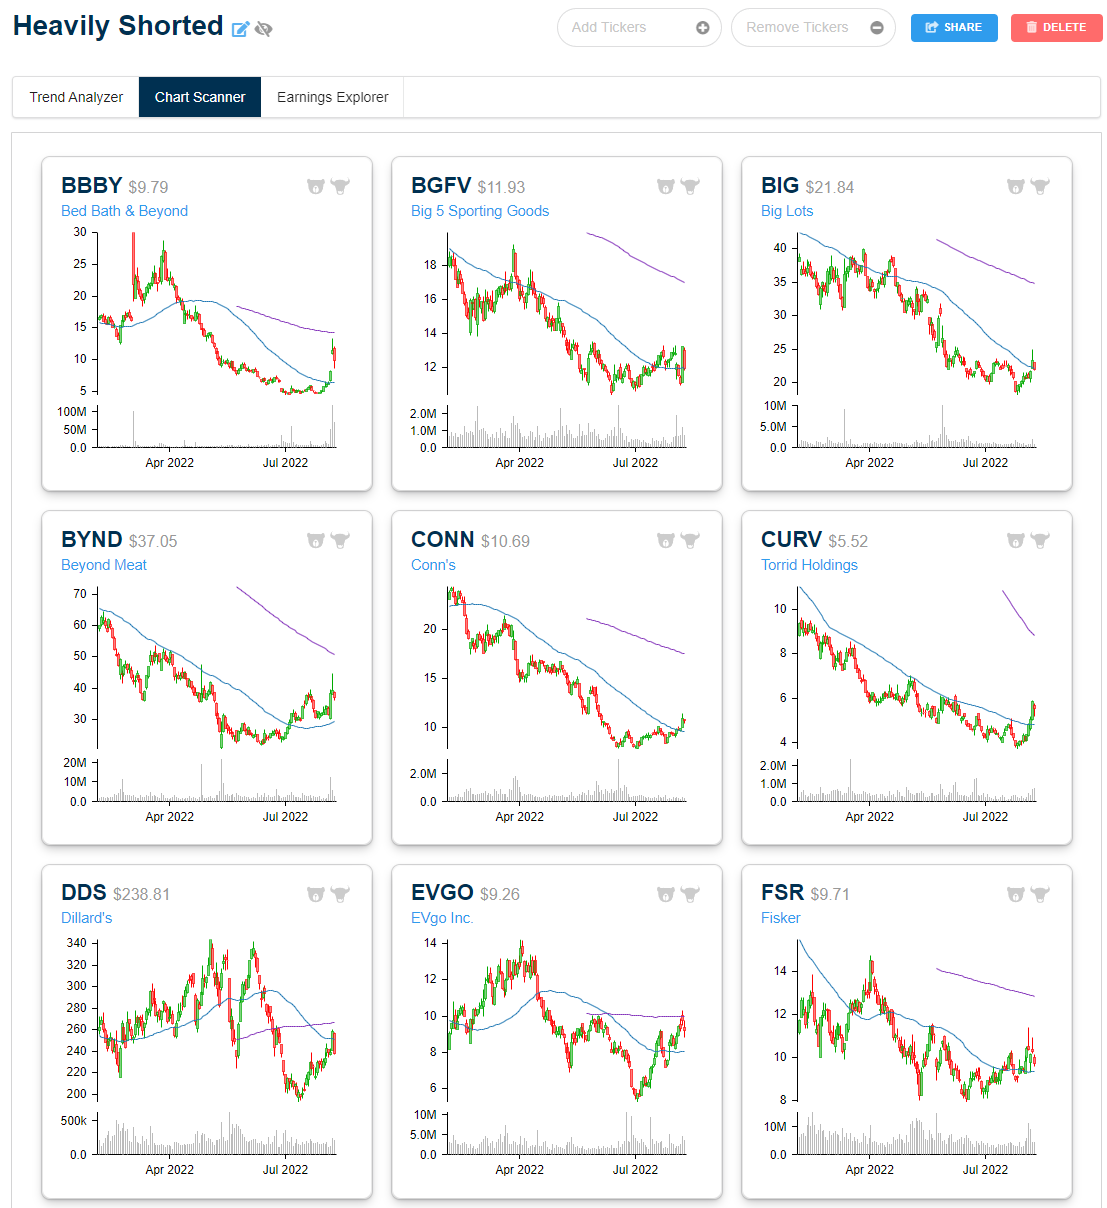
Below we show the stocks within the Russell 3,000 that currently have the highest levels of short interest as of the end of July. The only stock with more than 50% of its float sold short is Torrid Holdings (CURV). The next highest is a company that frequently finds itself high up on the list of highly shorted stocks: Dillard’s (DDS). While those readings are elevated, they are well below what had been the most heavily shorted stock a month and a half ago. As of the mid-June update, Redbox (RDBX) had an extremely elevated reading on short interest that was closing in on 100%. Today that reading has collapsed back down to a still elevated but less extreme 41.5%. We would also note, however, that RDBX is a messy story at the moment in the midst of an acquisition (confirmed to go through in the past 24 hours) with the potential to save the company from bankruptcy.
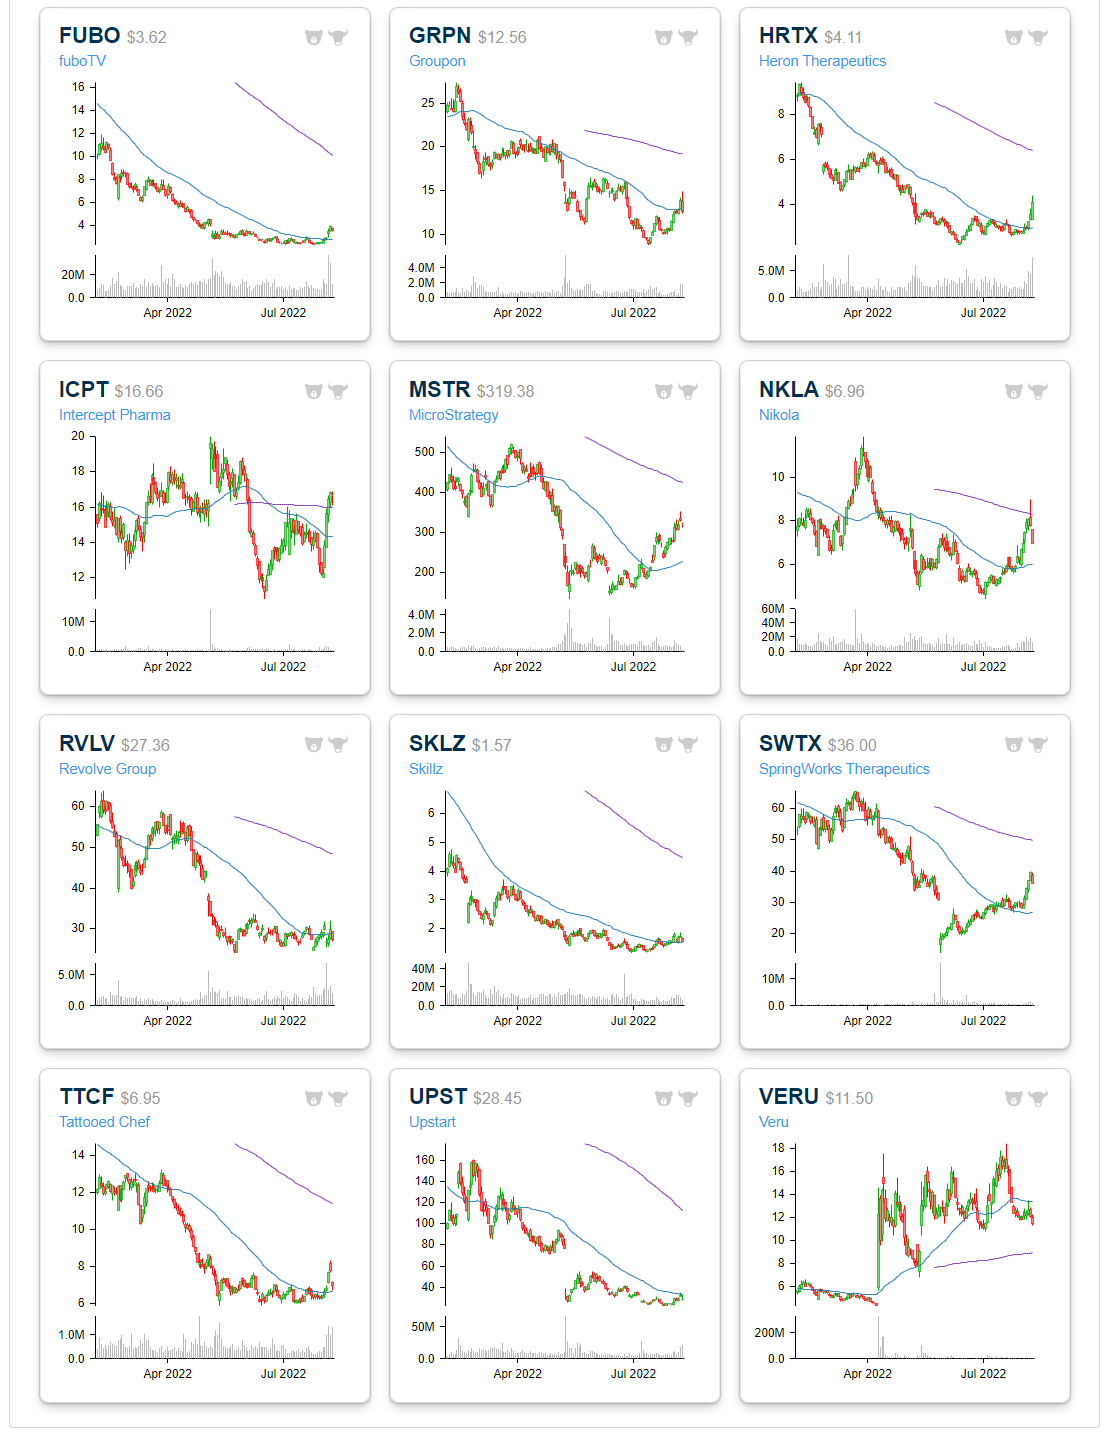
Other notables on the list of most heavily shorted stocks include grill-maker Weber (WEBR), Bed Bath & Beyond (BBBY), Upstart (UPST), Big 5 Sporting Goods (BGFV), Beyond Meat (BYND), Groupon (GRPN), and Nikola (NKLA). Click here to learn more about Bespoke’s premium stock market research service.

Below is a look at price charts for most of the heavily shorted stocks listed in the table above. While many of these names are up huge since mid-June, the gains hardly register on six-month charts because they got hit so hard in the first half of the year. Bespoke subscribers can create Custom Portfolios on our website like the one below to easily monitor baskets of stocks and ETFs. Start a two-week trial to test out the service today!
Bespoke’s Morning Lineup – 8/10/22 – The Day is Here…Whether You Can Afford it or Not
See what’s driving market performance around the world in today’s Morning Lineup. Bespoke’s Morning Lineup is the best way to start your trading day. Read it now by starting a two-week trial to Bespoke Premium. CLICK HERE to learn more and start your trial.
“Having a little inflation is like being a little pregnant.” – Leon Henderson
Below is a snippet of content from today’s Morning Lineup for Bespoke Premium members. Start a two-week trial to Bespoke Premium now to access the full report.
It’s been a quiet morning for markets so far, but enjoy the calm before the storm while it lasts. The release of July CPI comes in the next few minutes (or has already been released depending on when you read this), and in the immediate aftermath of the release at least, markets are likely to experience a surge in volatility. How long that volatility lasts will be directly correlated to how much the headline and core aspects of the report deviate from expectations.
Over in Europe, the major equity benchmarks have seen little movement versus yesterday’s close, and if the releases of CPI for both Germany and Italy are any indication (both reports came in right in line with consensus forecasts), maybe there won’t be too many fireworks today. We can always hope!
Today’s Morning Lineup discusses earnings and market news out of Europe and the Americas, overnight economic data, and much more.
Last month, the June CPI surged 1.3% m/m which was the largest increase in headline CPI since September 2005. With the July report expected to come in at just 0.2%, it would represent the smallest m/m increase since January 2021. If the July headline CPI does match expectations, it would be just the fourth time since 1960 that the rate of increase in the m/m reading dropped by a full percentage point or more. The only other three periods where this occurred were September 1973 (-1.4 ppt), October 2005 (-1.2 ppt), and October 2008 (-1.0 ppt). In two of these three periods, the economy was either right on the cusp of or in a recession while the third period was after Hurricane Katrina when gasoline prices in the US temporarily went bananas.

Wherever the CPI report comes in this morning, one thing we can say is that weaker than expected reports have been hard to come by in the post-COVID world. Last month’s report was the tenth straight month that headline CPI was either higher than or in line with expectations. That is the longest streak of months without a lower-than-expected report since at least 1999. Not only that, but the current streak started just a month after what at the time had been the longest streak just ended. In other words, over the last 20 months, we have seen the two longest streaks without a lower-than-expected CPI report over at least the last 20 years.

Start a two-week trial to Bespoke Premium to read today’s full Morning Lineup.
B.I.G. Tips – Q2 Earnings Triple Plays
Today we published our newest Earnings Triple Plays report. This season we identified 34 earnings triple plays that may be worth taking a closer look at.
What is a triple play? When a stock reports quarterly earnings, it registers a “triple play” when it beats analyst EPS estimates, beats analyst revenue estimates, and raises forward guidance. We coined the term back in the mid-2000s, and you can read more about it at Investopedia.com. We consider triple plays to be the cream of the crop of earnings season, and we’re constantly finding new long-term opportunities from this basket of names each quarter. You can track the newest earnings triple plays on a daily basis at our Triple Plays page if you’re a Bespoke Premium or Bespoke Institutional member. To read our newest report and see the triple plays that we think look the best right now, start a two-week trial to Bespoke Premium!

Inflation Still Top Of Mind for Small Business
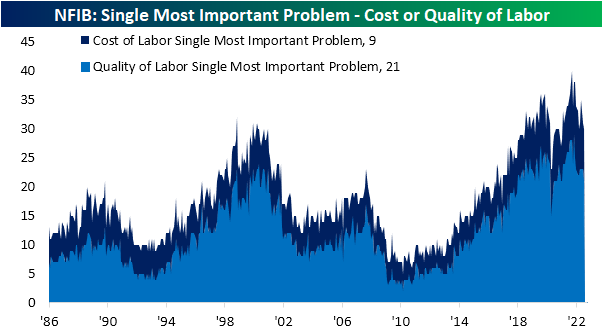
While fewer respondents to this month’s NFIB small business survey reported that they observed higher prices, inflation continues to be a front and center concern. The percentage of respondents reporting inflation as their biggest problem has risen further to another record high of 37%. That completely erased June’s drop down to 34%.

While broad inflation is currently the most pressing problem, other inflation-related measures also rose in July. The percentage of firms reporting cost of labor as their single most important problem rose to 9%, although that is still below the record high reading of 13% at the end of last year.
While we often combine that reading with the percentage of responses reporting quality of labor as the biggest issue as a gauge of labor market health, the latter problem dropped 2 percentage points to net out the rise in cost of labor. On a combined basis, these two concerns are now tied with March at 30% for the lowest level since January 2021 (28%).
One other combined reading that we often check in on is the percentage of respondents reporting government requirements or taxes as their biggest issues. Over the past few decades, Republican administrations have usually coincided with lower readings whereas Democrat administrations would see a higher reading. With inflation concerns surging this year, a historically low share of businesses are concerned about government action. The combined reading fell to another record low of 16% in July with the entirety of that drop on account of a 3 percentage point decline in government requirements and red tape. Click here to learn more about Bespoke’s premium stock market research service.

Little Bounce from the Little Guys
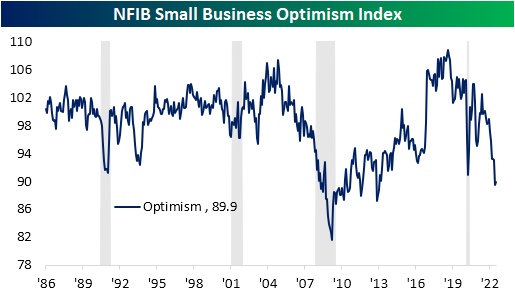
Although the NFIB’s reading on the sentiment of small businesses remains near some of the worst levels of the past decade, this morning’s release did come in both better than expectations and slightly higher than last month. The Optimism Index climbed from 89.5 in June—the lowest level since January 2013—to 89.9. Outside of last month, that would still be worse than any month during the pandemic.
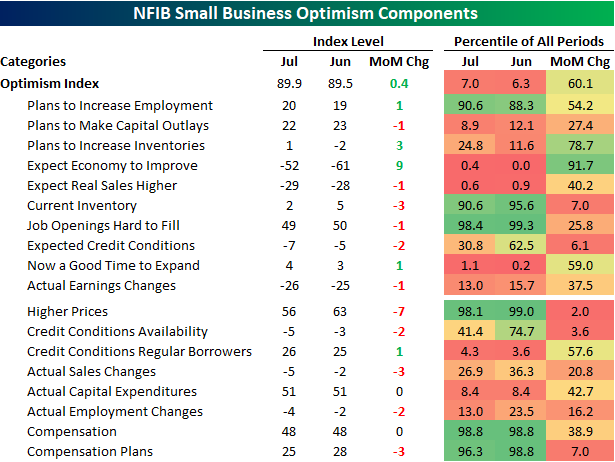
In spite of the modest bounce in the headline number, breadth across the report’s categories remains weak with the number of indices falling month over month twice as large as those that rose. Broadly speaking, employment indices are the main area of strength with Plans to Increase Employment, Job Openings Hard to Fill, Compensation, and Compensation plans each remaining in the upper decile of readings. Current Inventories is similarly at an elevated level relative to its historical range. Conversely, categories like Outlook for General Business Conditions and Sales Expectations are just off historic lows.
Over the past few months, one of the most eye-catching readings of this report has been the reported Outlook for General Business Conditions as it has dropped to record lows far the lowest points seen during prior recessions. This month that index saw some respite, but it remains well outside of the normal range of historical readings.

On reason for the historic drop and this month’s rebound appears to be inflation. As shown below, the two indices have generally been well-correlated to one another over the past couple of years as inflation has soared. That being said, fewer respondents to the monthly survey have been reporting higher prices, and along with that, economic outlooks have improved in tow.

As previously mentioned, one area of the report that has remained fairly strong concerns employment. However, that is not to say those readings have not peaked. Even though they are at historically strong levels and none set any sort of notable new low in the latest data, as discussed in today’s Morning Lineup, each of these indices has been rolling over after peaking late last year. Hiring plans have returned to levels consistent with the pre-pandemic years alongside the percentage of firms reporting cost or quality of labor as their biggest issues. While these too have rolled over, the indices tracking Compensation and Job Openings Hard to Fill have not seen as sharp of pullbacks.

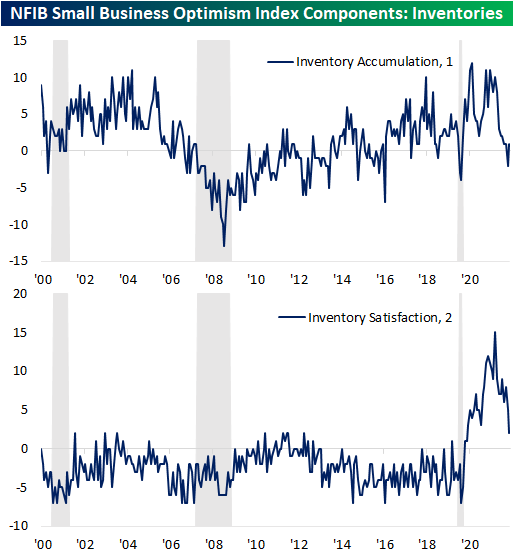
One other interesting area of the report this month concerned inventories. Small businesses reported inventories have begun to build again while there has been a steep drop in the net percentage of responses stating that inventories are too low versus too high. That reaffirms the large negative impact that slowing inventory builds had on the latest negative GDP print. Click here to learn more about Bespoke’s premium stock market research service.
Market Reaction to CPI
Tomorrow, the all-too-important July CPI report comes out. Although the FOMC tends to focus more weight on personal consumption expenditures (PCE) instead of CPI, this release will give investors the first official inflation read of July. Depending on how this report comes in relative to expectations will therefore give a lot of insight into the direction/intensity of policy heading into the last four months of the year. A higher print (especially given the strength in last week’s nonfarm payroll data) would a higher likelihood for continued aggressiveness in rate hikes, while a weaker than expected print could cause markets to price in a more benign path moving forward. As of today, analysts expect headline CPI to increase 8.7% y/y, which would be a 0.4% decline from June’s rate.
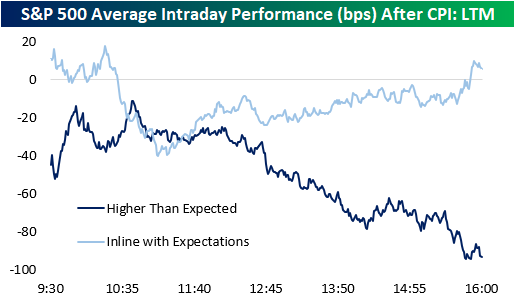
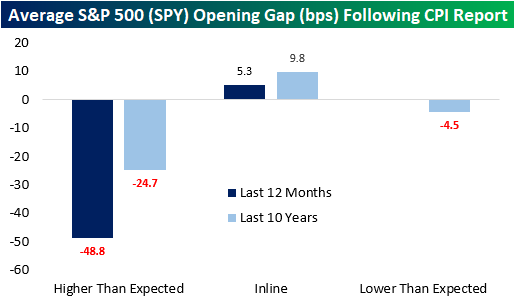
Last month, analysts expected CPI to rise 8.8% YoY, but the print came in at 9.1%. Over the last twelve months, CPI has come in hotter than expected two-thirds of the time. Notably, CPI has not come in below expectations over the last twelve months but did match expectations one-third of the time. In terms of market expectations, over the last twelve months, the S&P 500 has averaged an opening gap of -49 basis points following a CPI print that was hotter than expected. That’s about twice the average gap lower of 25 bps following all higher-than-expected prints over the last ten years. The market tends to gap higher following an inline print, averaging a gain of 5.3 bps over the last twelve months and 9.8 bps over the last ten years. Click here to learn more about Bespoke’s premium stock market research service.
Following all CPI prints over the last twelve months, the S&P 500 has tended to gap lower but move close to the break-even level in the first half hour of trading. Following this initial bounce, the S&P 00 has tended to bounce around but remain in negative territory. The second half of the trading day has been much weaker, though, finishing the day down 60 basis points on the day.

Over the last twelve months, intraday performance has diverged based on the result of the report. When CPI matches expectations (three occurrences), the S&P 500 gaps higher but has surrendered those gains by about 10:30. However, following a bottom at about 11:00, stocks tend to pick up steam throughout the rest of the trading day. When CPI comes in hotter than expected, we see nearly the exact opposite. The S&P 500 gaps lower, but generally moves higher until about 10:45, when things take a turn weaker. The back half of the trading day has been notably weaker with stocks closing right near their lows of the day, booking an average decline of 93 basis points. Click here to learn more about Bespoke’s premium stock market research service.