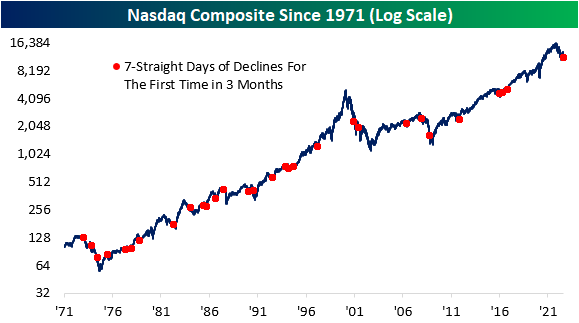
Nasdaq Declines For 7th Straight Day
Following Tuesday’s drop, the Nasdaq Composite has closed lower for seven consecutive days, a streak that has not occurred since November 2016. During this stretch, the index has declined roughly 9%, which is the largest decline over seven trading days for the index since mid-June of 2022. Even during the COVID crash and the continued sell-off during the first half of this year, the Nasdaq never declined for seven straight days. As apparent from the chart below, the frequency of these occurrences has declined substantially since the first 20 years of the index’s history. Click here to learn more about Bespoke’s premium stock market research service.
As shown in the table below, the median performance following these occurrences does not differ greatly from all periods. Average performance is lower over the following month, three months, and six months, but the positivity rate six months out is identical to that of all periods. The median performance does not differ too greatly compared to all periods across each time frame we looked at. Although investors are likely feeling the pain of this sell-off, there is no evidence suggesting that the forward performance will diverge from the norm.

The chart below provides an alternative way to visualize the consistency of positive returns following seven straight declines for the Nasdaq. Apart from three months forward, the positivity rate for the index was within three percentage points of the norm for every time period we looked at.

S&P 500 and Energy Correlation Reverses
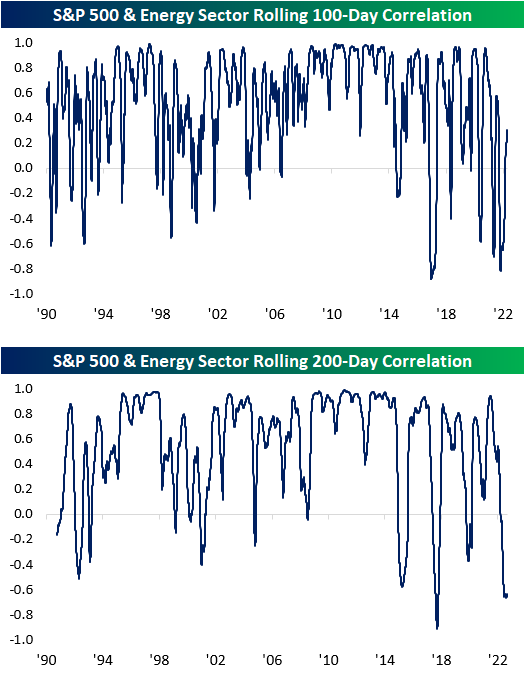
Early in 2022, extremely high oil and gas prices provided a headwind to the broader economy and significantly contributed to inflation, forcing the Fed to embark on its current aggressive policy of rate hikes. Rising energy prices and higher interest rates led to a divergence in the performance of the Energy sector, which rallied on higher energy prices, and the S&P 500, which came under pressure due to higher rates. As a result, on both a 100 and 200-trading day basis, the correlation coefficients between each index’s closing prices hit the second most negative levels since 1990.
Since 7/15, though, the extreme negative correlation between the Energy sector and the S&P 500 has started to reverse, In fact, the 100-day correlation has even just recently moved back to positive levels, meaning that the S&P 500 and the Energy sector have begun moving more in the same than opposite directions. Although the 200-day correlation coefficient is still near extremely inverse levels, it too has stopped going down and is starting to move towards a more positive relationship. Click here to learn more about Bespoke’s premium stock market research service.
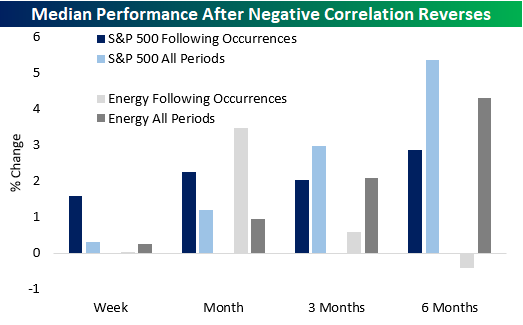
As mentioned above, on 7/15, the 100-Day correlation turned positive while the 200-day remained negative, which has only occurred seven other times since 1990 (with no other occurrences in the prior three months). The table below summarizes the performance of both the S&P 500 and the Energy sector following these occurrences. As you can see, with regard to the S&P 500, there is no clear trend in performance going forward as returns have generally been in line with the historical average for all other periods. As for the Energy sector, performance six months out was quite weak, as the sector was positive less than half of the time with a median decline of 0.4%. The last 25 years have been especially weak as the sector was lower six months later four times in a row. Click here to learn more about Bespoke’s premium stock market research service.

The chart below provides a visualization of the collective returns following each of the occurrences in the table above. When it comes to the S&P 500, its median return was better than ‘normal’; over the following week and month but weaker over the following three and six months. Similarly, the Energy sector also posited weaker than normal returns over the following three and six months.
Dollar Index Inflating
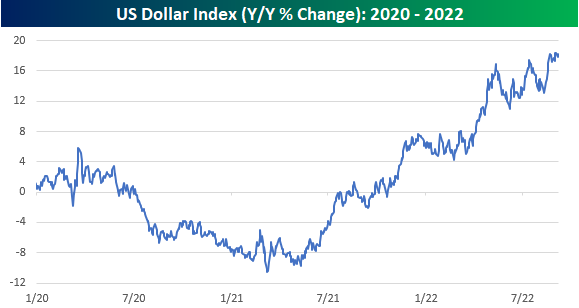
It’s a bit ironic that just as inflation is raging at the highest levels in decades, the value of the US dollar (at least relative to other currencies) has been surging. Imagine where we’d be if the dollar was falling in value. Just last week, the y/y change in the US Dollar Index topped 18.4% which is a rate of change not seen since the summer of 2015 when China was devaluing the yuan. Throughout the history of the US Dollar Index, there have only been a handful of other times that it has rallied this much over a year. Even rarer have been times when the y/y change exceeded 20%. Click here to learn more about Bespoke’s premium stock market research service.

The dollar has already seen a big gain, but could this rally match the rarified air of prior 20%+ y/y rallies? Anything is possible, but to get there, it’s going to have to do some heavy lifting. Just looking at a chart of the y/y change since the start of 2020, the momentum of the rally, while still trending higher, has slowed to more of a rangebound area than the blistering momentum experienced in late 2021 and early 2022.
A price chart of the Dollar Index illustrates why. For much of 2022, the comps for the y/y change have been relatively easy as the dollar sold off from its initial COVID surge and traded down to its lowest levels since 2018 and before that levels not seen since 2015. The Dollar Index then made a double-bottom last summer and started to rally in the fall. Therefore, now that the rally is starting to ‘lap’ its early stages, the comps are increasingly tougher. From 9/6/21 to 10/6/21, the US Dollar Index rallied 2.4%, which means that just for the y/y change to remain at current levels, it would need to rally at least that much and then more on top of that to push the gain up to 20%.

Bespoke’s Morning Lineup – 9/6/22 – Positive Futures…For Now
See what’s driving market performance around the world in today’s Morning Lineup. Bespoke’s Morning Lineup is the best way to start your trading day. Read it now by starting a two-week trial to Bespoke Premium. CLICK HERE to learn more and start your trial.
“There are things done today in electrical science which would have been deemed unholy by the very man who discovered electricity” – Bram Stoker

Below is a snippet of content from today’s Morning Lineup for Bespoke Premium members. Start a two-week trial to Bespoke Premium now to access the full report.
Maybe we needed the weekend to pause and regroup. At least that’s the hope for the bulls. Futures are higher this morning after a news-packed Labor Day which saw volatility in Europe following news that Russia would cut off natural gas supplies to that region of the world until sanctions were lifted. Also, yesterday, OPEC+ announced that it would cut supplies by 100,000 barrels per day reversing the token increase from September after President Biden visited Saudi Arabia in the Summer.
Despite the positive pre-market tone, concerns still loom as the economy remains on a shaky footing and traders have become all to used to the market trading higher and giving up those gains throughout the trading day. The upcoming weeks are busy with investor conferences so be on the lookout for any negative commentary emanating from those get-togethers. In terms of economic data, the only report on the calendar today is the ISM Services for August. Economists are forecasting the headline index to slow modestly from 56.7 in July to a still expansionary reading of 55.0.
It’s hard to believe after the last week few weeks of selling that the S&P 500 still isn’t even at oversold levels. As shown in the graphic from page two of the Morning Lineup, just three sectors – Consumer Staples, Health Care, and Communication Services – are currently oversold while Energy is the lone sector at overbought levels. While the S&P 500 isn’t oversold, it did close out last week below its 50-day moving average (DMA) along with every other sector except Energy and Utilities.

Our Morning Lineup keeps readers on top of earnings data, economic news, global headlines, and market internals. We’re biased (of course!), but we think it’s the best and most helpful pre-market report in existence!
Start a two-week trial to Bespoke Premium to read today’s full Morning Lineup.
Labor Day Holiday Hangover
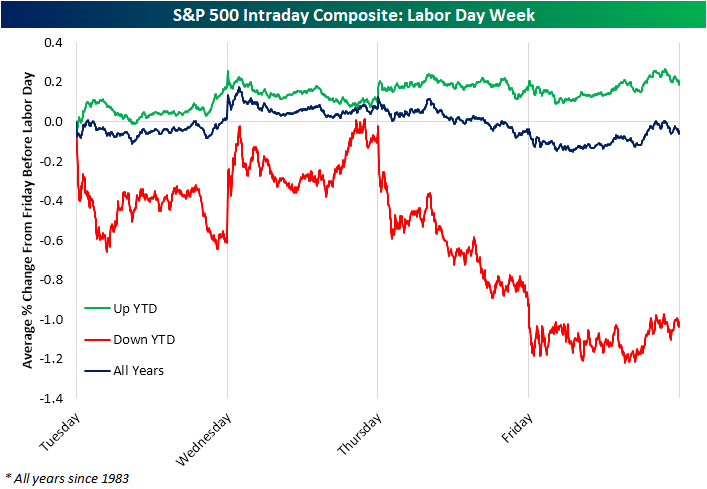
It’s the unofficial end of summer with Labor Day now here. While that may mean summer vacation for many traders is over, historically, the holiday-shortened week has averaged uninspired performance. Over the course of the entire week (from the close of the Friday before the holiday to the close of the following Friday), the S&P 500 averaged a modest decline of 0.13% with positive performance only half the time during the post-WWII period. However, breaking down the years by whether or not the S&P 500 was higher or lower on a year to date basis shows a more nuanced story.
Years in which the index was up year to date heading into the holiday have tended to see modest further gains that week. Tuesday has typically been the best day of the week with a 15 bps move higher. On the other hand, years when the S&P 500 was lower YTD have been far worse. The Tuesday after Labor Day has nearly averaged a full 1% decline with positive performance just 40% of the time. That average is somewhat skewed by a 9.9% drop the lady after Labor Day in 1946, but even still, the median decline has been 0.50%. Thursday and Friday have similarly averaged declines albeit much smaller in size.

Looking at the intraday pattern going back to the start of our data in 1983, the bulk of the decline came from midweek on. As shown in the intraday composite below, the S&P 500 has on average almost turned positive by Wednesday’s close, but on Thursday and Friday it has tended to face heavy selling pressures. The series for the years when the S&P 500 was down YTD looks a lot more extreme than the one for years when it was up YTD, but that’s because of the relatively small sample size (just eight years since 1983). In those eight years, though, the S&P 500 was only up the day after Labor Day twice (1990 and 2015). Buckle up! Click here to learn more about Bespoke’s premium stock market research service.
Bespoke Brunch Reads: 9/4/22
Welcome to Bespoke Brunch Reads — a linkfest of the favorite things we read over the past week. The links are mostly market related, but there are some other interesting subjects covered as well. We hope you enjoy the food for thought as a supplement to the research we provide you during the week.
While you’re here, join Bespoke Premium with a 30-day free trial!
Commodities
Gazprom calls complete stop on gas deliveries to France’s Engie by Sarah White and David Sheppard (FT)
A dispute over payments is being blamed for halted deliveries from Russia’s Gazprom to France’s Engie, part of a broader decline in gas supplies from Russia to the rest of Europe. [Link; paywall]
Wheat Harvest Rebounds in Canada to Bolster Shaky World Supplies by Jen Skerritt (Bloomberg)
Canada’s wheat crop is up an eye-popping 55% this year to the third-largest on record as wetter soil and moderate temperatures fuel yield gains badly needed in a world missing Ukrainian and Russian supplies. [Link; soft paywall]
Pandemic Effects
‘Largest score decline’ in reading for nation’s 9-year-olds, first-ever drop in math by Kayla Jimenez (USA Today)
As was widely expected, remote learning during the pandemic carried a cost for students that saw their reading and math scores drop from 2020 to 2022. [Link; auto-playing video]
U.S. life expectancy drops again, marking worst 2-year decline in a century by Alexander Tin (CBS)
More than a million deaths have cut short life expectancy in the US, which is calculated based on current demographics, for two consecutive years. [Link; auto-playing video]
Americans have ‘tip fatigue’ — post-pandemic, diners are less inclined to tip generously for takeout by Jessica Dickler (CNBC)
Tips proliferated during the pandemic, with all manner of service jobs getting a bump from their customers. But as society goes back to normal, fewer people are willing to shell out a dollar-denominated thank you. [Link]
Decarbonization
Nuclear Power’s Rebound Causes Rift Among Environmentalists by Paul Vieira (WSJ)
Younger environmentalists are tightly focused on reducing carbon emissions as fast as possible, while older green activists have spent decades opposing radiation-fueled electricity at nuclear plants. [Link; paywall]
California’s Lithium Rush For EV Batteries Hinges On Taming Toxic, Volcanic Brine by Alan Ohnsman (Forbes)
One of the largest reserves of lithium in the world is found in California, enough to power tens of millions of EVs. But getting the lithium out of a toxic brine is not an easy task and has never been attempted at scale. [Link; soft paywall]
Honda, LG Energy Plan $4.4 Billion EV Battery Factory in U.S. by River Davis and Dasl Yoon (WSJ)
As part of its effort to scale up EVs with a full EV lineup targeted by 2040, Honda and its supply chain partner are plough billions into an Ohio factory that will produce cells as soon as 2025. [Link; paywall]
SCOTUS
Positive Views of Supreme Court Decline Sharply Following Abortion Ruling (Pew)
For the first time on record, more Americans have an unfavorable view of the Supreme Court than a favorable one. Favorability is currently highly partisan but fell sharply in recent years on both sides of the aisle. [Link]
Tech
The metaverse is as dead as Zuckerberg’s cartoon eyes by Jesus Diaz (Fast Company)
Facebook has ploughed more than $10bn into the Metaverse and so far the only thing to show for it is a very creepy looking knock-up of CEO Mark Zuckerberg, just the latest in a seemingly never-ending series of gaffs related to the company’s pivot. [Link]
Panera Bread tests artificial intelligence technology in drive-thru lanes by Amelia Lucas (CNBC)
Fast food restaurants are trying to automate order-taking with artificial intelligence systems as two upstate New York Panera Bread locations are the latest in the effort to cut down labor costs. [Link]
Weird News
How ‘the Most Vicious, Horrible Animal Alive’ Became a YouTube Star by Oliver Whang (NYT)
If you’re looking for a way to get rid of a pesky muskrat, the Mink Man might be your answer. Rats, raccoons, beavers, and groundhogs are also easy prey for the “untamable, untrainable” mink. [Link; soft paywall]
Marijuana use is outpacing cigarette use for the first time on record by Ayana Archie (NPR)
Gallup data suggests that only 11% of Americans smoke cigarettes, a record low, while 16% report smoking marijuana, a huge reversal from the middle of the 20th century when almost half of adults smoked and less than 5% reported smoking weed. [Link]
Real Estate
Chinese borrowers pile pressure on banks with early mortgage payments by Cheng Leng (FT)
The perverse structure of China’s real estate markets is leading to deleveraging amidst stress as residential property owners prepay mortgages as a way to deleverage under stress. [Link; paywall]
Apartment List National Rent Report (Apartment List)
Asking rent growth are slowing sharply, with less than 80% of cities seeing rental growth in the month. Year-to-date asking rents are up 7.2%, but those numbers have slowed quite dramatically. [Link]
Wealth Distribution
The Bottom 50% of Americans Are Building Wealth Even as Inflation Bites by Paulina Cachero (Bloomberg)
The bottom half of the US wealth distribution is seeing their net worth outperform the top of the distribution despite inflation and stress from the turbulent post-COVID economic backdrop. [Link]
Collectibles
Mickey Mantle card breaks record, as sports memorabilia soar by Bobby Caina Calvan (AP News)
A mint condition Mantle card set a new record for sports trinkets, selling for more than $12mm last weekend as the sports collectibles boom continues. [Link]
Scarcity
Water companies are considering system to turn sewage into drinking water to avert shortages by Thomas Kingsley (Independent)
Sewage and other wastewater can be repurposed for drinking water rather than being cleaned and released into rivers and other water systems. [Link; auto-playing video, registration required]
Read Bespoke’s most actionable market research by joining Bespoke Premium today! Get started here.
Have a great weekend!
2022: Not the Year for Optimism
As we noted in a post on Thursday, the latest data from the weekly AAII survey showed bearish sentiment cross back above 50% while bullish sentiment is back below 25%. With further pessimistic readings, this year is on pace to be one of the worst years on record for investor sentiment as measured by that survey. Below we show the average reading for bullish and bearish sentiment by year as well as how many weeks during each year those readings were below 25% and above 50%, respectively. In a nutshell, 2022 has been a year popular with the bears.
With bullish sentiment having averaged a reading of only 24.22% in 2022, it is below the previous runner-up and record low of 27.29% and 27.08% in 1988 and 1990. That low average is thanks to twenty weeks so far this year where bullish sentiment has been below 25%. With four months to go in the year, this year would only need to see one more month with such a reading in order for 2022 to become the year that most often saw less than a quarter of respondents report as bullish.
Conversely for bearish sentiment, 2022 has averaged a reading of 45.87%, slightly above the previous record of 45.2% from 2008. Slightly different from bullish sentiment, however, by the end of the year there will need to be almost two more months of bearish sentiment readings above 50% to take out the 2008 record. Currently, this year is closing in on 1990 when there were 13 weeks in which over half of respondents reported pessimistic sentiment. Click here to learn more about Bespoke’s premium stock market research service.

The Bespoke Report – 9/2/22 – Chair Powell, If You’re Out There, Read This
This week’s Bespoke Report newsletter is now available for members.
Labor Day marks the unofficial end of summer and the beginning of a new school year. Right now, there are thousands of 18-year-olds starting their first year of college around the country, and many of them have been dropped off in an environment they’ve never experienced. As they try to figure it all out, they’re going to make a lot of mistakes along the way. Everybody does.
Heading into the last four months of 2022, the Fed and everybody else are like first-year college students. We’ve never experienced anything like the current backdrop before. While we want to think that Jay from New York down the hall, Esther from Kansas City, or Jim from St. Louis somehow have all the answers, they, like everybody else, have no clue either. It’s not just the Fed. Everybody has been wrong more often than they’ve been right since COVID.
After having just told you how everyone has been wrong on everything for the last two years, you may be thinking to yourself, what do they know that everyone else doesn’t? We don’t have a crystal ball either. Our approach now is the same as it always has been and that’s to listen to what the market is saying, and in this week’s Bespoke Report, we cover all of the week’s major market events and how they may impact the market. To read this week’s full Bespoke Report newsletter and access everything else Bespoke’s research platform has to offer, start a two-week trial to one of our three membership levels.


August Firearm Background Checks
Although not a widely-utilized indicator, we like to look at the number of firearm background checks conducted by the NICS every month to gauge geopolitical uncertainty and volatility within the US. In uncertain times, firearm background checks tend to increase, as individuals increasingly acquire the means to protect themselves in a worst-case scenario. On the contrary, when times are ‘good’, background checks tend to decline. An additional factor that impacts background checks is the outlook on firearms legislation. When the populous fears that they may not be able to purchase certain firearms in the future, they will step up purchases in the short term to ‘stock up’.
At the end of June, the Supreme Court issued a ruling that expanded gun rights, prohibiting certain restrictions on carrying. This may have contributed to the rise in background checks this month, but there are other factors that likely contributed as well. Democrats are now expected to retain control of the Senate according to betting markets, and the Biden administration has proven their ability to enact legislation, so Americans may be worried about further gun control legislation. Additionally, the FBI’s raid of former President Trump’s Mar a Lago home could have added to the perception of domestic political instability. Click here to learn more about Bespoke’s premium stock market research service.
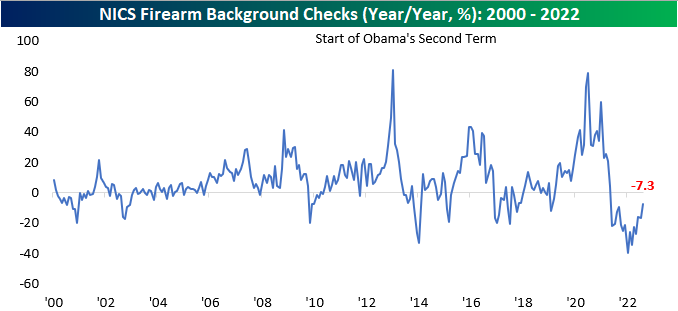
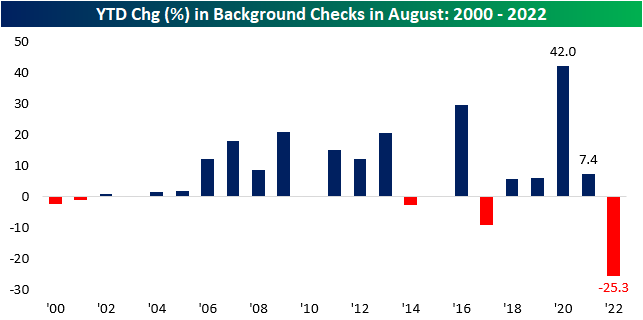
Although background checks rose by 4.7% month over month, they are still down 7.3% y/y. This is largely due to tough comps, as heightened geopolitical uncertainty and volatility in 2020 and 2021 led to extreme increases in background checks. We are now essentially out of the COVID-era, the Russia-Ukraine conflict is no longer top of mind for Americans, and the questioning of 2020 election results appears to be a thing of the past, and a more relaxed state of affairs has led to declines throughout 2022. However, the rate of decline has been leveling out. Through August, the number of background checks on a YTD basis has declined by 25.3%, but the y/y decline of just 7.3% for the month tells us that we have likely already experienced the largest declines in background checks on a percentage basis. It would not be unreasonable to expect checks to rise as we head into midterm elections.
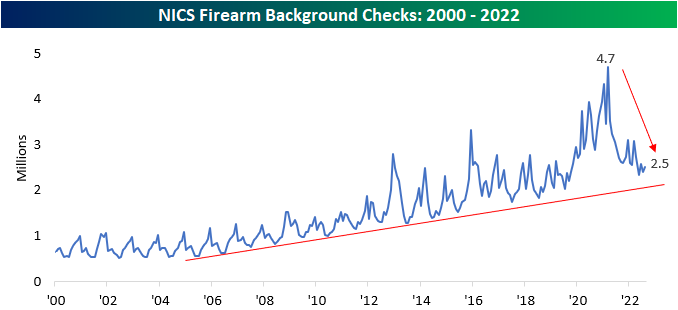
Background checks are still in a longer-term uptrend. At 2.5 million, August’s figure ranks in the top 15.1% of all months since NICS began reporting this data in 1998, and outside of late 2019 through 2021, there were only a few months that the number of checks was higher. Still, they are down 46.3% from the all-time highs seen in March 2021. This may be because demand was pulled forward, but it could also be due to a more normalized domestic situation. Click here to learn more about Bespoke’s premium stock market research service.
Sturm Ruger (RGR) and Smith & Wesson (SWBI) are the two publicly traded stocks with direct exposure to these trends. Historically speaking, the monthly performance of these stocks tends to be correlated to the trailing twelve-month volume of background checks. Although background checks rose month over month, the near-term downtrend persists in checks, which is following through to the performance of these two stocks. Over the last month, RGR and SWBI are down 20.7% and 4.8%, respectively. Click here to learn more about Bespoke’s premium stock market research service.

Bespoke’s Morning Lineup – 9/2/22 – Jobs Day to Labor Day
See what’s driving market performance around the world in today’s Morning Lineup. Bespoke’s Morning Lineup is the best way to start your trading day. Read it now by starting a two-week trial to Bespoke Premium. CLICK HERE to learn more and start your trial.
“I’m just opposed to a pure inflation-only mandate in which the only thing a central bank cares about is inflation and not employment.” – Janet Yellen
Below is a snippet of content from today’s Morning Lineup for Bespoke Premium members. Start a two-week trial to Bespoke Premium now to access the full report.
It’s understandable that the Friday before Labor Day is quiet as people look to get the most out of the last unofficial summer weekend, but the ‘flatness’ in futures is pretty remarkable given the volatility this week. The fact that it’s an employment report Friday makes the tranquility even more notable. Tune in at 4 PM to see if it lasts the entire day. Heading into this Friday’s report, the Non-Farm Payrolls report has been stronger than expected for four straight months, and the only other time in the last 25 years that it had a longer streak of beating expectations was in September 2020 when the August report topped estimates for a fifth straight month.
Outside of equities, energy is mixed with crude oil trading about 2% higher while nat gas is down over 3% and below $9/mmbtu. Treasury yields are modestly lower, but the 10-year yield is still at 3.25%.
The equity market had a pretty impressive reversal yesterday helping the S&P 500 to avoid a five-day losing streak following Fed Chair Powell’s hawkish speech in Jackson Hole last Friday. The rebound wasn’t enough to push the Nasdaq into positive territory for the day, although it did finish well off the intraday lows. Semis also managed to bounce, but the Philadelphia Semiconductor Index (SOX) still finished down over 1% on the day. Not only was it the 5th straight day of losses for the SOX, but it was also the 5th straight decline of 1% or more, a streak in which it has dropped more than 11%.
The current losing streak for the SOX ranks as the longest run of 1%+ daily declines since January 2016 and just the 12th such streak in the index’s history. Of those prior eleven, just three went on to last a sixth day and none extended to seven. Just as we noted in a post yesterday how the magnitude of the decline in reaction to Powell’s Jackson Hole speech ranked on the extreme side relative to history, losing streaks like the one the SOX is in (or hopefully on the tail end of) right now have been uncommon over time.

Our Morning Lineup keeps readers on top of earnings data, economic news, global headlines, and market internals. We’re biased (of course!), but we think it’s the best and most helpful pre-market report in existence!
Start a two-week trial to Bespoke Premium to read today’s full Morning Lineup.