Leisure & Entertainment ETF (PEJ) and AMC Networks (AMCX) Caught In Meme Madness
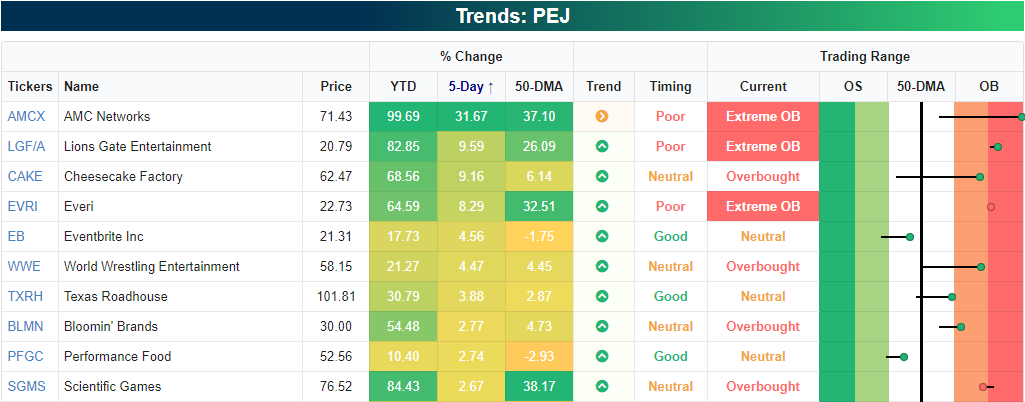
Glancing through the US Groups ETF screen of our Trend Analyzer, by far the best performer over the past week has been the Dynamic Leisure and Entertainment ETF (PEJ). The portfolio is largely comprised of reopening stocks like restaurants, travel companies, and various forms of entertainment both live and otherwise. PEJ has rallied 11.77% in the five trading days ending yesterday in a move that has moved it deeply into overbought levels as it sits 16.71% above its 50-DMA. As the next best-performing ETFs in this screen, oil-related names like the S&P Oil and Gas Equipment and Services ETF (XES) and Oil Services ETF (OIH) have both risen well over 7% and are even more extended above their moving averages in percentage terms. As for the other ETFs, the S&P Biotech ETF (XBI) is another top performer and is the only one that is not overbought at the moment. Granted, it has retaken its 50-DMA in the past week, and its longer-term trend is worse than the rest of the screen.

Pivoting back to the Dynamic Leisure & Entertainment Portfolio ETF (PEJ), the double-digit move in the past week is actually part of a longer near-vertical move that began in mid-May. Since the May 12th low, PEJ has rallied 28.72% through today moving it to within 2% of its 52-week high from back on March 15th. Additionally, looking just at the nearly 12% rally of the past week, a massive portion of the move came last Wednesday when it rose over 10% in a single session. In fact, last Wednesday was so volatile that even after a few days of higher closes, it is still below last Wednesday’s intraday high.

It is hard to mention parabolic moves these days without some mention of a meme stock, and of course, the massive move for PEJ is meme-related. Below we show the ten best-performing holdings of PEJ over the past week. Topping the list is AMC Networks (AMCX) with a 31.67% gain in the past week alone. After that move, AMCX is just shy of doubling year to date. While sharing a similar name, AMCX is not to be confused (although the meme traders seem to be doing just that) for AMC Entertainment (AMC) which has taken center stage with regards to meme stocks lately. In other words, the AMCX has gotten caught up in the meme stock mania alongside AMC. While AMCX is up big, the chart is extremely extended above its 50-DMA, and at the moment is setting up in what appears to be a head and shoulders pattern. From a technical perspective, that is viewed as a bearish pattern, and for that pattern to be confirmed, it would have to fall below the past several months’ support at around $44 after failing to move above the January and more importantly mid-March highs.
While it has no doubt had an impact, the move in PEJ has not solely been due to the strength of AMCX. The stock only ranks as the tenth-largest holding accounting for 3.26% of the portfolio. There have also been a handful of other strong performers pulling weight like Lions Gate Entertainment (LFG/A) and Cheesecake Factory (CAKE) which both have risen over 9%. Everi (EVRI) has also risen considerably, notching an 8.29% five-day gain. Click here to view Bespoke’s premium membership options for our best research available.

Bespoke’s Morning Lineup – 6/9/21 – It’s Post Time!
See what’s driving market performance around the world in today’s Morning Lineup. Bespoke’s Morning Lineup is the best way to start your trading day. Read it now by starting a two-week free trial to Bespoke Premium. CLICK HERE to learn more and start your free trial.
“The reason that you can win at poker and horse racing is the same – you are not betting against the house; you are betting against the other players.” – Steven Crist
Forty-eight years ago today, spectators in the hot, humid long island sun witnessed one of the greatest performances in the history of horse racing, and in the winner’s circle, there was Secretariat, winner of the coveted Triple Crown for the first time in a quarter-century after completing one of the greatest runs in horse-racing history. The horse ran the fastest Kentucky Derby ever, a record that still stands today, easily won the Preakness (unofficially in record time), so it was only fitting that the win at Belmont came in at a record of 31 lengths and likely barely breaking a sweat.
Like poker and horse racing, when it comes to investing, rather than betting against the house, which always wins, you are betting against the crowd. That means that the more informed you are as an investor, the better your chances of success. Just as a bettor who wagers based on the name of the horse or the color of their silks usually leaves lighter in the wallet than when they arrived, an investor chasing the hottest stocks or most popular trends usually, even during one of the greatest runs in market history usually ends worse off than the person on the other side of the trade.
US equity futures are right around the flatline this morning, and the overnight session was a snoozer as futures have traded in a range of less than 0.25%. Crypto assets have seen a bounce after yesterday’s plunge, and commodities are mixed.
Read today’s Morning Lineup for a recap of all the major market news and events including an update on infrastructure talks, the latest economic data from Asia and Europe, and the latest US and international COVID trends including our vaccination trackers, and much more.

Yesterday, investors who still read a physical newspaper were greeted with some interesting headlines related to inflation. Right below the fold on the front page of the Wall Street Journal, they saw “Commodity Prices Skyrocket, Adding to Inflation Fears”. Then on the front page of the Markets section (B1) right at the top was the headline “Traders Bet on Return of $100 Oil”. With headlines like that and a CPI report coming up on Thursday, weakness in the Treasury market would be a safe assumption. Not so fast. While the yield on the 10-year US Treasury was an already low 1.57% when yesterday’s Journal came off the presses, ever since then, it has done nothing but go down. In fact, as of this morning, the yield dropped below 1.5% and on pace for the lowest closing yield in over three months.

Inflation Issues For Small Businesses
In addition to getting a gauge on small business optimism, the NFIB’s monthly survey of small businesses also asks respondents about the biggest issue they face operating their businesses. On a combined basis, the biggest concern among small businesses is taxes or government red tape. Combined, these two issues were reported as the biggest problem for 35% of surveyed firms with taxes being the main culprit after rising 3 percentage points month over month. Right on the heels of government-related concerns, labor concerns loom large. 34% of respondents said that cost or quality of labor pose the biggest issue their business face with costs accounting for 8%, unchanged from last month, while the quality of labor jumped from 24% to 26%. For the latter, that is in the top 1% of all readings hitting the highest level since November 2019. If there is any positive to pull out of what Main Street views as the biggest problems, it is the lack of companies citing poor sales. Just 5% of respondents saw this as the biggest issue; down 13 percentage points versus last year, and it is now at the lowest level since September 2018. On the downside, the number of firms reporting problematic inflation has risen rapidly going from 2% at the end of 2020 to 8% today. Such an elevated reading has not been observed since April 2012. Click here to view Bespoke’s premium membership options for our best research available.

Small Businesses Can’t Find Workers And Are Raising Prices
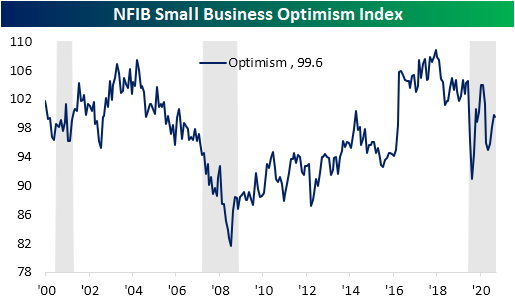
The NFIB released its monthly reading on the sentiment of small businesses this morning. In the past, we have noted how the results of this survey are often correlated with political happenings. As such, the index dropped in the wake of the election but found a bottom in January. Since then, it has remained weaker than during the Trump years, albeit it has also improved almost every month this year. That is except for the most recent month. May snapped a three-month winning streak with a slight decline from 99.8 to 99.6.
With the headline number slightly lower, breadth in the May report was fairly mixed. Of the ten inputs to the optimism index, half were higher, two went unchanged, and three were lower versus April’s readings. Three of those indices that moved higher—Plans to Increase Employment, Current Inventory, and Job Openings Hard to Fill—set new records. While it is not an input to the headline reading, the index for Higher Prices also rose to a new record high. Overall, the survey implied generally strong conditions with a few areas of concern: labor market tightness and inflation.

The report showed solid realized sales as the index of Actual Sales Changes rose 4 points to 7. That marks a return to pre-pandemic levels. On net, a higher share of businesses also expects sales to continue to improve, although only at 3, the index is still at the low end of its historical range. In spite of the higher actual sales, a higher share of businesses are reporting worse bottom-line results versus the prior three months as the index for Actual Earnings Changes fell to -11.
In an attempt to make up for those weaker margins, a record share of businesses also are reporting that prices are higher than three months ago. A net of 40% of respondents reported that they are raising average selling prices; a record high in the data dating back to 1986. The NFIB noted that price hikes were most common for wholesalers (65% reported higher prices vs. 2% lower) and manufacturers (47% reported higher prices and 1% reported lower). That is consistent with other data of the past few months showing prices are flying higher. Likely as a result of all of this in addition to other labor concerns (more on that below), the Outlook for General Business Conditions fell to -26, the lowest level since 2012 and in the bottom 1% of all months. Additionally, the share of businesses reporting now as a good time to expand ticked lower.

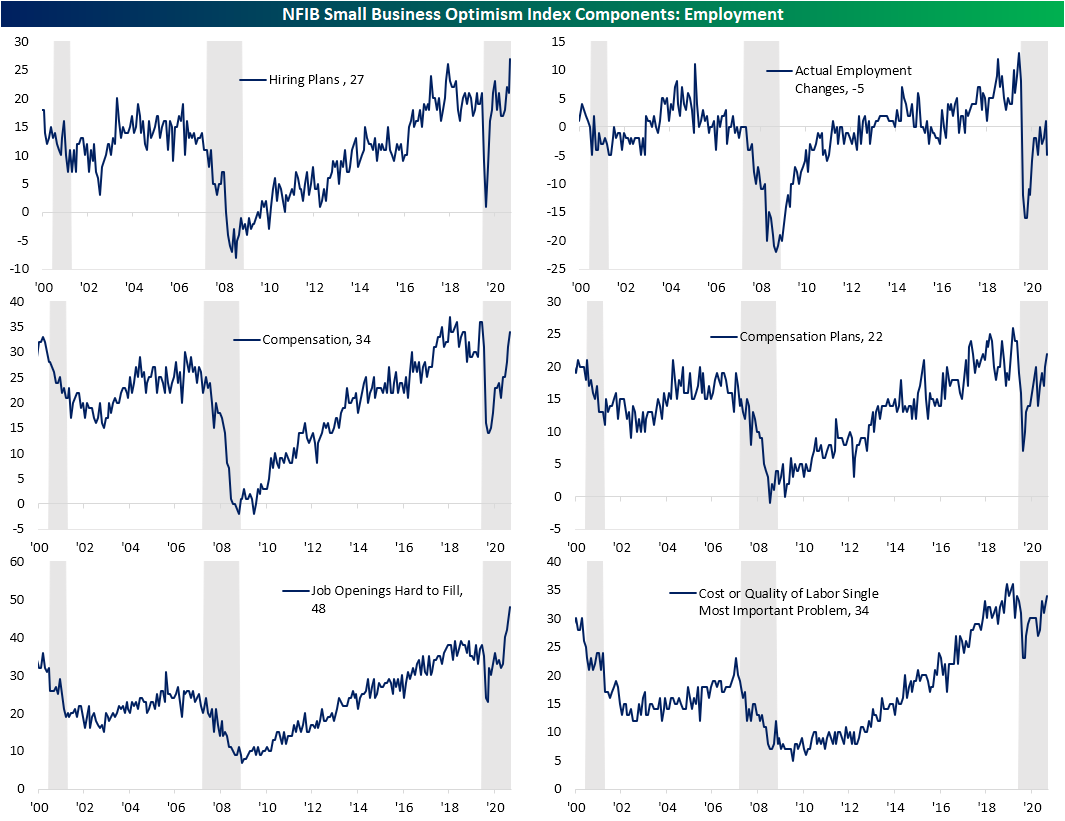
One major area of strength, at least in terms of demand, is employment. A net 27% of respondents reported that they plan to create new jobs within the next three months; surpassing the prior record high from August 2018 by a full point. But even though businesses are putting the offers out there, on net fewer businesses reported an actual employment change. In fact, that index fell sharply by 6 points; a move that ranks in the bottom 2% of all monthly changes. Additionally, a record share of businesses reporting job openings as hard to fill as 34% of businesses report their biggest problem to be either the cost or quality of labor. That is indicating significant labor market tightness. As a result, more businesses are or are planning to raise compensation with those indices at the highest levels of the past year and consistent with readings from 2017 up through the onset of the pandemic. Those higher costs are likely one reason for the weaker reading in actual earnings changes and higher selling prices previously mentioned.
As for the other side of the production function, capital expenditures are not being raised in any sort of significant way nor are plans to increase expenditures. Potentially to get ahead of the strong demand and labor supply mismatch, businesses are raising inventory levels with a record share of businesses reporting that current inventory levels are “too low”. Rising to 8, that index took out the joint high of 7 from last month and December. Click here to view Bespoke’s premium membership options for our best research available.

Brazil Boils
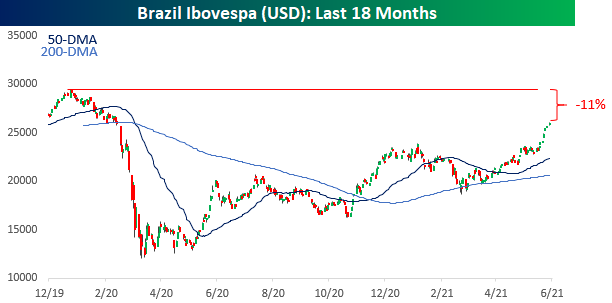
It’s been a hot time for stocks in Brazil over the last several days. The country’s benchmark Ibovespa index broke out above its highs from early this year completing a cup and handle formation and hasn’t looked back since. Yesterday was the index’s eighth straight day of gains during which the index has rallied more than 6%. This morning, the country is in the spotlight again as Berkshire Hathaway (BRK.b) has agreed to buy a $500 million stake in Nu Pagamentos SA, valuing the company at $30 billion. You may have never heard of Nu Pagamentos, but it is a privately held company that does business under the name Nubank, which is the largest fintech company in Latin America.

With the recent weakness in the dollar, the rally in Brazilian equities has been even stronger for US-based investors. During the same eight-day winning streak, the Ibovespa is up over 12% is USD. As shown in the chart below, though, while dollar weakness has flattered returns for Brazilian equities from a US-based investor’s perspective in the short-term, it’s been the opposite pattern over the longer term. While the Ibovespa is well above its early 2020 highs in local currency terms, on a dollar-adjusted basis, it’s still down 11%. Click here to view Bespoke’s premium membership options.
Bespoke’s Morning Lineup – 6/8/21 – Six or Twelve
See what’s driving market performance around the world in today’s Morning Lineup. Bespoke’s Morning Lineup is the best way to start your trading day. Read it now by starting a two-week free trial to Bespoke Premium. CLICK HERE to learn more and start your free trial.
“You can only do so many things great, and you should cast aside everything else.” – Tim Cook
Depending on whether you look at closing or intraday levels, the S&P 500 closed out yesterday within six or twelve points of a record high. This morning, equity futures are up relative to Monday’s close, and the way things are going now, that closing high from a month and a day ago will be topped at the open.
The economic calendar is light today. NFIB Small Business Optimism for May was released earlier, and while economists were expecting a modest bounce from April’s level, the actual reading showed a modest decline (99.6 vs 101.0 consensus estimate and 99.8 in April). A key theme from this month’s report was the fact that almost half of all small businesses said they have been unable to fill open positions. As an example, 93% of small business owners hiring or trying to hire reported that they received few or no qualified applications. We’re also likely to see a reinforcement of this trend later this morning when the JOLTS survey shows another likely record number of job openings despite the fact that job creation has been less impressive than forecasts.
Read today’s Morning Lineup for a recap of all the major market news and events including a discussion of the Biogen Alzheimer’s treatment, a recap of activity and economic data overnight, and the latest US and international COVID trends including our vaccination trackers, and much more.
Yesterday marked the beginning of the annual Worldwide Developers Conference (WWDC) from Apple (AAPL). While the company has been holding this event for over 30 years, its popularity really exploded following the launch of the iPhone in 2007. The conference first sold out in 2008 after Steve Jobs announced in October 2007 that Apple would open the iPhone up for developers to write software. The WWDC has historically been a noteworthy event for people involved in the development of Apple products, but it hasn’t historically been a great period for the stock.
The table below shows the performance of AAPL stock leading up to and during every prior WWDC in the iPhone era and since the conference first sold out in 2008. This year marks only the fourth time in the last 14 years where AAPL’s stock was down YTD heading into the conference. During the conference, though, performance has been on the weak side averaging a decline of 1.43% (median: -1.15%) with positive returns only four out of 13 times.

Orcale (ORCL) Surges Above Price Targets
Thus far in 2021, most of the 30 largest S&P 500 stocks are in the green on a year-to-date basis with a few notable exceptions. The largest company with a $2.1 trillion market cap, Apple (AAPL), has fallen 5.88% year-to-date and is down nearly 14% from its 52-week high. Of the 30 largest stocks, the only two other stocks that are down by more year-to-date and are also further below their 52-week highs are Netflix (NFLX) and Tesla (TSLA). TSLA has been particularly hard hit with a 17% loss so far in 2021 which brings it down 35% from its high. Conversely, Alphabet (GOOG), JPMorgan Chase (JPM), NVIDIA (NVDA), Bank of America (BAC), and Oracle (ORCL) are some of the stocks that are closest to new highs (around 1% away) and are up around 30% or better YTD. Unsurprisingly for an Energy sector stock, the best performer this year has been Exxon Mobil (XOM) which is closing in on a 50% gain YTD.
After setting new record highs right around a month ago, the S&P 500 pulled back to its 50-DMA which it found support at on May 12th. The subsequent rally since then has seen the index make a run back up to those record highs which it has been hovering around in recent days. Since its May 12th low, by far the two best-performing stocks in the 30 largest stocks have been NVIDIA (NVDA) which has gained 27.71%, and salesforce.com (CRM) which has risen a smaller, but still impressive, 12.85%; both companies reported triple plays in late May which partially played a role in that strength. While far from a leader, AAPL is also up in that time as is the rest of the trillion-dollar market cap club.
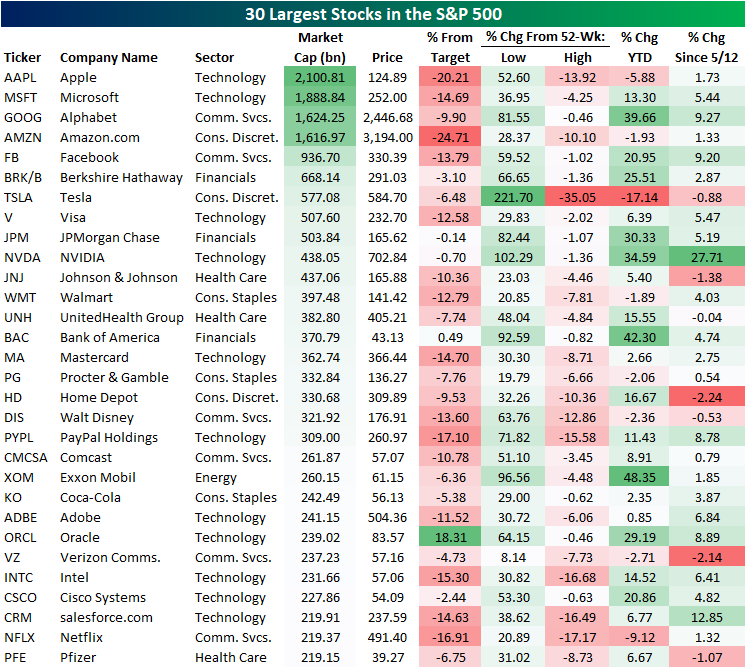
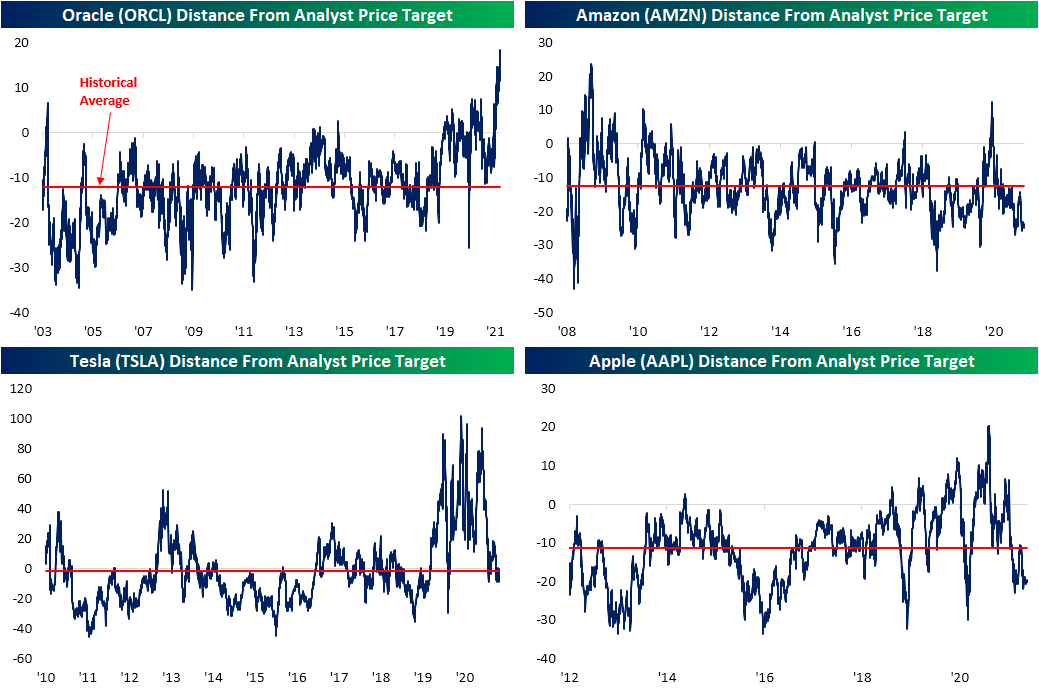
Another interesting thing to note of the stocks in the table above is their distances from their analyst price targets. There are a handful like JPMorgan Chase (JPM), NVIDIA (NVDA), and Bank of America (BAC) that are currently within 1% of their consensus price targets. After their strong runs this year, though, the median distance from a target for the full list is approximately 10% below. BAC is actually slightly above its target, and not many others can say that. In fact, the only other name of the largest stocks currently trading above its analyst price target is Oracle (ORCL), and it’s doing so in a big way. As shown above, ORCL is currently over 18% above its target. Going back through the history of the data for the stock, no other period since 2003 has seen ORCL trade as elevated above its target as it does now. For ORCL to get back below its average price target, either its share price would need to fall or analysts would need to significantly increase their price targets.
Looking at the other end of the spectrum, Amazon (AMZN) and Apple (AAPL) are the two names furthest below their price targets. For each of these stocks, trading that far below the analyst price target has been relatively uncommon over the past several years. For these two stocks to get back to where they normally sit relative to analyst price targets, either the stocks need to rise or analysts need to lower their price targets. For these two mega-cap behemoths, we think the latter is more likely.
While it does not stand out from the list of the other largest stocks as it only trades 6.5% below its target, TSLA is also notable. Over the past two years, the stock has continuously left its targets in the dust on average sitting 26% above. In July of last year, TSLA’s price even doubled the target price. But with the stock’s weakness this year, its distance from its price target is much closer in line with the historical average. Click here to view Bespoke’s premium membership options.
Bespoke’s Morning Lineup – 6/7/21 – Drifting into Positive Territory
See what’s driving market performance around the world in today’s Morning Lineup. Bespoke’s Morning Lineup is the best way to start your trading day. Read it now by starting a two-week free trial to Bespoke Premium. CLICK HERE to learn more and start your free trial.
“We contend that for a nation to try to tax itself into prosperity is like a man standing in a bucket and trying to lift himself up by the handle.” – Winston Churchill
Futures started off with a negative bias this morning but have been drifting higher all morning and are now modestly positive for both the S&P 500 and Dow, while the Nasdaq is just barely lower. Treasury yields are higher, but the 10-year yield is still well below 1.6%, and even bitcoin is following the lead of equities and moving further into positive territory. It was a mixed weekend for the crypto-currency as China appears to be cracking down on the space while El Salvador said it will recognize bitcoin as legal tender.
Read today’s Morning Lineup for a recap of all the major market news and events including a discussion of the Global Minimum Tax, a recap of activity in Asia and Europe, and the latest US and international COVID trends including our vaccination trackers, and much more.
With the S&P 500 inching closer to new highs last week, the majority of sectors also traded higher. With crude oil continuing to rally towards 52-week highs, the Energy sector surged nearly 7% taking its YTD gain to nearly 50%. Behind Energy, four other sectors were up over 1%, and there are now four sectors that are already up over 20% YTD. Talk about a strong year!
On the downside, only two sectors were down last week (Consumer Discretionary and Health Care). Consumer Discretionary is the only sector trading more than 1% below its 50-day moving average and one of just two sectors (Utilities being the other) that finished the week below that level.

Bespoke Brunch Reads: 6/6/21
Welcome to Bespoke Brunch Reads — a linkfest of the favorite things we read over the past week. The links are mostly market related, but there are some other interesting subjects covered as well. We hope you enjoy the food for thought as a supplement to the research we provide you during the week.
While you’re here, join Bespoke Premium with a 30-day free trial!
New Research
Why Do Borrowers Default on Mortgages? A New Method For Causal Attribution by Peter Ganong & Pascal J. Noel (NBER Working Papers)
What drives default on mortgages? The authors estimate that roughly 97% of all mortgage defaults take place because of an adverse shock which leaves borrowers unable to cover their monthly payment, not because they are strategically walking away from an LTV over 100. [Link; soft paywall]
How Teach for America Affects Beliefs about Education by Kathrine M. Conn, Virginia S. Lovison, and Cecilia Hyunjung Mo (Education Next)
TFA volunteers acquire a greater appreciation for societal inequality in educational under-attainment, reduces support for charter schools and vouchers, and raises optimism that an excellent education in the US is possible for all children. [Link]
Labor Markets
The Divergent Signals about Labor Market Slack by Troy Gilchrist & Bart Hobijn (FRBSF Economic Letter)
Using a broader snapshot of the labor market shows that on balance the U3 unemployment rate is roughly representative of where things currently stand…with the important caveat that dispersion across indicators is much higher than historically has been the case. [Link]
Restaurants, Supermarkets Can’t Find Enough Workers to Open New Locations by Jaewon Kang & Heather Haddon (WSJ)
Grocers and restaurants that rely on large pools of low-prerequisite labor are struggling to find enough workers to staff new locations. [Link; paywall]
Price Tags
Why dirt from Mars could be the most expensive substance known to mankind (Science Insider/Twitter)
Three different joint space missions are hoping to bring back a couple of pounds of soil from Mars at a price tag of more than $9bn, making it easily the most expensive way to grow tomatoes ever devised (note: that’s not what scientists will use it for). [Link]
Building a Home in the U.S. Has Never Been More Expensive by Marcy Nicholson, Dave Merrill, & Cedric Sam (Bloomberg)
A fascinating walk-through of how much prices have risen for key inputs to home construction. Lumber features prominently but many other costs have also soared. [Link; soft paywall]
Disease
Covid-19 Prevention Measures Are Keeping Childhood Diseases Like Chickenpox at Bay by Peter Landers & Miho Inada (WSJ)
While COVID and related responses have had lots of negative impacts on children, there are some positives: more handwashing, masks, and other non-pharmaceutical interventions have led to a collapse in case counts for diseases like flu, chicken pox, strep throat, and rotavirus. [Link; paywall]
Moderna to take mRNA flu and HIV vaccines into Phase 1 trials this year by Rachel Arthur (BioPharma)
The company behind one of the two mRNA vaccines that were first to market in the fight against COVID is starting Phase 1 trials for flu and HIV this year, with another vaccine against cytomegalovirus (which causes mononucleosis). [Link]
Matters of State
Shrinking California by Will Wilkinson (Substack)
In 2020 California’s population shrank by over 180,000 people, with an interesting array of implications for both that state’s politics and states where former residents of the Bear Flag Republic are heading to. [Link]
West Virginia Gov. Jim Justice Is Personally Liable for $700 Million in Greensill Loans by Julie Steinberg & Duncan Mavin (WSJ)
Companies owned by West Virginia’s two-term governor are on the hook for hundreds of millions in loans backed by coal receivables, and the financial liability may roll all the way up to the governor’s mansion. [Link; paywall]
Cheating
Inside The ‘World’s Largest’ Video Game Cheating Empire by Lorenzo Franceschi-Bicchierai (Vice)
A group that found exploits to Tencent’s Playerunkown Battlegrounds Mobile and sold them for millions ended up attracting the attention of Chinese police. [Link]
Read Bespoke’s most actionable market research by joining Bespoke Premium today! Get started here.
Have a great weekend!
Bespoke’s Morning Lineup – 6/4/21 – Last Call
See what’s driving market performance around the world in today’s Morning Lineup. Bespoke’s Morning Lineup is the best way to start your trading day. Read it now by starting a two-week free trial to Bespoke Premium. CLICK HERE to learn more and start your free trial.
“Public business, my son, must always be done by somebody. It will be done by somebody or other. If wise men decline it, others will not; if honest men refuse it, others will not.” – John Adams
If someone says that “you live in a bar,” the odds are that it’s not a compliment, but if you ever find yourself on the receiving end of that comment, you’re in good company. John Adams may not have been the first President of the United States, but he was the first President known to have taken up residence in a bar. On this day yesterday in 1800, President Adams moved into the Union Tavern in Georgetown while construction was being done on the White House. That means that on this day in 1800, President Adams became the first and only known sitting US President to ever wake up in a bar. There may have been others in the 220 years since, but to our knowledge, the lips of Secret Service agents have been sealed!
In market news this morning, US futures have moved into positive territory following the weaker than expected May Non-Farm Payrolls report, but the big move has been in the crypto space where bitcoin is down over 7% after Elon Musk tweeted a broken-hear emoji for the token. A 7% decline on an asset class worth about $700 billion over a tweet? If last year wasn’t 2020 and this year wasn’t 2021, we’d be surprised at a move like that.
Read today’s Morning Lineup for a recap of all the major market news and events including a recap of the RBI rate decision, economic data out of Europe, and the latest US and international COVID trends including our vaccination trackers, and much more.
Maybe it’s just because the topic is in the front of our minds lately, but it seems as though everywhere we look, the same rangebound pattern shows up. This morning’s example is the Russell 2000. All year now, the index has been in a relatively narrow range, and given the fact that the index closed yesterday right in the middle of that range, it doesn’t look like it’s going to break in one way or the other very soon.
