Sentiment Contradicts Price Action
The S&P 500 may have fallen around 1.5% over the past week, but individual investors have reportedly become increasingly bullish. 26.1% of responses to the weekly AAII sentiment survey reported as bullish this week, up from a recent low of 18.1% last week. With the S&P 500’s worst day in since June 2020 and a hotter-than-expected CPI print occurring late in the response collection period (12:01 AM on Thursday through 11:59 PM Wednesday night), the timing of responses is a potential cause for the increase in optimism that was contrary to equities’ price action. In other words, responses that came in prior to Tuesday were likely far more bullish than those that came in afterward and therefore elevating the level of bullish sentiment. As such, next week will be a more telling read on individual investor sentiment as it will more fully capture recent price action and inflation data.

While bulls rose back above a quarter of responses, bears fell back below 50%. Bearish sentiment dropped to 46% which was only the lowest level since the week of August 24th.

Those moves meant the bull-bear spread rose 15.3 points week over week going from -35.2 up to -19.9. That was the largest one-week jump in the reading since the end of June. However, that indicates sentiment remains heavily in favor of pessimism as the streak of negative readings grows to 24 weeks long; the second longest streak of negative readings on record.


The AAII survey was not alone in showing a rebound in sentiment. Both the Investors Intelligence survey and the NAAIM Exposure Index highlighted increased bullishness in the latest week’s data. As with the AAII survey, though, the collection periods likely did not fully capture the effects of Tuesday’s inflation data and historic one-day decline. Overall, the story remains that investors are remarkably bearish. Click here to learn more about Bespoke’s premium stock market research service.

Claims Avoid Seasonal Lows
The move lower in jobless claims pressed on this week as the seasonally adjusted reading dropped another 5K down to 213K in addition to last week’s reading being revised 4k lower to 218K. That exceeded expectations which were calling for claims to rise up to 225K. This week was the fifth consecutive decline in adjusted claims with a total drop of 39K in that span. That is the longest streak of declines since December of last year when claims had fallen for 11 weeks in a row as the end of pandemic era programs was approaching.
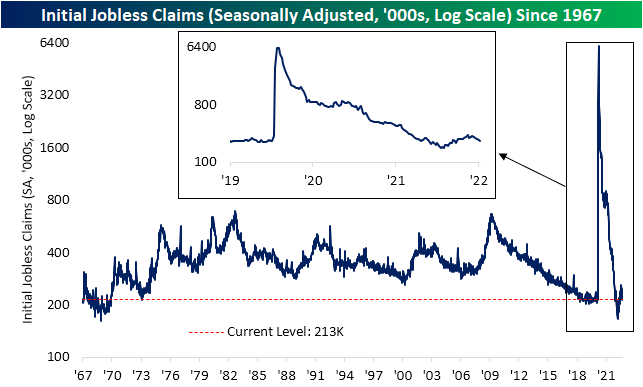
Although the continued decline in seasonally adjusted claims have not resulted in any sort of a new low, unadjusted claims are far more impressive. Taking a historical average of claims throughout the year, most of the time claims would have bottomed by now, but that is not the case this year. Unadjusted claims have continued to fall over the past couple of weeks and are all the way down to 156K; the lowest level since October 1969. That is not to say claims are completely bucking seasonal trends as the current week of the year has marked seasonal lows in years like 2009, 2010, 2015, and 2016. In other words, it is hard to distinguish how much of the continued decline is seasonal versus material improvement in claims, and regardless, claims remain at historically strong levels.

As for continuing claims, the latest reading for the week of September 2nd edged up modestly to 1.403 million. As with initial claims, continuing claims saw the previous week’s reading revised lower from 1.473 million to 1.401 million resulting in the latest print coming in well below estimates of 1.478 million.
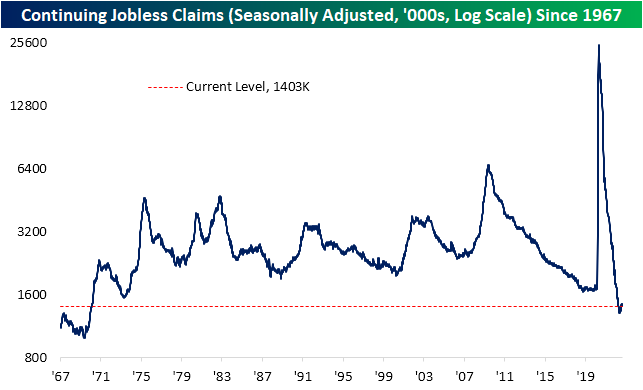
Recently we have been highlighting the ratio between initial and continuing claims to highlight how the latter has generally been stronger than the former. However, with initial claims falling for a fifth week in a row without a similar decline in continuing claims, the ratio of the two has been reversing lower and is approaching more normal levels. In fact, the one-month change in the reading has been on the large size ranking in the bottom 3% of all moves on record. Click here to learn more about Bespoke’s premium stock market research service.

Bespoke’s Morning Lineup – 9/15/22 – Lehman Day
See what’s driving market performance around the world in today’s Morning Lineup. Bespoke’s Morning Lineup is the best way to start your trading day. Read it now by starting a two-week trial to Bespoke Premium. CLICK HERE to learn more and start your trial.
“The key to risk management is never putting yourself in a position where you cannot live to fight another day.” – Dick Fuld

Below is a snippet of content from today’s Morning Lineup for Bespoke Premium members. Start a two-week trial to Bespoke Premium now to access the full report.
To some, September 15th means that summer ends in a week, but others remember September 15th as the day Lehman died. Regardless of what comes to your mind first, it’s a lousy day. Equity futures are lower, treasury yields are higher, and crude oil is lower heading into what is going to be a busy day for data. Things kicked off at 8:30 with jobless claims, retail sales, import prices, Empire Manufacturing, and the Philly Fed. Jobless Claims were better than expected as were Retail Sales. Import Prices were less weak than expected, and finally, both the Empire and Philly Fed reports were negative, although the Empire was slightly better than expected while the Philly report was weaker. Perhaps most notable was that in both regional Fed reports, the Prices Paid components were at the lowest levels since December 2020. At 9:15, we’ll get updates on Industrial Production and Capacity Utilization, and then finally at 10:00 we’ll finish the day of data with Business Inventories.
Asian markets were mixed overnight while Europe is mostly higher. Japan’s Finance Minister warned markets that any intervention in the currency markets would be ‘swift’ and not announced in advance. In Europe, an ECB policymaker said he sees price pressures spreading out in the economy and warned that the central bank might be forced to raise rates more than expected.
September has historically been a lousy month for stocks, and the second half of the month has been notoriously weak. Over the last 40 years, the S&P 500’s median performance has been a decline of 0.49% with positive returns just 40% of the time. Making matters even worse, the years where the S&P 500 was down in the second half of the month saw a much larger magnitude of decline (-1.92%) than the years when it was up (1.07%). The last ten years have been even more painful. From 2012 to 2021, the second half of September has only been up three times and the median decline has been 0.81%.

Our Morning Lineup keeps readers on top of earnings data, economic news, global headlines, and market internals. We’re biased (of course!), but we think it’s the best and most helpful pre-market report in existence!
Start a two-week trial to Bespoke Premium to read today’s full Morning Lineup.
Big Gap Down Takes Out the 50-Day
Headed into Tuesday, the S&P 500 had been on a solid post-Labor Day rally, however, the hotter-than-expected CPI reading sent stocks reeling. After gapping down below its 50-day moving average, the S&P 500 (SPY) finished the day with a decline of over 4%. Additionally, another technical development of note as a result of yesterday’s move was that the breakout above the past few weeks’ downtrend line appears to have only been a pump fake.

While moves above or below the 50-DMA are a fairly common technical development, those similar to Tuesday are a bit rarer than might be expected at first glance. Prior to yesterday, the S&P 500 ETF (SPY) had only opened below its 50-DMA thanks to a gap down of at least 2% four other times since the ETF began trading in 1993: April 8, 1996, April 27, 2000, June 24, 2016, and February 24th, 2020. Looking across each of these instances, the 2020 occurrence was the only one that was followed by a prolonged period with the SPY staying below its 50-day. By comparison, the 1996 and 2000 instances saw the S&P continue to fluctuate around its 50-day in the months ahead. In fact, the April 2000 occurrence actually saw the S&P 500 rise back above its 50-day by the end of that same day. Meanwhile, the 2016 instance saw SPY quickly regain its losses as it traded above its 50-DMA for much of the next few months. Click here to learn more about Bespoke’s premium stock market research service.

Bespoke’s Morning Lineup – 9/14/22 – Holding For Now
See what’s driving market performance around the world in today’s Morning Lineup. Bespoke’s Morning Lineup is the best way to start your trading day. Read it now by starting a two-week trial to Bespoke Premium. CLICK HERE to learn more and start your trial.
“He who fears being conquered is sure of defeat.” – Napoleon Bonaparte
Below is a snippet of content from today’s Morning Lineup for Bespoke Premium members. Start a two-week trial to Bespoke Premium now to access the full report.
Futures were modestly higher relative to yesterday’s decline for a little while this morning, but those gains have evaporated almost as fast as yesterday’s decline erased the prior four days of gains. Yesterday was pretty much a bloodbath in the equity market as not a single stock in the S&P 1500 was up 5%, and only 18 stocks in the entire index of 1500 stocks were even up on the session. Strangely enough, though, only 12 stocks in the index declined 10%+. For a day when the index was down over 4%, that’s a surprisingly low number. we’ve seen more stocks down by 10%+ on days when the broader market was only down 1%.
After yesterday’s hotter-than-expected CPI report, the August PPI was right in line at the headline level with a 0.1% m/m decline and an 8.7% y/y increase. Stripping out food end energy, the m/m reading was 0.4% compared to expectations for a gain of just 0.3%. The y/y reading was also higher than expected at 7.3% versus forecasts for an increase of 7.0%. This report certainly wasn’t as bad as the CPI report, but levels remain stubbornly high.
At the open yesterday, the S&P 500 erased the prior two days of gains, and by the close, it had basically erased the gains of the two days before that. How’s that for efficiency? As bad as the sell-off was, the one thing bulls have working in their favor is that the uptrend line off the June lows has held for now. If that trendline – currently around 3,920 – doesn’t hold today, it won’t be much of a positive backdrop for a time of year that has historically already been among the weakest times of the year.

Our Morning Lineup keeps readers on top of earnings data, economic news, global headlines, and market internals. We’re biased (of course!), but we think it’s the best and most helpful pre-market report in existence!
Start a two-week trial to Bespoke Premium to read today’s full Morning Lineup.
Chart of the Day: Breadth Doesn’t Get Much Hotter
COTD Bullet Points:
- The past week (before Tuesday) has seen outright impressive breadth from the S&P 500 as the 5-day advance/decline line has risen to one of the highest levels of the past decade.
Chart of the Day:
Although equities are pulling back sharply in the wake of the CPI release, leading into today the S&P 500 had taken a straight shot higher since coming back from the Labor Day holiday with the index moving higher each day save for last Tuesday. Even more impressively, it wasn’t just a handful of FANG-type mega caps driving the index higher. Breadth has been impressively strong. Typically, we track short-term breadth using the 10-day advance/decline (A/D) line which we update daily in our Sector Snapshot. While that line was basically neutral heading into today, the 5-day A/D line was at the extreme side of historically positive readings. Reaching a reading of 52.8% as of Monday’s close, the reading ranked in the 99.7th percentile of all days since 1990 when our data begins. As for some other most recent examples of breadth reaching such extended levels, there have been two occurrences in the past year: one near the end of 2021 and one this past May.
To read the rest of today’s Chart of the Day as well as gain access to our other reports and tools, start a two-week trial to Bespoke Premium.

Pain in CPI
With investors expecting consumer prices to fall month-over-month heading into the day, this morning’s higher-than-expected headline and core CPI reports caused an instantaneous reversal in market sentiment heading into the opening bell. While equity index futures were indicating a gain of around 75 basis points heading into the print, after the release, indications were for a decline of 2%. When the opening bell finally rang, the S&P 500 gapped down 2.27% as indicated by the tracking ETF – SPY.
Going back to 1998, today marked just the sixth time that SPY gapped down in excess of 2% on the day of a CPI release. As shown in the top of the table below, on four of the five prior 2%+ gaps down on CPI days, SPY not only gapped down by over 2%, but it continued lower throughout the trading day. While that doesn’t necessarily bode well for today, we would note that on many of those prior occurrences, there were other overriding factors impacting the market. From the Russian debt default and collapse of Long-Term Capital Management (LTCM) in 1998 to the Financial Crisis in 2008, the US debt downgrade in 2011, and then COVID in 2020, on most of these other days, investors had other issues besides inflation to worry about. The only time that there wasn’t another major issue impacting the market was on 5/14/99 when headline CPI exceeded forecasts by 0.3 ppts and core CPI exceeded consensus estimates by 0.2 ppts.
At the bottom of the table, we have listed every other time since 1998 that core CPI exceeded consensus forecasts by 0.3 ppts or more. Today’s report is just the fourth time that core CPI has topped estimates by such a wide margin, but what stands out most is that every other prior occurrence since 1998 came after COVID. We noted numerous times in the past how COVID has created so many distortions in the economy that the job of forecasting it has become exceedingly difficult, and the fact that every ‘beat’ of this magnitude in core CPI has occurred since COVID only reinforces this point. Click here to learn more about Bespoke’s premium stock market research service.

Bespoke’s Morning Lineup – 9/13/22 – Dun Dun
See what’s driving market performance around the world in today’s Morning Lineup. Bespoke’s Morning Lineup is the best way to start your trading day. Read it now by starting a two-week trial to Bespoke Premium. CLICK HERE to learn more and start your trial.
“As soon as you become complacent your show gets canceled.” – Dick Wolf
Below is a snippet of content from today’s Morning Lineup for Bespoke Premium members. Start a two-week trial to Bespoke Premium now to access the full report.
32 years ago today, a new show called “Law & Order” debuted on NBC. “Law & Order” opened to little fanfare, but it has gone on to become one of the most successful and long-running franchises on TV. At the peak of linear TV, there probably wasn’t a time of day that the show or one of its numerous spin-offs was not airing somewhere on cable TV, and the famous “dun dun” sound effect has become one of the most recognizable sounds on TV.
When “Law & Order” first aired, the reviews weren’t positive. The Hollywood Reporter called the show “a program that fails to properly function.” Based on the initial reviews, it’s hard to imagine that the original episode in 1990 would spawn multiple spin-offs and thousands of hours of content. But like all successful investments, it takes a creative and forward-looking mind to see how something that may look ordinary today can turn into something very valuable down the line. On to the markets…
Inflation is the big indicator to watch today, and consensus expectations had the headline number penciled in at a m/m decline of 0.1% with the core reading rising 0.3%. The actual numbers were stronger than expected with the headline rising 0.1% while the core reading was double expectations. Markets were positioned for a weaker print, so the strong number completely reversed (and then some) the positive tone in equity futures. It’s hard to remember a time when an 8:30 number caused such a sharp and near-instantaneous reversal in futures. After official numbers like these, it’s impossible to say that inflation isn’t a problem anymore, but at the same time, it doesn’t change the fact that the pile of secondary indicators showing softening inflation pressures from peaks just a few months ago has really started to pile up.
Just like inflation, breadth has gone from one extreme to the other but in a much tighter timeframe. Coming off the June lows, we saw extremely positive breadth in the S&P 500. Then, towards the tail end of the late summer sell-off, breadth turned extremely negative. The last four trading days, however, have seen breadth reverse again with four straight days of net positive readings in excess of +250 and two positive ‘all or nothing days’ (days where S&P 500 net daily breadth reading comes above +400 or below -400). Long story short. It’s been a broad rally.
With two all-or-nothing days in the last week, we wanted to update our chart of occurrences by year. With 26 so far this year, 2022 is on pace for 37 all-or-nothing days this year, and if that pace comes in, it will rank as the third-highest total since the end of the Financial Crisis and the 7th highest total for all years since 1990. Although the period before 2000 doesn’t even really count, since all-or-nothing days were so rare back then.

Our Morning Lineup keeps readers on top of earnings data, economic news, global headlines, and market internals. We’re biased (of course!), but we think it’s the best and most helpful pre-market report in existence!
Start a two-week trial to Bespoke Premium to read today’s full Morning Lineup.
11%+ Annualized – Not Bad for the ‘Worst Trade Ever’
It has now been 14 years since Lehman Brothers’ last day as a solvent company – an event that set off one of the biggest market meltdowns of all time. In hindsight, the events leading up to and after September 2008 may not seem all that bad. How quickly we forget. Three-quarters of a century removed from the Great Depression, most Americans had never given a second thought to the safety of the funds in their savings account or even money-market funds, but shortly after Lehman, these were legitimate concerns on the part of all Americans. People were actually going to ATMs and taking out extra cash to literally put ‘under their mattress’ just in case they woke up and the ATMs weren’t working anymore.
Most of these extremes came after the Lehman bankruptcy, but the period leading up to Lehman wasn’t a picnic either; that’s actually why Lehman went belly-up. From the S&P 500’s peak in October 2007 through 9/12/08, the S&P 500 was down over 20%. But after an early summer sell-off, the S&P 500 rallied from mid-July to mid-August before selling off into Labor Day. Heading into the weekend after Labor Day, the S&P 500 was down 4% from its mid-August high but appeared to be stabilizing at a higher low relative to July. With the S&P 500 still down 20% from its all-time high, you couldn’t have faulted someone heading into the weekend for thinking “maybe I’ll try to buy something on sale.”

On 9/12/08, stocks may have been on sale relative to the October 2007 highs, but any buys on that day would quickly go down as one of the ‘worst trades ever.’ After Lehman announced its bankruptcy that weekend, cracks spread all over the financial district from a Wall Street parched of liquidity. September ended with a decline of nearly 10% but continued to get worse from there, and by the following March, the S&P 500 was down just under 46% – or 71% annualized – from its ‘pre-Lehman’ close’. Stocks that seemed cheap less than six months earlier were now down by nearly half, so getting back to even from there would pretty much require a double. Speaking from experience, any investor who bought any stocks in those six months quickly felt like the stupidest investor in the world.

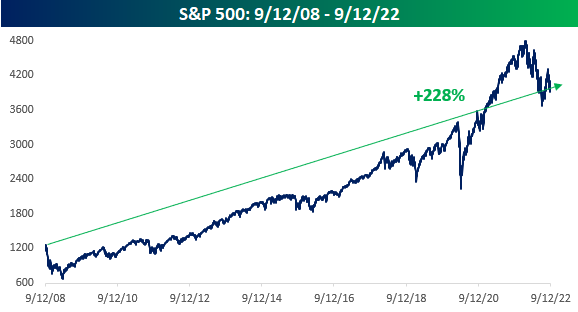
While any equity purchases made 14 years ago just before Lehman collapsed quickly turned into some of the worst trades ever, time is an investor’s best friend. Anyone who had time gradually looked less foolish. From a longer-term perspective, the decline from September 2008 to March 2009 still looks painful, but over time, the market (as it has to this point always done) dug itself out of its hole. The snowball effect of compounding has rewarded investors who were in it for the long haul. Not including dividends, the S&P 500 has rallied more than 228% since the Friday before Lehman’s bankruptcy, and including dividends, it has delivered an annualized return of more than 11%. You’d probably sign the bottom line as fast as you could for an annualized return of 11% between now and 2036!
Not bad for what seemed like the “worst trade ever” at the time. Click here to learn more about Bespoke’s premium stock market research service.
Speculators Short Precious Metals As Miners Surge
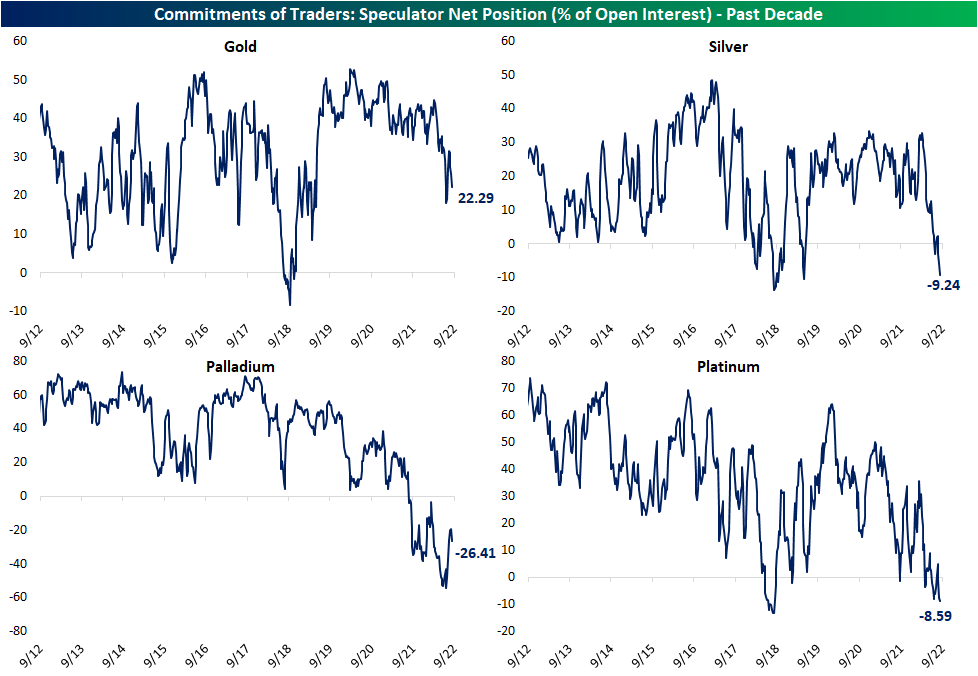
The latest CFTC’s Commitments of Traders report with data as of last Tuesday was released on Friday. This report tracks how speculators are positioned among various futures which we show as a net reading in the charts below. Positive readings indicate a net percentage of open interest is long whereas a negative reading indicates a larger share of speculators are positioned short in a given future. Below, we take a look at those readings for a handful of precious metal futures.
As shown, gold has rarely seen more shorts than longs over the past decade and is the only precious metal currently positioned net long (+22.29%). However, that is not to say this reading has not been weakening lately. This past spring, the reading fell outside of the past few years’ range, reaching a low of 18% back in mid-July. While the second half of July and some of August saw it rebound, last week marked three straight weeks of declines. Meanwhile, silver futures have seen positioning turn outright short recently. With a net 9.24% of open interest positioned short, that is the most pessimistic positioning reading since May 2019. Likewise, it has been almost four years since platinum has been as heavily bet against as now. Finally, palladium has also seen speculators turn against it in the past year to a degree not seen at any point of the past decade.
As we do each Monday, in tonight’s Closer we will provide a more in depth rundown of this data for a wide variety of assets.
As speculators turn increasingly bearish, we are actually coming off of a very strong week for metal adjacent ETFs. As shown in the screenshot of our Trend Analyzer below, the best performing ETFs last week in our US Groups screen were gold miners (GDXJ and GDX) as well as the Steel ETF (SLX) that tracks steel producers and suppliers. The Junior Gold miners (GDXJ) rallied double digits over the prior five days, which was a move that lifted it out of extreme oversold territory and almost back up to its 50-DMA.The Gold Miners ETF (GDX) was not far behind with an 8.85% rally. SLX was only a percentage point behind that as it presses into overbought territory for the first time since August 29th. Click here to learn more about Bespoke’s premium stock market research service.
