Bespoke’s Morning Lineup – 6/24/22 – Two For Twelve
See what’s driving market performance around the world in today’s Morning Lineup. Bespoke’s Morning Lineup is the best way to start your trading day. Read it now by starting a two-week trial to Bespoke Premium. CLICK HERE to learn more and start your trial.
“The riskiest strategy is to try to avoid risk altogether.” – Fredrick W. Smith

Below is a snippet of content from today’s Morning Lineup for Bespoke Premium members. Start a two-week trial to Bespoke Premium now to access the full report.
This week marks the 12th and final full week of the second quarter and barring a calamitous reversal from pre-market levels, it will be just the second positive full week of trading during Q2. That’s how bad of a quarter Q2 has been. Gains this quarter have been awfully hard to come by.
Futures are looking to finish off what has already been a positive week on an up note, but in order to stay there, we’ll have to get through the Michigan Confidence and New Home Sales reports at 10 AM. The Michigan Confidence report will be an update to the preliminary reading that was released two weeks ago and came in at the lowest level in the history of the survey dating back to 1978. It’s hard to imagine that report getting any worse.
In today’s Morning Lineup, there’s a lot covered as we discuss overnight moves in Asian and European markets, declining volatility in the crypto space, and overnight economic data from Asia and Europe.
It’s been a rough few weeks for copper as yesterday’s 5%+ decline capped off its worst five and ten-day declines since March 2020 at the depths of the COVID crash. With the title of doctor, copper’s performance is often considered to be a good gauge of the economy’s health, so the recent declines naturally raise economic concerns.
The chart below shows the historical 10-day rate of change in copper going back to 1981. During that span, there have only been seven other periods where copper declined 20% or more in a ten-day span, and as mentioned above, the most recent was during the original COVID lockdowns. There were also similar or larger declines during the Financial Crisis recession and the recessions of the early 1980s (not quite 20%) and early 1990s. While large short-term declines in copper did occur during four of the last five recessions, there were also a number of other large declines that occurred outside of recessions (1986, 1987, 2011, and 2018). Large short-term declines in the price of copper have often occurred during recessions, but they aren’t exclusive to recessions.

Start a two-week trial to Bespoke Premium to read today’s full Morning Lineup.
Chinese Stocks Have Been Outperforming
On a year to date basis, both the S&P 500 (SPY) and the KraneShares China Internet ETF (KWEB) are well in the red. However, KWEB is now outperforming SPY (-11.9% vs. -20.8%) by a considerable margin after bouncing 50% off its lows in early March. Since late May (5/24), KWEB has gained 29.7% versus a decline of 4.5% for SPY. As you can see in the first chart below, KWEB has made a few higher lows over the last few months, while SPY has continued to make lower lows.


The rolling three-month performance spread between KWEB and SPY hit an all time high of +55.8 ppts on June 10th of this year. Although the performance spread has fallen over the last few trading sessions, the outperformance is still quite notable. (It’s also worth noting that KWEB is still much further below all time highs than SPY with KWEB down 69% and SPY down 21%.)
In March of 2021, KWEB topped out and shed a considerable amount of its value. SPY didn’t follow suit until about nine months later. With KWEB rallying off of lows in recent months and actually attempting to start making higher highs, equity market bulls are hoping KWEB is leading to the upside similar to how it led to the downside.

While US markets have struggled over the last three months, Chinese equities have held up well. In this time period, the S&P 500 (SPY) has declined 16.5%, but the KraneShares China Internet ETF (KWEB) has gained 5.6%, resulting in a performance spread of 22.1 percentage points. The rolling three month performance spread peaked at 55.8 ppts on June 10th, as KWEB had gained 49.8% and SPY had dropped by 6.5% over the prior three months. This was the largest 3-month performance spread since KWEB began trading in September 2013. Throughout KWEB’s history, there have only been ten occurrences of KWEB outperforming SPY by more than 20 percentage points over three months (for the first time in three months). Although Chinese equities are still well off their highs, this recent outperformance definitely raises some eyebrows. Click here to learn more about Bespoke’s premium stock market research service.
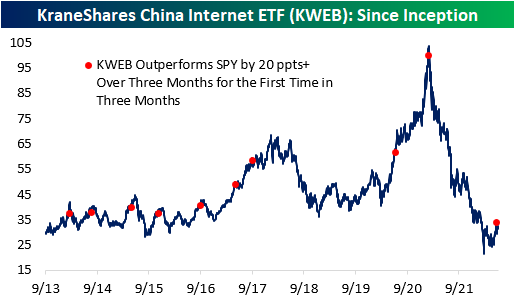
Historically, when KWEB has outperformed SPY by 20 ppts or more over three months (for the first time in three months), the ETF has tended to deliver weak forward performance. Of the nine prior occurrences, only two resulted in positive performance over the next three months, and the average return was -7.4% (median: -7.8%). Over the next year, KWEB has tended to underperform its historical averages by 12 percentage points. Across the board, positivity rates are lower than that of all periods, which holds true for median and average performance as well. Click here to learn more about Bespoke’s premium stock market research service.

Jobless Claims Move Lower
Jobless claims have been trending higher off of multi-decade lows, indicating a moderating labor market. This week, initial claims would have gone unchanged week over week at 229K if it were not for a modest upward revision to 231K to last week’s number. Claims did not change much on a week-over-week basis and remain modestly above the levels that were in place in the months before the pandemic. While it has been more than three months since initial jobless claims made a post-pandemic low, the rate of increase of those lows has been somewhat modest. Click here to learn more about Bespoke’s premium stock market research service.

On a non-seasonally adjusted basis, claims moved moderately lower after topping 200K for the first time since late April last week, and at a level of 203K, this week’s figure is the lowest in the last twenty years relative to comparable weeks.

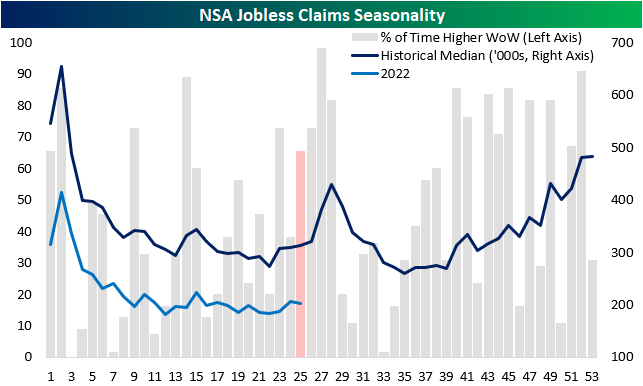
Continuing claims lag by one week relative to initial claims and moved higher for the third consecutive week, representing the longest streak of weekly increases since March 2020. However, the magnitude of the rise was quite small. In fact, at the current level of 1.315 million continuing claims are still 2.1% below the level they were at a month ago. Click here to learn more about Bespoke’s premium stock market research service.

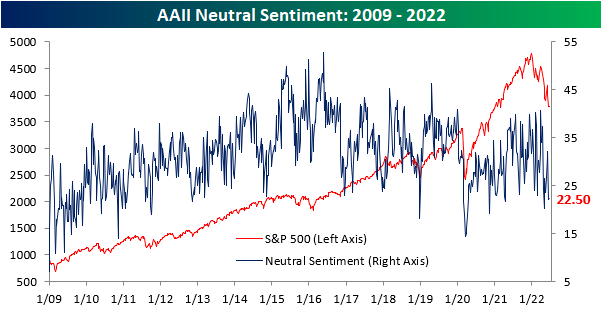
Sentiment Worsens… Again
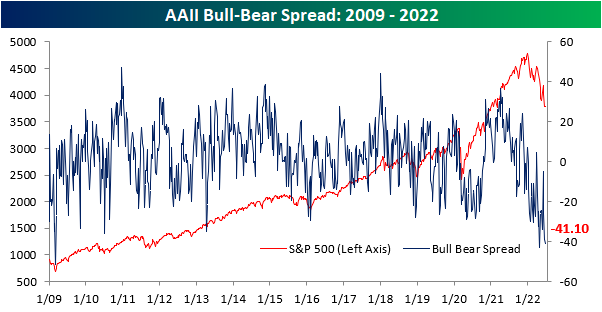
Even as the ten-year yield and crude oil have pulled back over the last few trading sessions and the S&P 500 has recuperated the losses from late last week, the percentage of respondents to the AAII survey considering themselves bullish fell for the third consecutive week. This week’s reading of 18.2% marks the lowest level since late April and ranks in the bottom 1.3% of all weeks going back to the start of the survey in 1987. On the bright side, the rate of decline in bullish sentiment has been on the decline as the percentage of respondents that considered themselves bullish fell by 11 percentage points two weeks ago, 1.6 percentage points last week, and now just 1.2 percentage points this week.

The percentage of respondents reporting neutral sentiment moved modestly higher, increasing by just 30 basis points to 22.5%. Click here to learn more about Bespoke’s premium stock market research service.
The percentage of respondents reporting bearish sentiment rose for the third consecutive week to 59.3%, the highest level since late April. The 4/28 reading was only 10 basis points higher than this week’s, so we are near the previous peak in terms of bearish sentiment. Apart from the late April reading, bearish sentiment had not topped 59% since early March of 2009. In fact, this week’s reading is in the 97th percentile of all readings since the survey began in 1987.
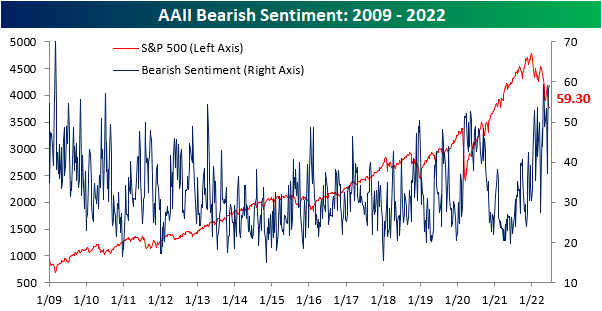
The bull-bear spread remains near historic lows, and there have now been 22 consecutive weeks in which the spread was below -10 (smoothed out by taking a four week moving average). We are now just four weeks away from setting a new record in this regard. The previous high was in 1991 when there were 26 consecutive weeks in which the bull-bear spread was under -10. Investors often view this as a contrarian indicator, as low readings in bullish sentiment leave upside for the market should sentiment bottom out and positive news emerge. Click here to learn more about Bespoke’s premium stock market research service.

Bespoke’s Morning Lineup – 6/23/22 – The Flying Powell
See what’s driving market performance around the world in today’s Morning Lineup. Bespoke’s Morning Lineup is the best way to start your trading day. Read it now by starting a two-week trial to Bespoke Premium. CLICK HERE to learn more and start your trial.
“Being on the tightrope is living; everything else is waiting.” Karl Wallenda
Below is a snippet of content from today’s Morning Lineup for Bespoke Premium members. Start a two-week trial to Bespoke Premium now to access the full report.
Nine years ago today, people all over the world watched with bated breath as acrobat Nik Wallenda became the first person to walk across the Grand Canyon on a tightrope. Technically, it wasn’t actually the Grand Canyon, but a gorge right near the Grand Canyon National Park. However, the 1,800-foot highwire trek across the gorge that took place 1,500 feet above the ground (without a net) was impressive. Wallenda’s Grand Canyon crossing came barely a year after an even more widely watched event where he became the first person to walk a tightrope over Niagara Falls. Talk about an ability to strike a balance!
Nik Wallenda is just one of a long line of ‘Flying Wallendas’ that have for decades been known for their death-defying stunts that mostly involve high-wire acts without a net. Living on the edge is simply in their blood.
Up until recently, Fed Chair Powell has been attempting his own ‘Wallenda act’ looking to strike a delicate balance between raising interest rates to fight inflation and avoiding throwing the economy into recession on the other. Just like Nik Wallenda’s walks over the Niagara Falls and The Grand Canyon, many out there say that it simply can’t be done. Powell, on the other hand, remained optimistic up until recently, arguing in mid-May that removing accommodation and raising rates could be achieved with a ‘softish’ landing in the US economy that may be a ‘little bumpy’ but ‘still a good landing’.
In the month since those May comments, though, Powell has sounded less confident, increasingly leaning on the recession side of the wire in order to prevent a fall further onto the side of inflation. Just yesterday, in Senate testimony, the Fed Chair noted that “We’re not trying to provoke, and don’t think that we will need to provoke, a recession, but we do think it’s absolutely essential that we restore price stability, really for the benefit of the labor market, as much as anything else.” Wallenda ultimately proved all his doubters wrong. Is Powell’s balance anywhere near as good?
Futures have been bouncing around this morning, but have mostly been in positive territory after yesterday’s rebound from a sharply lower open. Jobless Claims were just released and came in very slightly higher than expectations at 229K compared to forecasts for 226K. Continuing Claims, on the other hand, came in 5K lower than the consensus forecast of 1.32 million. Looking ahead to the rest of the day, Powell will testify in front of the House at 10 AM, and the EIA will release Natural Gas stockpiles at 10:30. The release of crude oil inventories, which were already delayed by a day due to the Juneteenth holiday, has been postponed indefinitely due to system issues.
In today’s Morning Lineup, there’s a lot covered as we discuss overnight moves in Asian and European markets, central bank moves, and overnight economic data from Asia and Europe.
Treasury yields are down this morning with the 10-year yield below 3.1% after topping out at just under 3.5% a little over a week ago. In the five trading days that ended yesterday (6/22), the 31 basis point decline in the 10-year yield was the largest since the COVID crash, although it followed what was the largest five-day increase in over five years.

Start a two-week trial to Bespoke Premium to read today’s full Morning Lineup.
Bespoke’s Morning Lineup – 6/22/22 – Giving it Back
See what’s driving market performance around the world in today’s Morning Lineup. Bespoke’s Morning Lineup is the best way to start your trading day. Read it now by starting a two-week trial to Bespoke Premium. CLICK HERE to learn more and start your trial.
“There are no easy fixes nor any short-term answers to the global supply and demand imbalances aggravated by Russia’s invasion of Ukraine.” – Mike Wirth, CEO of Chevron
Below is a snippet of content from today’s Morning Lineup for Bespoke Premium members. Start a two-week trial to Bespoke Premium now to access the full report.
It was fun while it lasted. In the latest example of the two steps backward, one step forward market, most of yesterday’s rally, which wasn’t enough to erase the declines of the prior two trading days, is poised to get erased at the open. Besides the fact that it’s a weekday and the market is open, there isn’t much in the way of a catalyst for this morning’s weakness. Oil prices are sharply lower with WTI down nearly 5%. Unlike most other days this year where equities and US Treasuries have moved in tandem with each other, Treasuries are actually rallying this morning.
There’s no economic data on the calendar to speak of today, but it will be a busy day of Fedspeak with Powell testifying in front of the Senate while Barkin, Evans, and Harker will also be speaking throughout the trading day.
In today’s Morning Lineup, there’s a lot covered as we discuss overnight moves in Asian and European markets, central bank moves, activity in the metals markets, and overnight economic data from Asia and Europe.
The quote above came from a letter to President Biden from Chevron (CVX) CEO Mike Wirth ahead of a scheduled meeting on Thursday between Energy Secretary Jennifer Granholm and US oil executives. The letter argues that the Biden “Administration has largely sought to criticize, and at times vilify our industry.” Wirth goes on to note that “bringing prices down and increasing supply will require a change in approach” and that the industry needs “clarity and consistency on policy matters”. Closing out, Wirth encourages President Biden that in addition to Secretary Granholm, he also “send your senior advisors to this meeting, so they too can engage in a robust conversation.”
Whatever side of the debate you are on with regards to energy policy, the current state of tension between the Federal government and the US oil industry can’t continue. While expectations are low, Thursday’s meeting will hopefully be more than a photo-op for both sides and instead help to bring some clarity to the strategy moving forward.
This morning, the Biden Administration has proposed a three-month holiday from the 18-cent per gallon federal gas tax holiday. While it sounds nice, the majority of economists and industry insiders have said it will do little to ease pressure at the pump and may actually worsen the situation by increasing demand. One study from Wharton found that a ten-month holiday would save consumers between $16 and $47 in total. The current proposal is for just three months which would imply total savings that’s barely enough to cover a McDonald’s value meal!
Despite the weakness in equity futures this morning and confusion surrounding US energy policy, oil prices are sharply lower. At a level of $104 per barrel, WTI has now pulled back 15% from its recent closing high on June 8th and has also broken the uptrend that has been in place since late 2021. Outside of the oil industry, just about everybody is rooting for this chart to keep moving lower. None more than Fed Chair Powell.

Start a two-week trial to Bespoke Premium to read today’s full Morning Lineup.
And Then It Was Energy’s Turn
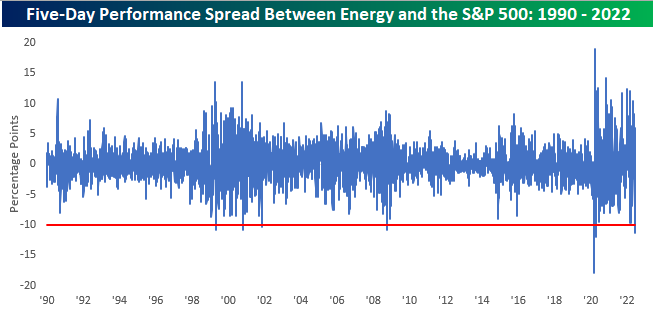
The Energy sector has bounced along with the overall market today, but last week it was that sector’s turn to get taken to the woodshed. Throughout the year, Energy was the only sector that worked, and less than two weeks ago it traded at 52-week highs. From the high on June 8th through Friday’s close, though, the S&P 500 Energy sector fell over 20%. The only other times since at least 1990 that the Energy sector fell more than 20% in an eight trading day span were in October 2008 and March 2020. While the sector’s 50-day moving average didn’t hold in last week’s plunge, the sector was able to hold support at its late April lows.

In addition to falling over 20% in an eight-day span, the Energy sector’s 17.2% decline last week (5-days) was also one that was surpassed by only a handful of other periods (October 2008, August 2011, and March 2020) since 1990. While declines of last week’s magnitude have been very uncommon, Energy is a volatile sector, and as illustrated in the chart below, there have been a number of periods in the last thirty years when the sector fell 10% or more (red line) in a five-day span.

Of the periods mentioned above where the Energy sector dropped as much as it did in the five days ending last Friday, they were also periods of overall market weakness. To help adjust for broader market moves, the chart below shows the rolling five-day performance spread between the S&P 500 Energy sector and the S&P 500 going back to 1990. Last week marked just the sixth period in the last 30+ years that the Energy sector underperformed the S&P 500 by more than ten percentage points in a five-trading day span. The other periods were April 1999, October 2000, November 2001, October 2008, and March and April 2020. On a side note, one aspect of the chart below that really stands out is how untethered the Energy sector has become relative to the S&P 500. Since 2020, the range of out/underperformance for the sector relative to the S&P 500 has widened out to an unprecedented range.
Separately, given the fact that Energy’s decline occurred as oil prices were only down a bit over 10% from their 52-week high (-11.4%), we were curious to see how far WTI was from 52-week highs following prior five-day periods where the Energy sector experienced massive underperformance. Of the six prior periods, there was only one where crude oil was down less relative to its 52-week high than it was as of last Friday (April 1999). Additionally, the only other time it was down by a similar amount was in October 2000. In the remaining four periods, crude oil prices had already declined significantly relative to their 52-week highs with declines of at least 48% and up to 70%. Click here to learn more about Bespoke’s premium stock market research service.
Bespoke’s Morning Lineup – 6/21/22
See what’s driving market performance around the world in today’s Morning Lineup. Bespoke’s Morning Lineup is the best way to start your trading day. Read it now by starting a two-week trial to Bespoke Premium. CLICK HERE to learn more and start your trial.
“A ship is safe in harbor, but that’s not what ships are for.“ – William Shedd
Below is a snippet of content from today’s Morning Lineup for Bespoke Premium members. Start a two-week trial to Bespoke Premium now to access the full report.
It took a day longer than normal, but at least equity markets are kicking off the week on a positive note. Obviously, where we end up today is an entirely different story. It doesn’t take much to erase a market rally these days, but at least there won’t be much in the way of economic data to derail things. The only two reports on the calendar are the Chicago Fed National Activity Index which was barely positive at +0.01 and was the lowest level since last September and Existing Home Sales which will be released at 10 AM Eastern. On the speaker front, Fed Presidents Mester and Barkin will be speaking this afternoon.
In today’s Morning Lineup, there’s a lot covered as we discuss overnight moves in Asian and European markets, the wild weekend in crypto, political trends in Latin America, and economic reports out of Asia and Europe.
Based on where the tracking ETF (SPY) is currently trading in the pre-market, the S&P 500 is poised to gap up 1.7% to kick off the new trading week. As shown in the chart below, if these gains hold through the opening bell it would be the largest upside gap to kick off a new trading week since “Pfizer Monday” on 11/9/20. While this week’s upside gap is the strongest since November 2020, it follows last week’s downside gap of 2.6% which was the largest downside gap to kick off a week in two years.

Start a two-week trial to Bespoke Premium to read today’s full Morning Lineup.
Bespoke Brunch Reads: 6/19/22
Welcome to Bespoke Brunch Reads — a linkfest of the favorite things we read over the past week. The links are mostly market related, but there are some other interesting subjects covered as well. We hope you enjoy the food for thought as a supplement to the research we provide you during the week.
While you’re here, join Bespoke Premium with a 30-day free trial!
Recession Watch
Housing Market Update: Share of Homes with Price Drops Reaches New High as Mortgage Rates Top 2008 Levels by Tim Ellis (Redfin)
Demand is cratering across the housing market per Redfin data measuring everything from buyer traffic to price cuts to pending sales indicating that surging mortgage rates have buried the housing market. [Link]
It’s hip to be bear: Business leaders join chorus of economic doomsayers by Jason Kirby (The Globe And Mail)
Prognosticators, pundits, strategists, fund managers, and all manner of other market participants are leaning heavily into a negative outlook for stock markets reeling amidst massive global monetary policy tightening and soaring interest rates. [Link; soft paywall]
Hedge Funds
JPMorgan Packed Its Wealthy Clients Into Tiger Global Fund for Private Bets by Sridhar Natarajan, Hema Parmar and Miles Weiss (The Wealth Advisor/Bloomberg)
The most recent fund offered by collapsing hedge fund complex Tiger Global was stuffed full of investments from JPMorgan customers; total investments in Tiger and another similar fund a few months earlier neared $5bn just before the funds cratered. [Link]
Hedge Fund Selling Was Never More Furious Than in Last Two Days by Lu Wang and Melissa Karsh (Yahoo!/Bloomberg)
Goldman Sachs prime brokerage clients in the equity hedge fund space liquidated more equity exposure over two days in the past week than at any point since 2008. The good news, we suppose, is that this kind of liquidation event is often the sort of even that tags market lows rather than the other way around. [Link]
Prices
Why Gas Prices Are So High by Ella Koeze and Clifford Krauss (NYT)
High crude prices and insufficient new production are the most important driver of the surge in prices at the pump that consumers are suffering through this summer. [Link; soft paywall]
Cruise-Line Pricing Is Lost at Sea by Laura Forman (WSJ)
Eye-watering hotel prices are making seaborne trips a lot more attractive, with room rates roughly 10% below what’s on offer from mid-scale hotels. The industry’s rebound might be dependent on consumers biting at the bargain. [Link; paywall]
Plague & Pestilence
Ancient DNA solves mystery over origin of medieval Black Death by Willy Dunham (Reuters)
The discovery of bubonic plague victims who died in 1338 or 1339 are the earliest ever documented from the Black Death pandemic, all but confirming the plague originated in Central Asia and spread to Europe and the rest of Asia via trade routes. [Link]
New Tools Can Make Our Covid Immunity Even Stronger by Deepta Bhattacharya (NYT)
A recap of the new technologies which have boosted COVID immunity, and a proposal for maximizing population immunity long-term, including deploying vaccines through the mouth or nose instead of via a shot. [Link; paywall]
Single beaver caused mass internet, cell service outages in Northern B.C. by Kaitlyn Bailey (CTV)
One pesky beaver got a little bit too interested in the wrong aspen tree and ended up cutting a large swathe of British Columbia off from the internet in the process. [Link]
Crypto
What were all those 6,200 Coinbasers doing anyway? by Alexandra Scaggs (FTAV)
An investigation into the downright perplexing personnel decisions of one of the world’s largest crypto exchanges. [Link; registration required]
Crypto Hedge Fund Three Arrows Capital Considers Asset Sales, Bailout by Serena Ng (WSJ)
One of the largest pools of crypto investment capital has seen positions blown up a scramble for liquidity amidst brutal market conditions across the blockchain. [Link; paywall]
Marriage
Marry Your Like: Assortative Mating and Income Inequality by Jeremy Greenwood, Nezih Guner, Georgi Kocharkov, and Cezar Santos (NBER)
An estimate that assortative mating (that is, marriages that pair people with similar incomes and socioeconomic backgrounds) was responsible for much of the increase in US income inequality over the past half century. [Link; 26 page PDF]
Read Bespoke’s most actionable market research by joining Bespoke Premium today! Get started here.
Have a great weekend!
Bespoke’s Morning Lineup – 6/17/22 – Trying To Go Out On A Positive Note
See what’s driving market performance around the world in today’s Morning Lineup. Bespoke’s Morning Lineup is the best way to start your trading day. Read it now by starting a two-week trial to Bespoke Premium. CLICK HERE to learn more and start your trial.
“We can offer sunshine that glows bright in the afterthought, and scatters the darkness of the tenement for the price of a nickel or a dime.” — L.A. Thompson
Below is a snippet of content from today’s Morning Lineup for Bespoke Premium members. Start a two-week trial to Bespoke Premium now to access the full report.
138 years ago yesterday, the first roller coaster in the United States opened at Coney Island. Called the Switchback Railway, it was invented by LaMarcus Thompson, and in the years since the roller coaster has become a staple of American leisure activities. The one area where we like to avoid them as much as possible is in the financial markets. Unfortunately, investors haven’t been able to dodge them this year. Making matters worse, the last several days have been more like the ride Free Fall than anything else. After all, in order to have a roller coaster, there have to be ups and downs.
Futures are higher heading into the last trading session of the week, and whether they hold into the close is probably a bet many investors wouldn’t take at this point given the tendency to give up gains intraday. We’ll also get some important reports on Industrial Production (9:15), Capacity Utilization (9:15), and Leading Indicators (10:00).
In today’s Morning Lineup, there’s a lot covered as we discuss the latest moves from the BoJ, and overnight economic and market data in Asia and Europe.
We’ve been calling it the one step forward and two steps backward market for some time now, and yesterday and today provides another illustration of that pattern. After rallying over 1% following yesterday’s Fed meeting, the S&P 500 is indicated to open down about 2.0% this morning, more than erasing all of Wednesday’s gains. Keep in mind too, that even after Wednesday’s rally, the trailing five-day performance of the S&P 500 was a decline of just under 8%.
For the second week in a row, the S&P 500 is closing out trading with a decline in nine of the last ten weeks. In the post-WWII period, there have only been three other periods where this has occurred. Besides the fact that all three were lousy market environments, another theme they all have in common is that they all occurred in the middle of recessions. In 1970, the economy was six months from bottoming out, while in March 1982, the economy was more than a half year into a recession and eight months from its trough. Lastly, the period ending in early April 2001 was just one month into a recession that had another seven months left to go.

Start a two-week trial to Bespoke Premium to read today’s full Morning Lineup.