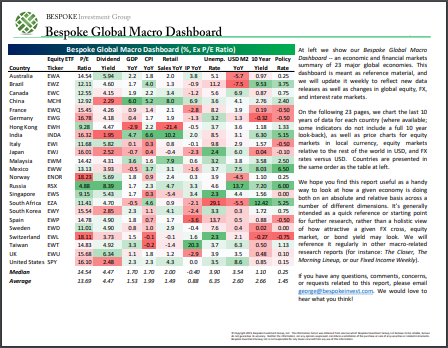
Bespoke’s Global Macro Dashboard — 7/27/22
Bespoke’s Global Macro Dashboard is a high-level summary of 22 major economies from around the world. For each country, we provide charts of local equity market prices, relative performance versus global equities, price to earnings ratios, dividend yields, economic growth, unemployment, retail sales and industrial production growth, inflation, money supply, spot FX performance versus the dollar, policy rate, and ten year local government bond yield interest rates. The report is intended as a tool for both reference and idea generation. It’s clients’ first stop for basic background info on how a given economy is performing, and what issues are driving the narrative for that economy. The dashboard helps you get up to speed on and keep track of the basics for the most important economies around the world, informing starting points for further research and risk management. It’s published the last Wednesday of every month at the Bespoke Institutional membership level.
You can access our Global Macro Dashboard by starting a 14-day free trial to Bespoke Institutional now!
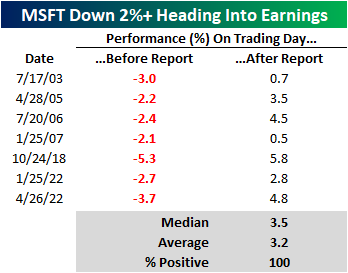
Alphabet and Microsoft Down Headed Into Earnings
Both Microsoft (MSFT) and Alphabet (GOOG) are trading down over 2% heading into their earnings report amidst broader market weakness and wariness towards the tech sector. On a year-to-date basis, MSFT and GOOG are both down over 25% and are trading near their 52-week lows. The charts below show MSFT and GOOG over the last twelve months. On the bright side, the rate of change in the two stocks does appear to have support near current levels. However, they are both still in sustained downtrends. Click here to learn more about Bespoke’s premium stock market research service.

Since GOOG went public in 2004, there have only been four days in which the stock traded lower by two percent or more heading into the earnings report. The latest occurrence was on the day of the Q1 2022 report, which was the only time when it also reacted negatively following the earnings report. On average, the stock has gained 2.5% (median: 2.6%) following the report after trading lower by 2%+ leading into earnings. Historically speaking, GOOG has posted gains on its earnings reaction day 58% of the time, gaining an average of 1.7%. While the average and median returns below are positive, we would note that with just four occurrences the sample size is small.

Since October of 2001 (which is as far back as our earnings database goes), MSFT has traded lower by at least two percent in the session heading into an earnings report seven times. Again, the sample size is relatively small, but following every one of these prior occurrences, MSFT gained in the session following its earnings report, booking an average gain of 3.2% (median: 3.5%). For all earnings reports since October of 2001, MSFT has reacted positively to earnings 60% of the time. Click here to learn more about Bespoke’s premium stock market research service.
Demand Decimation Out of Dallas
Manufacturing data has continued to cool with the Dallas Fed’s monthly survey showing further deterioration in the month of June. The reading on General Business Outlook dropped another 4.9 points month over month to -22.6; the worst reading since the spring of 2020. Expectations are similarly at some of the lowest levels in over two years, but July did see a modest rebound.

The individual categories of the report were mixed. While most remain in expansionary territory, some of the more important categories like New Orders are in deep contraction. The month-over-month moves were even more mixed as just over half of the components fell. As we have seen across other regional Fed reports recently, expectations broadly sit at much more depressed levels, although July did see some big rebounds across categories.

Even though demand has slowed, production expanded at a slightly accelerated rate in July. At only 3.8, though, the index is in the bottom quartile of its historical range and capacity utilization is only slightly stronger.

Manufacturers reported the worst slowdown in demand since the spring of 2020 as the index for New Orders fell to -9.2. The 1.9 point sequential decline was actually much smaller than the 10.5 point and 8.9 point declines in June and May, respectively, however that nonetheless expresses demand has been weakening materially. As new demand is a fraction of what it once was, Unfilled Orders experienced a peculiarly large uptick of 14.9 points. That ranks in the top 2% of all monthly moves on record resulting in the index to flip from a historically weak to a more solid reading.
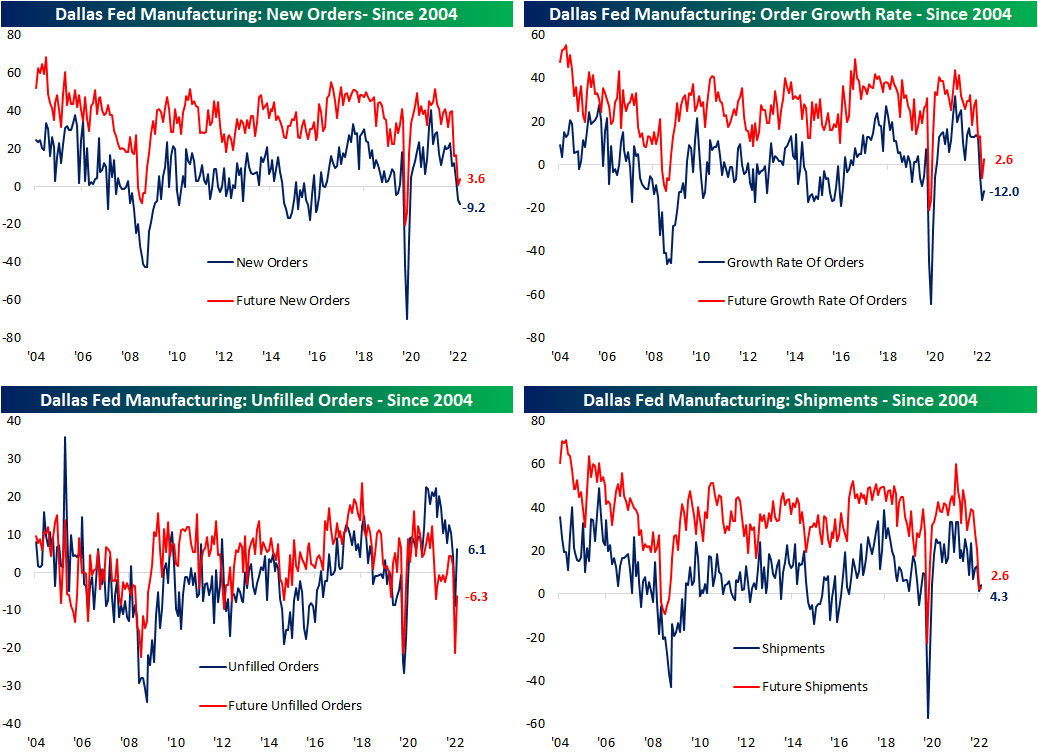
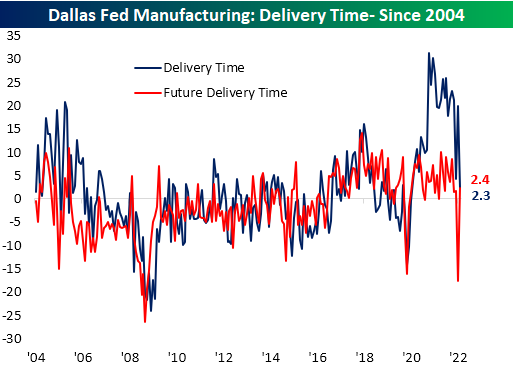
The Dallas Fed report added to the list of indicators pointing to alleviation on the supply chain front as well. The Delivery Times index experienced its second-largest one-month decline on record. Even though that brings the index to a barely expansionary level, the move heavily contrasts with expectations. Future Delivery Times recorded the largest month-over-month gain on record. Given that reading brings the index only to 2.4, it does not mean manufacturers expect delivery times to begin to surge to unprecedented levels as they did earlier in the pandemic. Rather, they no longer expect the rapid improvement that has been observed over the past several months.
As for other metrics that have fallen off a cliff, likely thanks to the easing of supply chain bottlenecks, both Prices Paid and Received are plummeting across both current and future conditions.

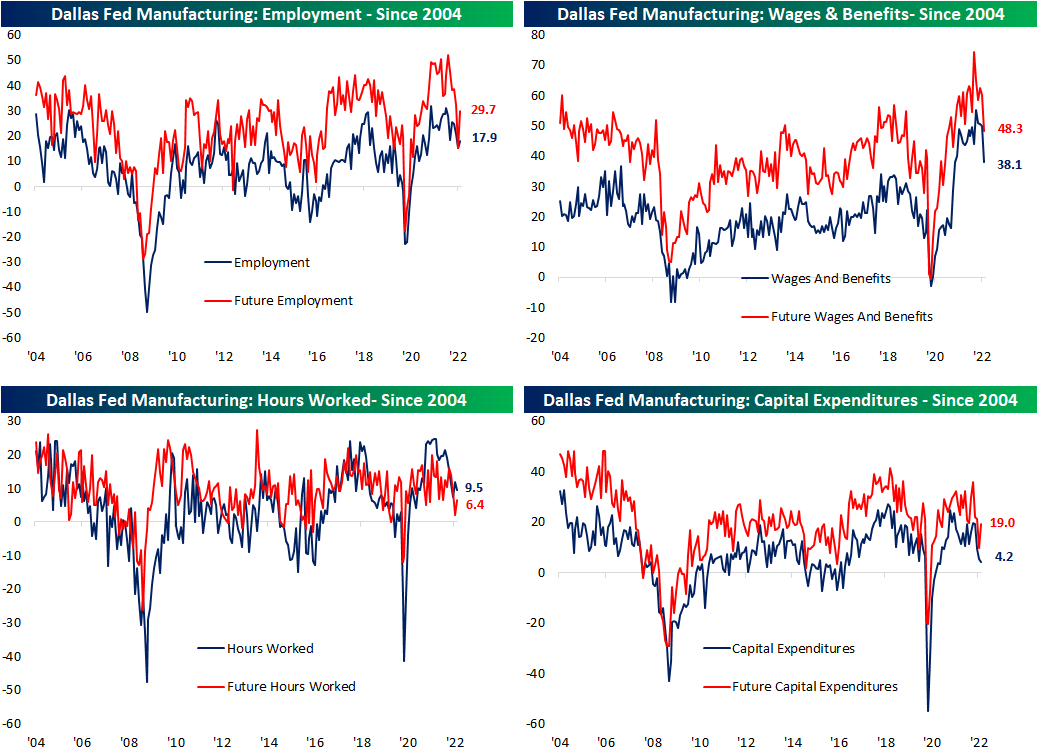
In addition to the decline in prices paid and received, the indices tracking the growth of wages and benefits has also been pulling back sharply. Both current conditions and future expectations saw some of their largest one-month declines on record, although, at current levels, they remain more elevated within their historical range than prices paid and received. The employment index peaked well over one year ago, but it has not experienced that same sharp decline as wages in benefits. In fact, there was a modest rise in the reading in July meaning firms increased hiring at an accelerated rate. Contrasting with that higher spending on employment, the capital expenditures index has been consistently grinding lower with this month marking the fourth monthly decline in a row, and at 4.2, it has fallen to the lowest level since October 2020. Click here to learn more about Bespoke’s premium stock market research service.
4th Longest Streak of Declines in Prices at the Pump
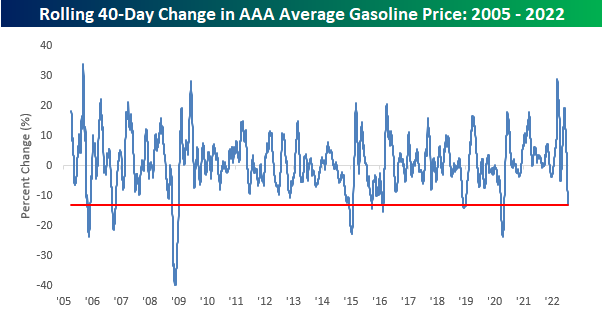
The price of a gallon of gas, while still up YTD and relative to most other periods in the past, has pulled back considerably and consistently over the last six weeks. While a gallon of gas topped $5 in early to mid-June, over the weekend, the average price was back down to $4.36. The decline in prices has also been consistent as prices have now declined for 41 straight days. Going back to 2005, when AAA began tracking the daily national average price, this current streak now ranks as the fourth-longest on record after surpassing the 39-day streak from September 2006 over the weekend. In order for this current streak to move into the top three and oust the 62-day streak from the COVID crash, we’ll need to see another three weeks of daily declines, and in order to move into first place overall, we’d need to see the current streak nearly triple in length to 118 days and stretch out to early October!

While the current streak of declines is the fourth-longest on record, the magnitude of gasoline’s decline over the last 40 days hasn’t been quite as extreme. At -13%, there have been seven other periods where average prices at the pump experienced a larger decline over the same time period. What is notable, however, is that back in March the 40-day rate of change was the second highest on record trailing only the 33% increase that came in the wake of Hurricane Katrina in September 2005.
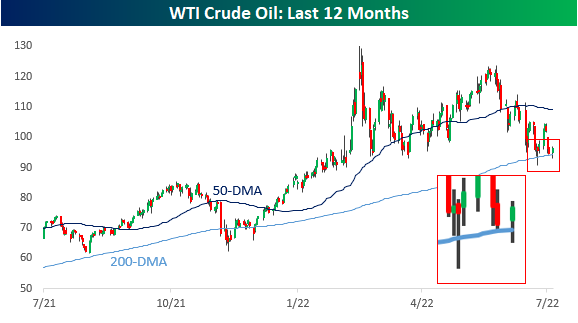
In order for prices at the pump to keep declining, we’re going to need oil prices either to stay around current levels or continue declining. Oil prices have obviously been weak for the last month or so, but over the last two weeks have shown some stabilization above the 200-DMA, including two different days when the price dropped below the 200-DMA intraday but bounced. If the 200-DMA holds in the near-term, gas prices are likely to stop declining, so this will be a key level to watch for what will ultimately determine the health of the consumer. Click here to learn more about Bespoke’s premium stock market research service.
Bespoke Brunch Reads: 7/24/22
Welcome to Bespoke Brunch Reads — a linkfest of the favorite things we read over the past week. The links are mostly market related, but there are some other interesting subjects covered as well. We hope you enjoy the food for thought as a supplement to the research we provide you during the week.
While you’re here, join Bespoke Premium with a 30-day free trial!
Human Resources
The job market is beginning to show cracks by Abha Bhattarai and Lauren Gurley (MSN/WaPo)
As financial markets take a header, spending on high-end goods and services is starting to slow and the result is a weaker job market; layoffs are also being announced across mortgage lenders, auto manufacturers, convenience stores, and more. [Link]
With Few Able and Fewer Willing, U.S. Military Can’t Find Recruits by Dave Philipps (Yahoo!/NYT)
Enlistments have plunged thanks to COVID-19, strong labor markets, and less cultural interest in the military, leading to higher enlistment bonuses and more aggressive recruiting tactics. [Link]
Cost of Living
People Are Losing It Over These $90 Chicken Tenders In Montauk… (Guest of A Guest)
Hamptons life has always been an expensive proposition, but one menu item in a Montauk haunt caught social media attention this week as a particularly egregious bit of price gouging. [Link]
Inflation for Americans at each age (USA Facts)
A fascinating infographic that re-weights CPI to show how inflation impacts people with different ages, since consumer spending patterns vary across the age spectrum. [Link]
America’s favorite family outings are increasingly out of reach by Zachary Crockett (The Hustle)
Widely-accessible leisure activities that used to be par for the course are now completely out of reach for most families: baseball games, movies, and Disneyland trips have all more than doubled in cost. [Link]
Life Science
Blots On A Field? By Charles Piller (Science)
A short seller-funded tear-down of groundbreaking science tying protein plaques to Alzheimer’s disease has turned out to be little more than a mirage and may even rise to the level of fraud. [Link]
New York reports 1st US polio case in nearly a decade by Mike Stobbe (AP)
An unvaccinated person has been paralyzed by the polio virus in New York, with the virus originally coming from a live-virus vaccine that is not available in the United States and must have been transmitted to the patient by someone visiting the US. [Link]
‘Holy grail’ of blood tests could diagnose any type of cancer years in advance (Study Finds)
Many cancers appear to release a protein marker in the early stages of a tumor’s development, when the disease is much easier to treat. [Link]
Politics
A guide to Chile’s constitutions, old and new by Ana Lankes (Medium)
Chile’s constitution has been re-written and will go to a plebiscite later this year. Some history on why the re-write took place and how it looks like it might fare in the approval vote. [Link]
Black Districts Gutted as Suburban Flight Reshapes Congress Maps by Gregory Korte (Bloomberg)
Once a staple of multiracial democracy in the United States, majority-Black Congressional districts have started to disappear in the wake of the Supreme Courts paring-back of the Voting Rights Act. [Link; soft paywall]
Energy
BlackRock Is Buying Renewable Natural Gas Producer for $700 Million by Amrith Ramkumar (WSJ)
While natural gas produced from manure and food waste is still expensive, the market is growing as investors and customers look for gas that is produced from a closed loop rather than extracted from the ground. [Link; paywall]
Sizewell C nuclear plant gets go-ahead from government (BBC)
The UK is moving to expand existing nuclear facilities in Suffolk, with French utility Electricite de France leading the project which will cost tens of billions and see 3.2 GW of electricity supplied with a useful life of 60 years. [Link]
The curious incident of the gas and the turbines by Alexandra Scaggs (FT Alphaville)
A fascinating dive into a financial markets rumor that spread like wildfire and proved to be deeply misleading in terms of actual government policy. [Link; registration required]
Weird News
Final DIY Project: Build Your Own Coffin by James R. Hagerty (WSJ)
It’s one thing to pick your coffin out before you go, but entirely another to build it by hand and have it ready when you kick off this mortal coil. [Link; paywall]
JPMorgan Trader Spoofed So Fast Colleagues Urged Ice on Fingers by Eddie Spence (Bloomberg)
A trader working at Bear Stearns and JPMorgan in the 2000s reportedly spoofed orders so aggressively that colleagues suggest he ice down his hand. [Link; soft paywall]
Media
Media Confidence Ratings at Record Lows by Megan Brenan (Gallup)
Gallup’s tracking of confidence in newspapers and television news has fallen to record lows over the last few years, with only 11% of people reporting “a great deal” or “quite a lot” of confidence in television and 16% for newspapers. [Link]
Read Bespoke’s most actionable market research by joining Bespoke Premium today! Get started here.
Have a great weekend!
Charts of the Week from Bespoke — 7/22/22
Below are some of our favorite charts from our work this week. Try Bespoke’s premium research service today to receive our unique stock market charts and analysis in your inbox daily. Click here to start a one-month trial now!
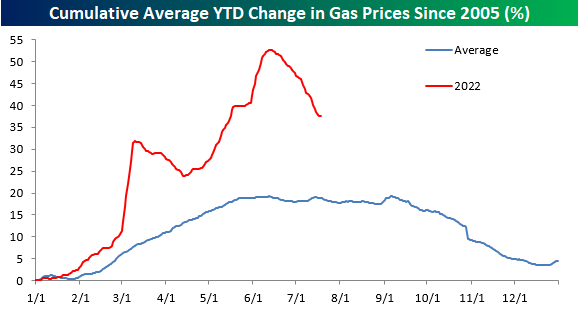
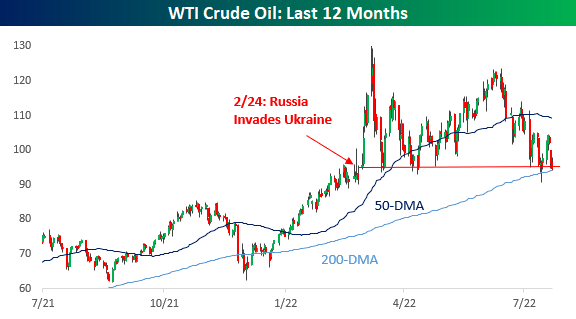
We started the week noting the steep drop in gas prices that we’ve seen from highs made in mid-June. While gas prices are indeed down, they’re still up much more than usual year-to-date. From a seasonal perspective, this is normally a time of year when gas prices are trending lower, so this year’s drop is not out of the norm. In the chart below, the red line shows this year’s change in gas prices, while the blue line shows the average pattern that gas prices have taken throughout the year going back to 2005.
Gas prices are of course driven by the price of crude oil, and in Friday’s Morning Lineup, we noted that crude oil prices have now fallen back to the level they were at when Russia launched its invasion of Ukraine back in late February:
On Wednesday we wrote about weekly mortgage data that continues to show steep drops in activity. As shown below, with mortgage rates rising sharply to levels not seen in more than a decade this year, refinancing activity has fallen to its lowest level since November 2000!

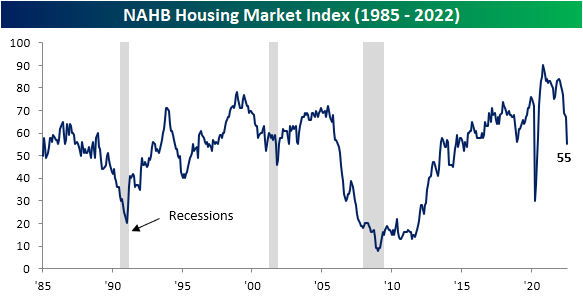
Less activity and much higher costs have caused homebuilders to sour on housing. As we noted in a post on Monday and as shown below, the NAHB’s housing market sentiment index has fallen sharply in recent months to its lowest level since May 2020 just after the pandemic began.
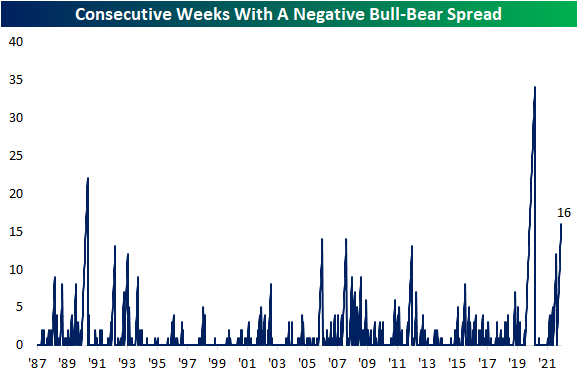
There’s plenty of negative sentiment to go around throughout both the economy and the investment community. In our weekly post on investor sentiment, we highlighted the chart below that shows streaks of weeks where there have been more bears than bulls in the weekly American Association of Individual Investors survey. At 16 consecutive weeks, this is the third longest streak over the past 35 years!

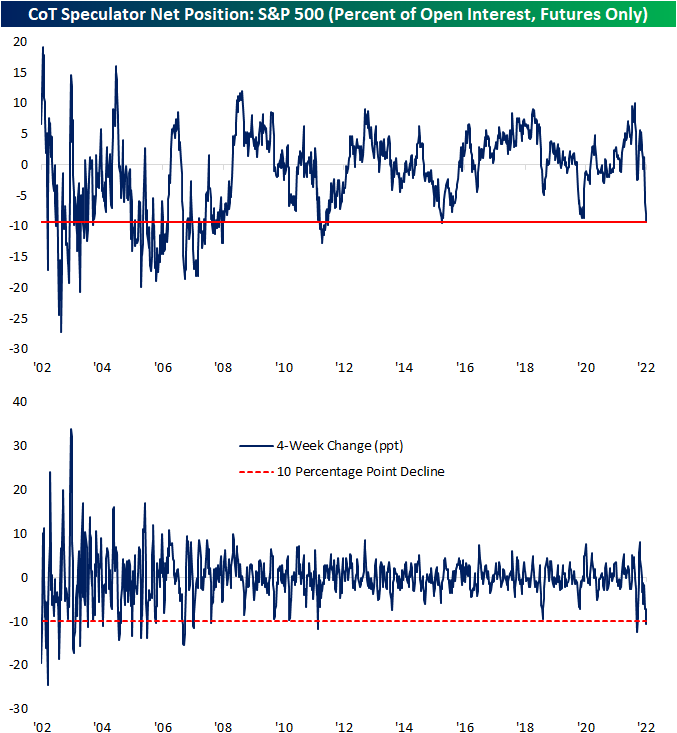
We publish detailed analysis of the CFTC’s weekly Commitment of Traders report in our Closer report every Monday (the Closer is only available to Bespoke Institutional subscribers). The Commitment of Traders report shows how long or short futures traders are on various asset classes based on their positions in the futures market. As shown below, speculator positioning recently turned extremely bearish on the S&P 500. These types of indicators are typically viewed from a contrarian lens, but you can read more about this specific indicator in our blog post from earlier in the week.
In good news, the “prices paid” component of this month’s Philadelphia Fed Manufacturing survey saw another sharp drop for July. While it’s still elevated, this inflation reading has fallen sharply since peaking in April, and signs that inflation has peaked are a key reason why stocks have managed to bounce a bit over the last month or so. You can read more about this month’s Philly Fed report in our post on the subject from Thursday.

Our Morning Lineup is one of our most popular reports for subscribers. We’re biased, but we think it’s the best daily pre-market report in existence! (See for yourself with a one-month Bespoke Premium trial.) The chart below was highlighted in our Morning Lineup on Wednesday after the Nasdaq ended a streak of over 60 trading days below its 50-day moving average. Since the Nasdaq was created in the early 1970s, there have only been 18 other streaks of 60 or more trading days below the 50-DMA. It’s not common, but at least it’s over!

As we close out another hot summer trading week, below is a look at where key US index ETFs stand in their “trading ranges” after the recent surge we’ve seen for stocks. Usually, after an ETF sees a gain of more than 5% in a one-week span, it’s trading well into “overbought” territory. But given how depressed the US stock market had gotten heading into July, most of the index ETFs we follow are still trading in “neutral” territory.
Bespoke Premium and Institutional subscribers can use our interactive Trend Analyzer tool that looks similar to the graphic below. It’s helpful for monitoring indices, sectors, stocks, baskets of stocks, and custom portfolios. We also cover the concept of “overbought” and “oversold” in our work regularly, so if you’d like to learn more about how we monitor price movements, start a one-month Premium trial today!
Later today we’ll be sending subscribers our weekly Bespoke Report newsletter, so be on the lookout for that in your inbox if you’ve already signed up for your trial. We hope you have a great weekend!

The Bespoke 50 Growth Stocks — 7/21/22
The “Bespoke 50” is a basket of noteworthy growth stocks in the Russell 3,000. To make the list, a stock must have strong earnings growth prospects along with an attractive price chart based on Bespoke’s analysis. The Bespoke 50 is updated weekly on Thursday unless otherwise noted. There were no changes to the list this week.
The Bespoke 50 is available with a Bespoke Premium subscription or a Bespoke Institutional subscription. You can learn more about our subscription offerings at our Membership Options page, or simply start a two-week trial at our sign-up page.

The Bespoke 50 performance chart shown does not represent actual investment results. The Bespoke 50 is updated weekly on Thursday. Performance is based on equally weighting each of the 50 stocks (2% each) and is calculated using each stock’s opening price as of Friday morning each week. Entry prices and exit prices used for stocks that are added or removed from the Bespoke 50 are based on Friday’s opening price. Any potential commissions, brokerage fees, or dividends are not included in the Bespoke 50 performance calculation, but the performance shown is net of a hypothetical annual advisory fee of 0.85%. Performance tracking for the Bespoke 50 and the Russell 3,000 total return index begins on March 5th, 2012 when the Bespoke 50 was first published. Past performance is not a guarantee of future results. The Bespoke 50 is meant to be an idea generator for investors and not a recommendation to buy or sell any specific securities. It is not personalized advice because it in no way takes into account an investor’s individual needs. As always, investors should conduct their own research when buying or selling individual securities. Click here to read our full disclosure on hypothetical performance tracking. Bespoke representatives or wealth management clients may have positions in securities discussed or mentioned in its published content.
Philly Fed Collapsing
Tacking on to the list of weaker than expected US economic releases this morning was a big drop in the Philadelphia Fed’s Manufacturing Business Outlook Survey. After a contractionary -3.3 reading last month, forecasts were calling for the headline number to rise back into expansion. Instead, it posted an even larger decline down to -12.3; the lowest reading since May 2020. Expectations have been even worse. That month-over-month decline in July ranked in the bottom decile of all monthly moves in the history of the survey dating back to 1968. Even more depressing, the low level reached is the worst reading since December 1979.

Given the huge drop in the headline index, breadth left much to be desired this month. The categories are almost evenly split between those in contraction and expansion while there is also a wide dispersion between where each category stands relative to their respective ranges. For example, while New Orders has become very depressed – only in the 3rd percentile of all months after the double digit month over month decline in July – the index for Number of Employees has held up relatively well in the 93rd percentile. The whole of the report paints a fairly dour outlook for the region’s manufacturing economy, but expectations are broadly weaker than current conditions with multiple categories reaching new record lows.

As previously mentioned, New Orders is the weakest current conditions index. The reading fell from -12.4 to -24.8 in the past month. Prior to the spring of 2020, the last time this index was as low was during the Global Financial Crisis era. Expectations are even worse. Last month’s decline was much more severe at 23.5 points versus 5 points in July, however, the continued drop has brought the index to the lowest level since September 1979. Although demand has slumped, Shipments actually accelerated with the current conditions index slightly below median while expectations saw a large 9.2 point MoM jump. Unfilled Orders expectations similarly moved higher versus last month but that was only a more modest bounce as the index remains in the bottom 1% of all months. Current Conditions are more modestly in contraction in the 27th percentile after falling another 3.4 points in July.

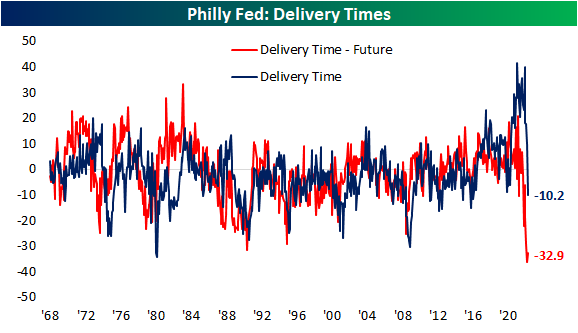
One of the most striking changes over the past few months has been in regards to supply chains. Higher readings in the Delivery Times index indicate that manufacturers are seeing products taking longer to reach their destinations and vice versa for lower readings. Throughout the pandemic, this index sat at unprecedentedly high levels. All of that has been reversed now, though, as Delivery Times moved from expansion into contraction. Not only are delivery times now falling, but the July reading was the lowest reading since May 2016. In other words, on net, a larger share of respondents are seeing declines rather than increases in how long it takes for products to be delivered. Meanwhile, expectations are at the extreme low end of their historical range, coming slightly off last month’s record low. All that is to say supply chains are seeing massive improvements to stress as demand rapidly cools.
Prices have also been experiencing a sharp reversal with Prices Paid at the lowest level since January of last year and Prices Received at the lowest level since last March. Click here to learn more about Bespoke’s premium stock market research service.

Third Longest Streak of Negative Bull-Bear Spread on Record
Last week, over a quarter of respondents to the AAII sentiment survey reported bullish sentiment for the first time in over a month. As the S&P 500 has made a considerable move to the upside, bulls have continued to come back this week rising to 29.6%. The percentage of respondents reporting as optimistic has now come back within one standard deviation of its historical average and is at the highest level since the first week of June.
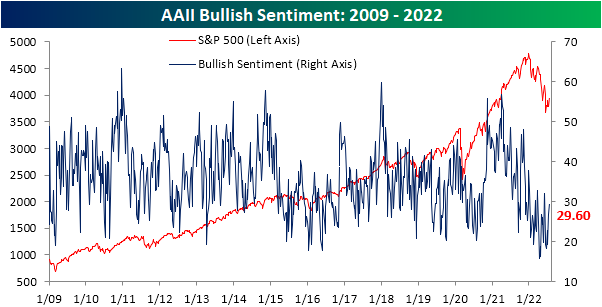
Bearish sentiment has fallen in lockstep with the increase in bullish sentiment. After coming in at over 50% two weeks ago, the reading has shed 10.6 percentage points. Albeit improved, bearish sentiment remains well above the historical average and the double-digit two-week decline is actually the seventh of the year. In other words, the sharp drop in bearish sentiment is not exactly unusual compared to other moves this year as it still has further to go until it reaches a more “normal” level.

Regardless, with inverse moves in bulls and bears the bull-bear spread has risen to -12.6. That is the highest reading since the first week of June and, as shown in the second chart below, the 16th consecutive week with bears outnumbering bulls. Clearing two other streaks from the early 2000s, that is now the third longest streak on record behind the 22 and 34-week-long streaks ending in December 1990 and October 2020, respectively.

Not all of the losses to bears went to bulls. Neutral sentiment also rose this week rising to 28.2% from 26.6% last week. That is the highest level in three weeks as neutral sentiment has generally been less volatile than bulls and bears recently. Click here to learn more about Bespoke’s premium stock market research service.

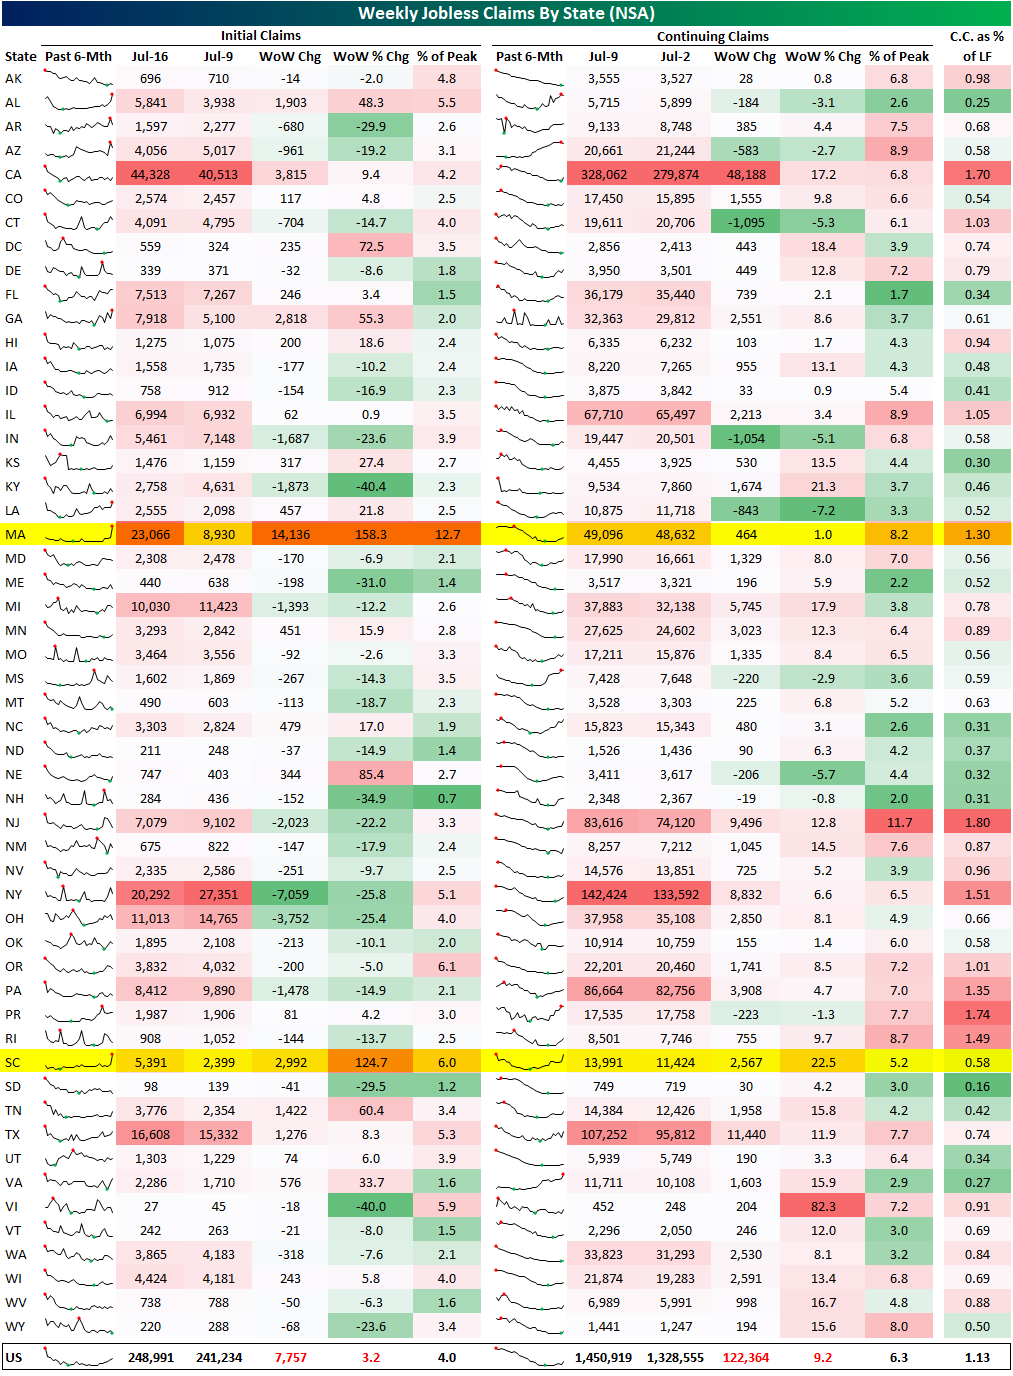
Claims Rise With Single State Surges
Jobless claims have undergone further deterioration in the latest week’s data as the seasonally adjusted number topped 250K for the first time since November, and it has now been over four months since the cycle low. As we discussed in a B.I.G. Tips report earlier, that streak without a new low in claims is not particularly long from a historical standpoint, but it is notable when taking into account past increases in claims prior to recessions. While last week’s reading went unrevised, this week’s reading rose 7K to 251K which is 85K above the early April low.

On a non-seasonally adjusted basis, claims were also higher rising 7.9K to 249K. As we have frequently noted, while adjusting for seasonality claims have reversed trend and have been moving higher during a time of year when they typically rise. Historically, last week would have marked the high, although, that has not always been the case. For example, in 2010 and 2011, and potentially again this year, the seasonal high came during the current week of the year instead. In other words, the continued move higher in claims this week on a non-seasonally adjusted basis is somewhat unusual but not without precedent. While that increase could be on account of residual seasonality, it is hard to parse if it is also potentially on account of the material worsening in claims.

Delayed an additional week to the initial claims number, seasonally adjusted continuing claims jumped 51K this week. While that is not exactly a massive jump, bringing claims only to the highest level since April, the week-over-week increase was the largest uptick since late November.

Below we provide a state-level breakdown of the initial and continuing claims numbers (both non-seasonally adjusted). While there are likely some seasonal factors playing into week-to-week movements, this week there were two unusual moves weighing on the national number. Whereas the net national move in claims was an increase of 7.8K, Massachusetts saw a move nearly double the size of that national change. That state’s initial claims went from under 9K all the way up to 23K; the ninth largest weekly increase on record going back to 1986. While less remarkable of a move but also ranking in the top decile of all periods, South Carolina also saw a peculiar increase with claims more than doubling. While these readings could very well be genuine, we would caution that given their outlier nature, a revision down the road is possible, and that would make this week’s release look somewhat better after revisions than it does today. That being said, revisions likely would not be enough to alter the overall national trend in recent months. Click here to learn more about Bespoke’s premium stock market research service.