August Firearm Background Checks
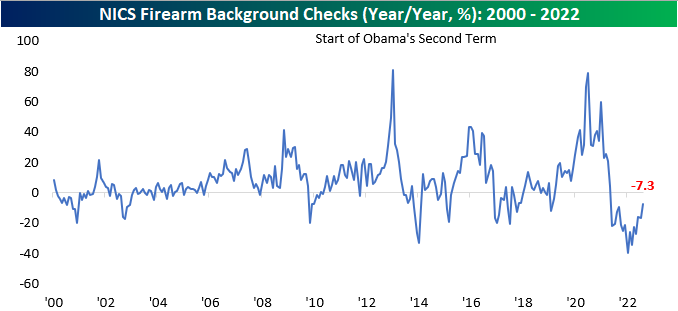
Although not a widely-utilized indicator, we like to look at the number of firearm background checks conducted by the NICS every month to gauge geopolitical uncertainty and volatility within the US. In uncertain times, firearm background checks tend to increase, as individuals increasingly acquire the means to protect themselves in a worst-case scenario. On the contrary, when times are ‘good’, background checks tend to decline. An additional factor that impacts background checks is the outlook on firearms legislation. When the populous fears that they may not be able to purchase certain firearms in the future, they will step up purchases in the short term to ‘stock up’.
At the end of June, the Supreme Court issued a ruling that expanded gun rights, prohibiting certain restrictions on carrying. This may have contributed to the rise in background checks this month, but there are other factors that likely contributed as well. Democrats are now expected to retain control of the Senate according to betting markets, and the Biden administration has proven their ability to enact legislation, so Americans may be worried about further gun control legislation. Additionally, the FBI’s raid of former President Trump’s Mar a Lago home could have added to the perception of domestic political instability. Click here to learn more about Bespoke’s premium stock market research service.
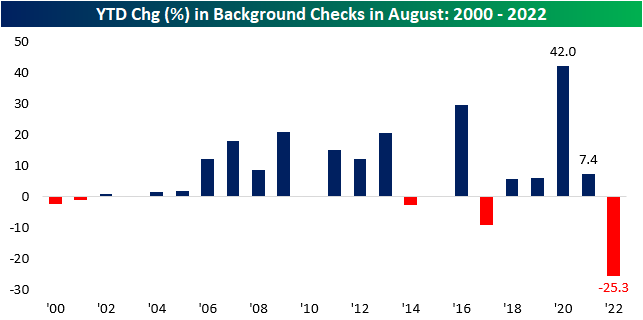
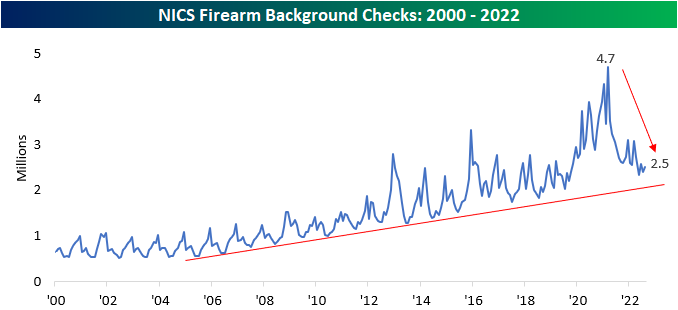
Although background checks rose by 4.7% month over month, they are still down 7.3% y/y. This is largely due to tough comps, as heightened geopolitical uncertainty and volatility in 2020 and 2021 led to extreme increases in background checks. We are now essentially out of the COVID-era, the Russia-Ukraine conflict is no longer top of mind for Americans, and the questioning of 2020 election results appears to be a thing of the past, and a more relaxed state of affairs has led to declines throughout 2022. However, the rate of decline has been leveling out. Through August, the number of background checks on a YTD basis has declined by 25.3%, but the y/y decline of just 7.3% for the month tells us that we have likely already experienced the largest declines in background checks on a percentage basis. It would not be unreasonable to expect checks to rise as we head into midterm elections.
Background checks are still in a longer-term uptrend. At 2.5 million, August’s figure ranks in the top 15.1% of all months since NICS began reporting this data in 1998, and outside of late 2019 through 2021, there were only a few months that the number of checks was higher. Still, they are down 46.3% from the all-time highs seen in March 2021. This may be because demand was pulled forward, but it could also be due to a more normalized domestic situation. Click here to learn more about Bespoke’s premium stock market research service.
Sturm Ruger (RGR) and Smith & Wesson (SWBI) are the two publicly traded stocks with direct exposure to these trends. Historically speaking, the monthly performance of these stocks tends to be correlated to the trailing twelve-month volume of background checks. Although background checks rose month over month, the near-term downtrend persists in checks, which is following through to the performance of these two stocks. Over the last month, RGR and SWBI are down 20.7% and 4.8%, respectively. Click here to learn more about Bespoke’s premium stock market research service.

Bespoke’s Morning Lineup – 9/2/22 – Jobs Day to Labor Day
See what’s driving market performance around the world in today’s Morning Lineup. Bespoke’s Morning Lineup is the best way to start your trading day. Read it now by starting a two-week trial to Bespoke Premium. CLICK HERE to learn more and start your trial.
“I’m just opposed to a pure inflation-only mandate in which the only thing a central bank cares about is inflation and not employment.” – Janet Yellen

Below is a snippet of content from today’s Morning Lineup for Bespoke Premium members. Start a two-week trial to Bespoke Premium now to access the full report.
It’s understandable that the Friday before Labor Day is quiet as people look to get the most out of the last unofficial summer weekend, but the ‘flatness’ in futures is pretty remarkable given the volatility this week. The fact that it’s an employment report Friday makes the tranquility even more notable. Tune in at 4 PM to see if it lasts the entire day. Heading into this Friday’s report, the Non-Farm Payrolls report has been stronger than expected for four straight months, and the only other time in the last 25 years that it had a longer streak of beating expectations was in September 2020 when the August report topped estimates for a fifth straight month.
Outside of equities, energy is mixed with crude oil trading about 2% higher while nat gas is down over 3% and below $9/mmbtu. Treasury yields are modestly lower, but the 10-year yield is still at 3.25%.
The equity market had a pretty impressive reversal yesterday helping the S&P 500 to avoid a five-day losing streak following Fed Chair Powell’s hawkish speech in Jackson Hole last Friday. The rebound wasn’t enough to push the Nasdaq into positive territory for the day, although it did finish well off the intraday lows. Semis also managed to bounce, but the Philadelphia Semiconductor Index (SOX) still finished down over 1% on the day. Not only was it the 5th straight day of losses for the SOX, but it was also the 5th straight decline of 1% or more, a streak in which it has dropped more than 11%.
The current losing streak for the SOX ranks as the longest run of 1%+ daily declines since January 2016 and just the 12th such streak in the index’s history. Of those prior eleven, just three went on to last a sixth day and none extended to seven. Just as we noted in a post yesterday how the magnitude of the decline in reaction to Powell’s Jackson Hole speech ranked on the extreme side relative to history, losing streaks like the one the SOX is in (or hopefully on the tail end of) right now have been uncommon over time.

Our Morning Lineup keeps readers on top of earnings data, economic news, global headlines, and market internals. We’re biased (of course!), but we think it’s the best and most helpful pre-market report in existence!
Start a two-week trial to Bespoke Premium to read today’s full Morning Lineup.
Bespoke’s Consumer Pulse Report — September 2022
The Bespoke 50 Growth Stocks — 9/1/22
The “Bespoke 50” is a basket of noteworthy growth stocks in the Russell 3,000. To make the list, a stock must have strong earnings growth prospects along with an attractive price chart based on Bespoke’s analysis. The Bespoke 50 is updated weekly on Thursday unless otherwise noted. There were no changes to the list this week.
The Bespoke 50 is available with a Bespoke Premium subscription or a Bespoke Institutional subscription. You can learn more about our subscription offerings at our Membership Options page, or simply start a two-week trial at our sign-up page.

The Bespoke 50 performance chart shown does not represent actual investment results. The Bespoke 50 is updated weekly on Thursday. Performance is based on equally weighting each of the 50 stocks (2% each) and is calculated using each stock’s opening price as of Friday morning each week. Entry prices and exit prices used for stocks that are added or removed from the Bespoke 50 are based on Friday’s opening price. Any potential commissions, brokerage fees, or dividends are not included in the Bespoke 50 performance calculation, but the performance shown is net of a hypothetical annual advisory fee of 0.85%. Performance tracking for the Bespoke 50 and the Russell 3,000 total return index begins on March 5th, 2012 when the Bespoke 50 was first published. Past performance is not a guarantee of future results. The Bespoke 50 is meant to be an idea generator for investors and not a recommendation to buy or sell any specific securities. It is not personalized advice because it in no way takes into account an investor’s individual needs. As always, investors should conduct their own research when buying or selling individual securities. Click here to read our full disclosure on hypothetical performance tracking. Bespoke representatives or wealth management clients may have positions in securities discussed or mentioned in its published content.
Jackson Hole’s Increasing Importance
While the conference has been going on for decades now, the Kansas City Fed’s annual Jackson Hole Symposium has taken on increased importance and attention ever since the Financial Crisis as clues to future policy shifts have often been floated during the conference. Heading into this year’s conference and Powell’s speech last Friday, anticipation was extremely high. While markets weren’t expecting the Chair to say anything dovish, they were surprised by the directness and brevity of the speech in that the Fed would be hiking rates and it would likely cause pain for the markets and economy. Since that eight-minute speech last Friday, the reaction in markets has been swift. The chart below shows the S&P 500’s performance from the Thursday close during the Jackson Hole conference (the day before the Chair typically speaks) to the following Thursday. With this year’s decline of 5.5%, the market’s reaction this year now ranks as the second most negative since at least 1994, falling short of just 1998 when the S&P 500 declined by 5.8%. Click here to learn more about Bespoke’s premium stock market research service.

As mentioned above, the annual Jackson Hole conference has taken on added importance in recent years, so much so that anticipation of the conference is usually just as high or even higher than what we tend to see ahead of FOMC policy meetings. With that in mind, we wanted to see how this year’s decline following the Jackson Hole speech compares to market reactions to prior FOMC meetings. The chart below shows the historical one-week performance of the S&P 500 following all scheduled and unscheduled FOMC meetings since 1994 with the red line indicating the S&P 500’s performance in the week following this year’s Jackson Hole meeting. The S&P 500’s decline over the last week in response to Powell’s direct message ranks as more severe to the downside than only four other meetings since 1994 (two in March 2020, December 2018 and September 1998). Again, the reason for the market’s swift response has been Powell slamming the door shut for any hints of an upcoming Fed pivot and even referencing Paul Volcker by name when he discussed the importance of keeping inflation in check. That has led the market to price in sustained levels of higher rates, which disproportionately impacts growth and speculative stocks.

Bears Back Above 50%
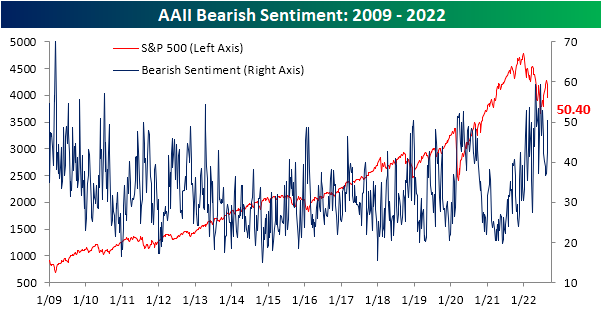
In the wake of Jackson Hole and more hawkish than previously expected Fedspeak, the S&P 500 is on pace for its worst week since June. As a result, recent improvements in investor optimism have been entirely given back. The AAII survey of individual investors saw only 21.9% of respondents report as bullish this week. That is the worst reading in two months as the back-to-back declines over the past two weeks total 11.4 percentage points.

That was matched with a considerable increase in bearish responses. For the first time since early July, over half of respondents reported a pessimistic outlook for equities. Bearish sentiment’s eight percentage point week-over-week increase was the largest since mid-June and the third weekly increase in a row.
The inverse moves of bullish and bearish sentiment resulted in the bull-bear spread to quickly move down to the worst level since the start of July. That follows a string of readings only a couple of weeks ago in which bears outnumbered bulls by only single digits.

Given the reversal in the spread, the streak of negative readings presses on. Now at 22 weeks long, it ties the 1990 streak for the second longest on record.

The AAII survey was not alone in showcasing a much more pessimistic tone of investors. Both the NAAIM Exposure Index and the Investors Intelligence survey also pivoted to more bearish readings. Combining these three results, the average reading on sentiment has fallen back to more than one standard deviation below the historical norm. Although that is not as pessimistic of an aggregate sentiment reading as earlier this year, there have only been a handful of other times going back to the mid-2000s in which the investment community had as negative of an outlook towards the equity market. Click here to learn more about Bespoke’s premium stock market research service.

Bespoke Market Calendar — September 2022
Please click the image below to view our September 2022 market calendar. This calendar includes the S&P 500’s average percentage change and average intraday chart pattern for each trading day during the upcoming month. It also includes market holidays and options expiration dates plus the dates of key economic indicator releases. Click here to view Bespoke’s premium membership options.

Just Another Average Year for Prices At the Pump
Or should we say a below-average year? This summer has been quite an interesting one for American drivers. After a record surge earlier this year, the national average price of a gallon of gas, according to AAA, has retraced much of its increase. During August alone, the national average price declined 9.1%, which was the largest August decline since at least 2005 compared to an average August decline of 0.27%. Even more notable is that with a YTD increase of 16.5%, this year’s increase now ranks below the historical average of 18.0% (median: +14.2%). Before we all start leaving our cars running while running into 7-11 for a Slurpee, we would note that prices are still extremely high. At a national average price of $3.83 per gallon, we haven’t seen prices this high at the end of August since 2012.

The chart below compares the YTD change in the national average price of a gallon of gas this year to the average YTD change since 2005. Could you have ever imagined back in mid-June, when prices were up over 50% YTD, that by the end of August prices would be up less than average?

Earlier, we noted that prices have been trending steadily lower for several weeks now. The current streak of daily declines now ranks as the second longest since at least 2005. Similarly, the chart below shows the number of days by year that average prices increased during the June, July, and August summer months. Since the start of June, there were only 13 days when the national average price increased, and they were all in early June. Since then, prices have been lower every day. The only years with fewer positive days during the summer months were 2007 and 2016. Since July 4th, this was also the first year that prices were down every day from July 4th through the end of August. Click here to learn more about Bespoke’s premium stock market research service.

Continuing Claims Catching Up
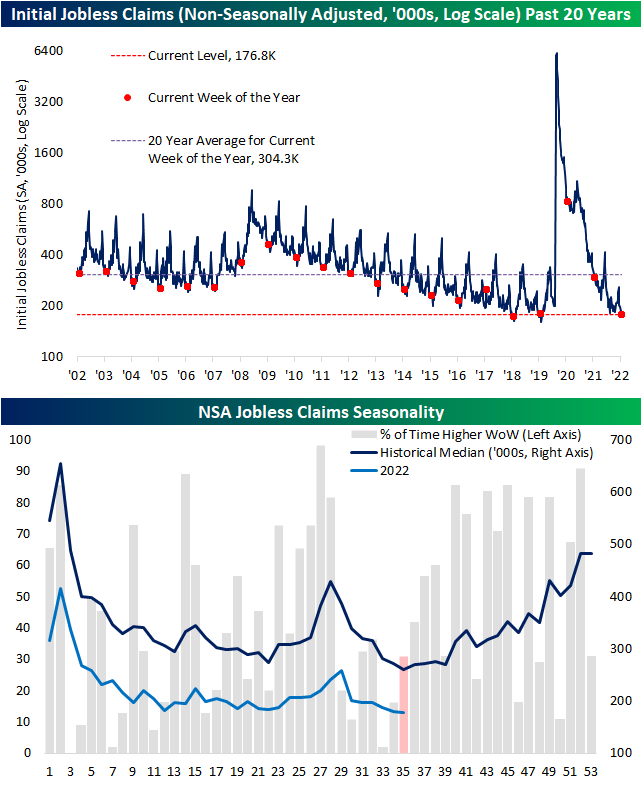
Initial jobless claims had a strong showing this week as the previous reading was revised lower by 6K to 237K. From that revised level, claims fell another 5K down to 232K marking the lowest reading since the last week of June. That was also handily below expectations which were calling for an increase up to 248K. With another week over week decline, claims have now fallen for three weeks in a row; the longest streak of declines since February.

On a non-seasonally adjusted (NSA) basis, the current week of the year has historically marked the annual low. Assuming that is the case this year, 176.8K is in line with the readings from the comparable week of the year in 2018 and 2019. Although further declines are not out of the realm of possibility, assuming normal seasonal patterns, NSA claims will likely rise from here through the end of the year.
Continuing claims are lagged an additional week to initial claims.. While continuing claims remain low having avoided the same degree of upward drift that initial claims have experienced this year, this week’s reading did move up to 1.438 million. That marks the most elevated level since the first week of April.
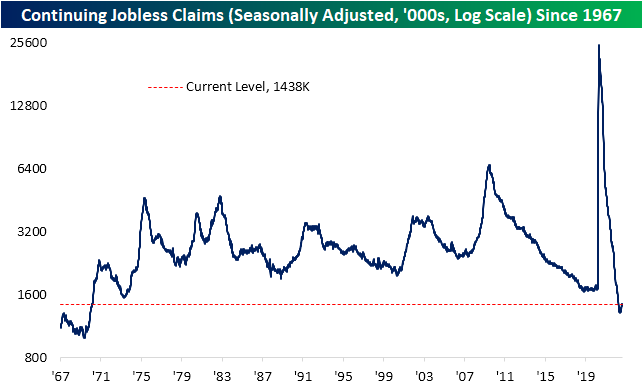
Recently we have been highlighting the ratio of initial claims to continuing claims as a way of showing the disconnect between the two seasonally adjusted readings. In other words, the lack of filter through of initial claims into continuing claims, which can be extrapolated as those filing for unemployment are quickly finding new roles. Although the ratio remains well above the historical norm and especially the range of readings observed since the early 1990s, it has begun to roll over in the past five weeks. As for just how big of a drop it has been, the decline ranks in the bottom 2% of all 5-week moves on record. While that is not to say the overall claims picture (initial claims not turning into continuing claims) has completely turned around, it is a sign that continuing claims have been playing a degree of catch-up. Click here to learn more about Bespoke’s premium stock market research service.

Bespoke’s Morning Lineup – 9/1/22 – Flood of Economic Data
See what’s driving market performance around the world in today’s Morning Lineup. Bespoke’s Morning Lineup is the best way to start your trading day. Read it now by starting a two-week trial to Bespoke Premium. CLICK HERE to learn more and start your trial.
“Someday computers will make us all obsolete.” – Bobby Fischer
Below is a snippet of content from today’s Morning Lineup for Bespoke Premium members. Start a two-week trial to Bespoke Premium now to access the full report.
The new month is kicking off on an even busier than normal note in terms of economic data. At 8:30, we’ll get the usual weekly jobless claims reports which are both expected to rise modestly. They will be joined with Non-Farm Productivity and Unit Labor Costs. Then, since it’s the first day of the month, at 10 AM we’ll get the releases of Construction Spending and ISM Manufacturing. Both reports are expected to show weakness relative to their prior readings, but the Prices Paid component of the ISM report is expected to slow falling from 60.0 down to 55.3.
Futures are lower heading into the opening bell which would put the S&P 500 on a five-day losing streak ever since Powell’s speech last Friday in Jackson Hole. Outside of the US, international markets were also broadly weaker overnight and into this morning on hawkish central bank commentary and slowdown concerns related to another COVID lockdown in China impacting 21 million residents of Chengdu. The 10-year yield is slightly higher trading just shy of 3.2% and oil is lower.
We’ll discuss it in more detail later today, but with the market weakness since last Friday’s Jackson Hole speech, investor sentiment has really weakened. A case in point is the weekly sentiment survey from the American Association of Individual Investors (AAII). In this week’s update, bearish sentiment surged eight percentage points rising from 42.4% to 50.4%. While readings above 50% have been more common this year, in the history of the survey since 1987, less than 4% of weekly readings have been higher than this week’s level of bearish sentiment.

Our Morning Lineup keeps readers on top of earnings data, economic news, global headlines, and market internals. We’re biased (of course!), but we think it’s the best and most helpful pre-market report in existence!
Start a two-week trial to Bespoke Premium to read today’s full Morning Lineup.