The Bespoke 50 Growth Stocks — 1/26/23
The “Bespoke 50” is a basket of noteworthy growth stocks in the Russell 3,000. To make the list, a stock must have strong earnings growth prospects along with an attractive price chart based on Bespoke’s analysis. The Bespoke 50 is updated weekly on Thursday unless otherwise noted. There were nine changes to the list this week.
The Bespoke 50 is available with a Bespoke Premium subscription or a Bespoke Institutional subscription. You can learn more about our subscription offerings at our Membership Options page, or simply start a two-week trial at our sign-up page.

The Bespoke 50 performance chart shown does not represent actual investment results. The Bespoke 50 is updated weekly on Thursday. Performance is based on equally weighting each of the 50 stocks (2% each) and is calculated using each stock’s opening price as of Friday morning each week. Entry prices and exit prices used for stocks that are added or removed from the Bespoke 50 are based on Friday’s opening price. Any potential commissions, brokerage fees, or dividends are not included in the Bespoke 50 performance calculation, but the performance shown is net of a hypothetical annual advisory fee of 0.85%. Performance tracking for the Bespoke 50 and the Russell 3,000 total return index begins on March 5th, 2012 when the Bespoke 50 was first published. Past performance is not a guarantee of future results. The Bespoke 50 is meant to be an idea generator for investors and not a recommendation to buy or sell any specific securities. It is not personalized advice because it in no way takes into account an investor’s individual needs. As always, investors should conduct their own research when buying or selling individual securities. Click here to read our full disclosure on hypothetical performance tracking. Bespoke representatives or wealth management clients may have positions in securities discussed or mentioned in its published content.
Bespoke’s Morning Lineup — 1/26/23
See what’s driving market performance around the world in today’s Morning Lineup. Bespoke’s Morning Lineup is the best way to start your trading day. Read it now by starting a two-week trial to Bespoke Premium. CLICK HERE to learn more and start your trial.
“Market makers know that the market is always right. You are wrong if you are losing money for any reason at all. Market makers have that drilled into their head. They know value is irrelevant in times of market stress.” — Michael Platt, founder of Bluecrest Capital

Below is a snippet of content from today’s Morning Lineup for Bespoke Premium members. Start a two-week trial to Bespoke Premium now to access the full report.
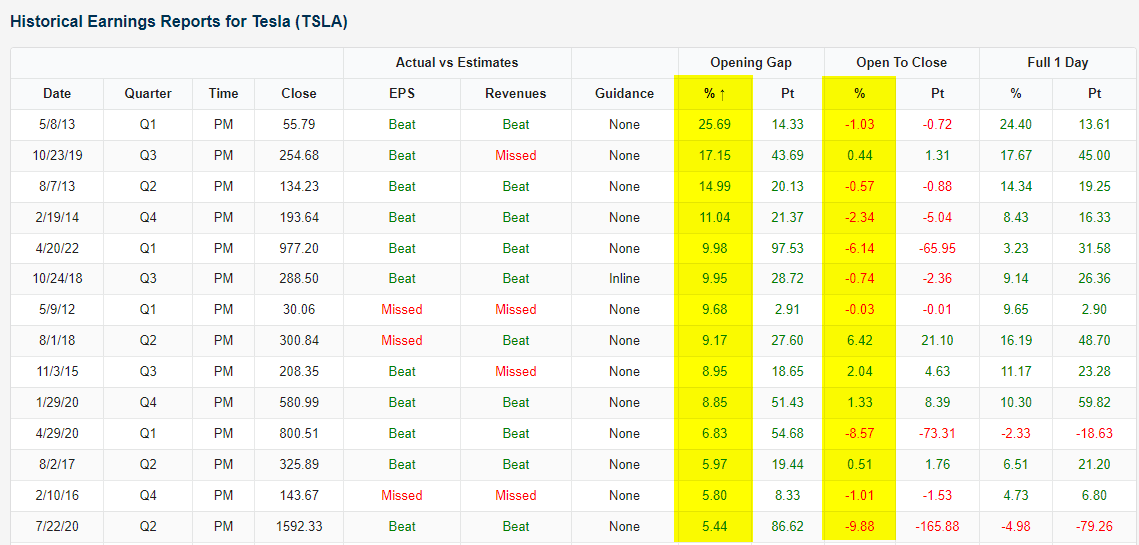
Tesla (TSLA) reported earnings after the close yesterday and beat expectations on both the top and bottom line. The stock is set to open higher by just over 7% when the bell rings this morning, which would be its 15th gap higher on earnings out of the 50 quarterly results the company has posted since going public. Below is a snapshot of the 14 prior gaps higher of 5%+ in reaction to earnings for Tesla as shown in our Earnings Explorer tool. Historically, the stock has averaged a slight decline of 1.4% from the open to the close of trading on these 14 prior earnings reaction days, with positive returns from the open to close 5 out of 14 times. Twice out of 14 times, TSLA has gapped up 5%+ on earnings only to finish the day lower because of sharp intraday reversals. These two reversals came on back-to-back earnings releases in April and July of 2020. Only once has TSLA tacked on another 5%+ from the open to the close after gapping up 5%+, and that came back in August 2018 when shares opened up 9.2% and went up another 6.4% intraday for a full-day gain of 16.2%.
In today’s Morning Lineup, we also take a look at a few bullish chart patterns we’ve identified across key US sectors and groups.
Our Morning Lineup keeps readers on top of earnings data, economic news, global headlines, and market internals. We’re biased (of course!), but we think it’s the best and most helpful pre-market report in existence!
Start a two-week trial to Bespoke Premium to read today’s full Morning Lineup.
Bespoke’s Morning Lineup — 1/25/23
See what’s driving market performance around the world in today’s Morning Lineup. Bespoke’s Morning Lineup is the best way to start your trading day. Read it now by starting a two-week trial to Bespoke Premium. CLICK HERE to learn more and start your trial.
“I’ve actually made a prediction that within 30 years a majority of new cars made in the United States will be electric. And I don’t mean hybrid, I mean fully electric.” – Elon Musk, 6/25/08
Below is a snippet of content from today’s Morning Lineup for Bespoke Premium members. Start a two-week trial to Bespoke Premium now to access the full report.
When Elon Musk made the prediction in 2008 that the majority of new cars made in the US would be electric within 30 years, the flagship Tesla Model S — the first modern all-electric vehicle — was still four years from debuting in 2012. Hybrids like the Toyota Prius were certainly an option in 2008, but fully electric cars were simply not something that consumers (or the government) were thinking about.
We’re now closing in on the halfway point of Musk’s 30-year prediction, and we’d say that he’s on his way. In 2022, EV sales in the US represented 5.8% of total sales, up two-thirds from the prior year’s 3.2% market share. This increase came even as total vehicle sales declined 8% in 2022. The “tipping point” for wider EV adoption is said to be around 5%, and with that mark now eclipsed, Bloomberg estimates that half of all US auto sales will be EVs by 2030 — a full eight years sooner than Musk predicted back in 2008. Tesla (TSLA) reports quarterly earnings after the close today.
After initially trading higher by more than 4% in response to earnings after the close yesterday, shares of Microsoft $MSFT are currently set to open down 2.5% after investors digested less-than-stellar revenue guidance from the company. Microsoft’s weakness has the Nasdaq 100 ETF (QQQ) trading down more than 1% pre-market, so we’re currently set for a pretty big gap down at the open.
In today’s full Morning Lineup, we take a closer look at technicals for the “big Tech” mega-caps, and we analyze sector breadth measures that are acting contrary to the general economic consensus at the moment.
Our Morning Lineup keeps readers on top of earnings data, economic news, global headlines, and market internals. We’re biased (of course!), but we think it’s the best and most helpful pre-market report in existence!
Start a two-week trial to Bespoke Premium to read today’s full Morning Lineup.
Bespoke’s Morning Lineup — 1/24/23
See what’s driving market performance around the world in today’s Morning Lineup. Bespoke’s Morning Lineup is the best way to start your trading day. Read it now by starting a two-week trial to Bespoke Premium. CLICK HERE to learn more and start your trial.
“I reached my hand down and picked it up; it made my heart thump, for I was certain it was gold.” — James Marshall
Below is a snippet of content from today’s Morning Lineup for Bespoke Premium members. Start a two-week trial to Bespoke Premium now to access the full report.
Today’s quote of the day comes from James Marshall, a carpenter and sawmill operator who found gold in water at Sutter’s Mill near Coloma, California on this day in 1848. Marshall’s find sparked the California Gold Rush, one of the most memorable and famous events in US history. The “forty-niners” that rushed to California with hopes of striking it rich increased San Francisco’s population from 1,000 in 1848 to 25,000 by December 1849. This Sunday the San Francisco 49ers will play in their 18th NFC Championship game when they travel to Philadelphia to play the Eagles with a trip to the Super Bowl on the line.
The gold rush left economists and investors with two important lessons. The first is that you generally need to spot trends early to make big money (most of the gold was found by the earliest to arrive), and the second relates to the famous Mark Twain quote that “during the gold rush, it’s a good time to be in the pick and shovel business.” While most of the arriving miners looking to get rich quick didn’t end up turning a profit, the merchants supplying the miners with everything from tools to food made the big bucks. When it comes to investing in new trends, find the merchants, not the miners.
Earnings so far this morning have been positive with ten companies beating EPS estimates and just one EPS miss (3M). Even still, US equity futures are down slightly ahead of the open as investors digest back to back gains of 1%+ for the S&P 500.
Although we noted it in last night’s Closer, it’s worth pointing out again that both the S&P and the Nasdaq 100 managed to trade above the top of their one-year downtrend channels yesterday. It’s a small break at this point that could easily turn out to be a pump fake, but it’s at least a start. Technicians will now be looking for the two indices to break above their late November/early December highs — which would represent a higher high after we just saw a higher low for the indices earlier this month. A higher-high would trigger a new short-term uptrend formation, which is something we haven’t seen since last summer.

Our Morning Lineup keeps readers on top of earnings data, economic news, global headlines, and market internals. We’re biased (of course!), but we think it’s the best and most helpful pre-market report in existence!
Start a two-week trial to Bespoke Premium to read today’s full Morning Lineup.
Earnings Onslaught On The Way
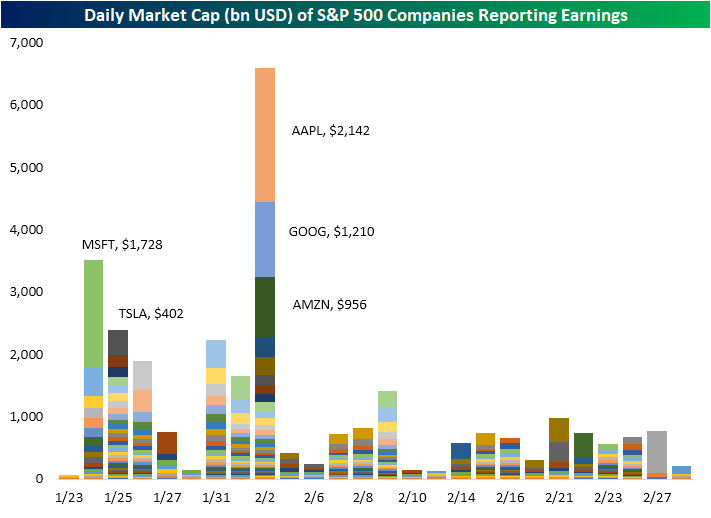
As we noted in today’s Morning Lineup, we may technically be in the midst of earnings season, but we have yet to see too heavy of a slate of reports. We are kicking off this week with another quiet day with only 11 reports scattered before and after the bell. Earnings will ramp up dramatically starting tomorrow, though, with the calendar remaining busy through the next month. As shown in the snapshot from our Earnings Explorer tool below, after today there will be another nearly 200 reports scheduled for this week alone.

While the number of stocks reporting will remain high through February, this week and next will see the bulk of companies in terms of market cap. In the chart below from last Friday’s Bespoke Report, we show each day’s daily market cap of S&P 500 companies scheduled to report earnings through the end of February. Through next Friday alone, a combined $19.8 trillion in market cap will report, or 57% of the S&P 500’s total market cap. That includes the mega-cap names with Microsoft (MSFT) leading things off tomorrow followed by Tesla (TSLA) on Wednesday. Next Thursday, the combined $4.3 trillion in market cap from Apple (AAPL), Alphabet (GOOGL), and Amazon (AMZN) will all be out on the same day. After that, Berkshire Hathaway (BRK/B) will be the last remaining mega-cap stock to report earnings, and that will not be until February 27th.
To keep track of all upcoming earnings reports, be sure to check out our Earnings Explorer.Click here to learn more about Bespoke’s premium stock market research service.
Bespoke’s Morning Lineup — 1/23/23
See what’s driving market performance around the world in today’s Morning Lineup. Bespoke’s Morning Lineup is the best way to start your trading day. Read it now by starting a two-week trial to Bespoke Premium. CLICK HERE to learn more and start your trial.
“It’s obvious that we don’t know one millionth of one percent about anything.” – Thomas Edison
Below is a snippet of content from today’s Morning Lineup for Bespoke Premium members. Start a two-week trial to Bespoke Premium now to access the full report.
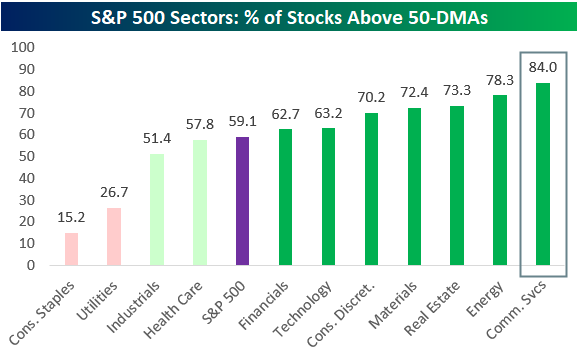
At 13 trading days into the new year, Communication Services (XLC) is currently the best-performing sector YTD with a gain of 10.65%. As shown below, XLC is easily the farthest above its 50-DMA of any sector, propelled last week by big moves higher in names like Netflix (NFLX) and Alphabet (GOOGL). Remember, Communication Services was the worst-performing sector of 2022 with a decline of more than 37%. We’ve clearly seen some bottom fishing this year in last year’s hardest-hit areas of the market.

It’s not just the mega-caps driving Communication Services higher either. 84% of stocks in the sector are currently above their 50-DMAs; the highest reading for any sector. On the other hand, it’s the defensive areas of the market that investors have moved away from recently, with just 26.7% of Utilities sector stocks and 15.2% of Consumer Staples above their 50-DMAs. Consumer Staples (XLP) is the only sector that’s currently oversold.
See more of our thoughts on Communication Services, including a look at the individual names that make up the sector, in today’s Morning Lineup.
Our Morning Lineup keeps readers on top of earnings data, economic news, global headlines, and market internals. We’re biased (of course!), but we think it’s the best and most helpful pre-market report in existence!
Start a two-week trial to Bespoke Premium to read today’s full Morning Lineup.
The Bespoke Report – 1/20/23 – We’ll Take It
This week’s Bespoke Report newsletter is now available for members. (Log in here if you’re already a subscriber.)
Since the start of Q4 last year we’ve seen a trend shift across a range of asset classes. Interest rates, the dollar, stocks, industrial metals, natural gas, and a range of other markets are moving in the opposite direction compared to most of last year. Some of this is down to luck – specifically related to the weather – but shifts from policymakers and economic data are also playing a major role. Despite trend shifts, US stocks have still not broken out. Earnings season is under way and could be the defining factor between whether bear market downtrends prevail or a new bull trend has been established.
View this week’s Bespoke Report newsletter by starting a one-month trial, or click the image below to view our membership options page.

Bespoke’s Morning Lineup — 1/20/23
See what’s driving market performance around the world in today’s Morning Lineup. Bespoke’s Morning Lineup is the best way to start your trading day. Read it now by starting a two-week trial to Bespoke Premium. CLICK HERE to learn more and start your trial.
“Your mind is like a parachute: If it isn’t open, it doesn’t work.” – Buzz Aldrin (born on this day in 1930)
Below is a snippet of content from today’s Morning Lineup for Bespoke Premium members. Start a two-week trial to Bespoke Premium now to access the full report.
While US index ETFs have pulled back over the last week, the rest of the world has actually held up just fine. As shown below, the Dow (DIA) is now in oversold territory and down YTD, while the S&P (SPY) and Nasdaq 100 (QQQ) have moved below their 50-DMAs. All-world ex US (CWI), Europe (IEV), and emerging markets (EEM) have held steady in overbought territory over the last week and remain up 7-8% YTD. While SPY is down 2.8% over the last two days, EEM is actually up 7 basis points.

As we highlighted in yesterday’s Morning Lineup, Q4 earnings for Netflix (reported in January) has historically been its most positive quarter. The company didn’t disappoint this time around as shares are set to open higher by nearly 7% this morning.
Next week over 200 companies will report Q4 numbers, with plenty of blue-chips on the calendar. Probably the two most closely-watched releases will be Microsoft (MSFT) on Tuesday and Tesla (TSLA) on Wednesday — both after the close.
Microsoft’s Q4 reports throughout its history have been relatively uninspiring compared to other quarters, as shown in the snapshot from our Earnings Explorer below:

To see Tesla’s historical trends around Q4 earnings, continue reading today’s Morning Lineup with a new Bespoke Premium trial.
Our Morning Lineup keeps readers on top of earnings data, economic news, global headlines, and market internals. We’re biased (of course!), but we think it’s the best and most helpful pre-market report in existence!
Start a two-week trial to Bespoke Premium to read today’s full Morning Lineup.
Claims Peak Early
Jobless claims were anticipated to reverse much of last week’s improvement as forecasts were calling for initial claims to rise from 205K to 214K. Instead, there was a sub-200K print as claims fell to the lowest level since the end of September.
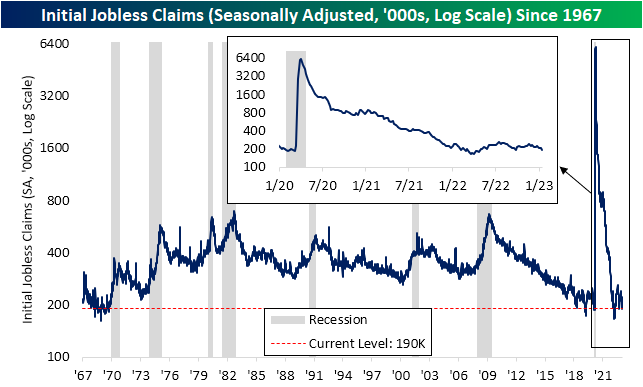
Before seasonal adjustments, claims fell to 285.58K from a seasonal peak of 339.16K last week. As shown below, a decline in the second week of the year is not unheard of but is not exactly the norm either. In most years, the second week of the year has marked the annual high for claims as the week has historically seen a week-over-week increase in claims 85% of the time. 2017 and 2018 are the two other most recent examples of claims peaking in the first rather than the second week of the year.
All that is to say, the week-over-week drop in the seasonally adjusted number per today’s print is perhaps a bit overstated. The end and start of the year tend to be volatile for seasonality thus the weeks ahead will help to provide a clearer picture of where claims really stand.

Turning over to continuing claims, the first week of the year saw claims rise by 17K up to 1.647 million. That is still below higher levels observed throughout late November and December as the deterioration in claims over the past month has subsided. Click here to learn more about Bespoke’s premium stock market research service.

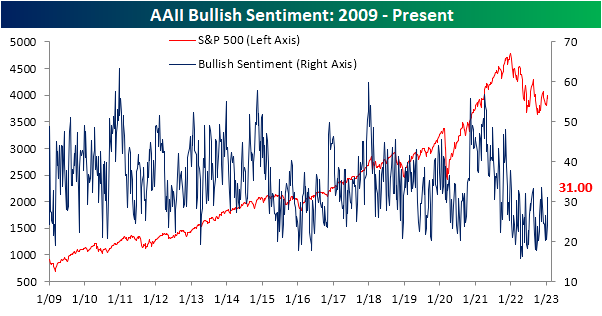
Bulls and Bears Almost Evenly Split
As we noted in last night’s Closer, the S&P 500 has seen a bit of technical damage done in the past few sessions. In spite of the turn lower, sentiment readings have improved. For the AAII sentiment survey, bullish sentiment has risen up to 31%. That 7 percentage point jump makes for the largest week-over-week increase and the highest reading since the week of November 17th.
Bearish sentiment plummeted to 33.1% of respondents which is down sharply from just a month ago when more than half of those responding reported as pessimists. The four straight weeks of declines is now the longest such streak since August leaving bearish sentiment only 0.2 percentage points above the second half of 2022’s low reached in the first week of November.
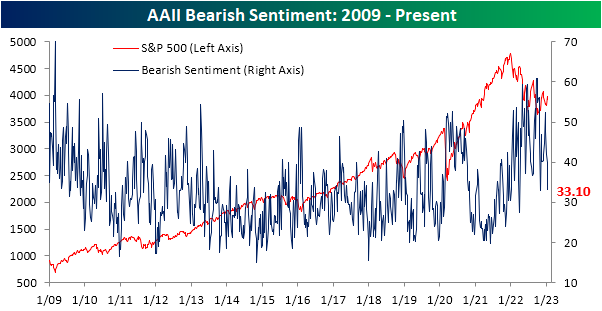
As a result of the big moves, the bull-bear spread has narrowed all the way to -2.1. As we have frequently noted over the past few months, we are currently on a record streak of 42 weeks in a row with a negative bull-bear spread. This week’s reading is now the narrowest reading in the spread during that streak.

Taking into account other sentiment surveys, this week’s readings also showed a healthy improvement in sentiment, putting a record streak on the ropes. Below, we show our sentiment composite combining the AAII bull-bear spread with that same spread from the Investors Intelligence survey as well as the NAAIM Exposure index. At the moment, sentiment is only slightly more bearish than the historical norm with the composite at -0.14. While that does extend the streak of negative readings to 54 weeks in a row (tying an identically long streak that ended in June 2009), it is one of the least pessimistic readings of the current streak. In other words, across surveys sentiment may not have turned bullish, but it appears to be much less bearish than at other points in the past year. Click here to learn more about Bespoke’s premium stock market research service.
