Bulls Back Below 20%
The fallout from bank failures over the past week has put a major dent in investor sentiment. Since the week of February 23rd, optimism has been muted with less than a quarter of respondents to the weekly AAII sentiment survey having reported as bullish. That includes a new low of 19.2% set this week. That is the least optimistic reading on sentiment since September of last year.
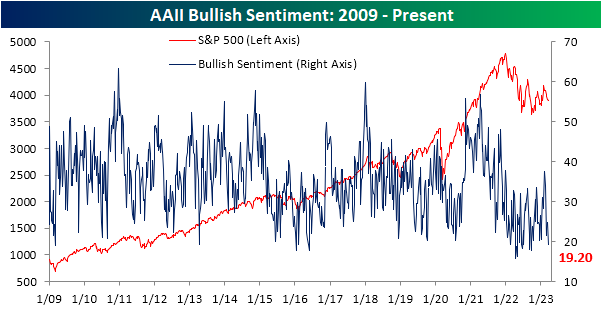
The drop in bullishness was met with a corresponding jump in bearish sentiment. That reading climbed from 41.7% up to 48.4%, the highest level since the week of December 22nd. While close to half of respondents are reporting as bearish, that remains well below the much higher readings that eclipsed 60% last year.

Last month saw the end to a record streak in which bearish sentiment outweighed bullish sentiment. However, the bull bear spread has now been negative for four weeks in a row once again. In fact, this week was the most negative reading in the spread since late December.

Factoring in other sentiment readings like the Investors Intelligence survey and the NAAIM Exposure Index—both of which similarly saw sentiment pivot toward more bearish tones this week—our sentiment composite is once again below -1, meaning the average sentiment indicator is reading extremely bearish sentiment. While prior to 2022 such depressed levels of sentiment were not commonplace, it has been the norm over the past year or so. Click here to learn more about Bespoke’s premium stock market research service.

Bespoke’s Morning Lineup – 3/16/23 – Better Data Ahead of ECB
See what’s driving market performance around the world in today’s Morning Lineup. Bespoke’s Morning Lineup is the best way to start your trading day. Read it now by starting a two-week trial to Bespoke Premium. CLICK HERE to learn more and start your trial.
“The Federal Reserve, in close consultation with the Treasury, is working to promote liquid, well-functioning financial markets, which are essential for economic growth.” – Ben Bernanke 3/16/2008

Below is a snippet of content from today’s Morning Lineup for Bespoke Premium members. Start a two-week trial to Bespoke Premium now to access the full report.
The quote above could have easily been made this week, but it was actually fifteen years ago today when Bear Stearns, the fifth largest US investment bank, avoided bankruptcy in what was an arranged sale to JP Morgan for $2. While a number of other smaller players in the subprime housing business had already folded, Bear was the first of the major dominoes to go. The emergency takeover of Bear staunched the wound for a time, but it was only a matter of weeks before the cockroaches on bank balance sheets came out from the walls. We all know what happened from there. 15 years to the day later, the question every investor is trying to answer is whether SVB Bank is this generation’s Bear Stearns or just a headline that most will forget all about a year from now.
Futures are mixed this morning as the S&P 500 and Dow are indicated modestly lower while the Nasdaq is in positive territory. European stocks are bouncing ahead of the ECB decision at 9:15 Eastern and on the news that Credit Suisse has taken a $54 billion loan from the Swiss National Bank to improve its liquidity position. US equities aren’t seeing the same lift since they rallied after Europe’s close yesterday on rumors of the SNB loan that European stocks are rallying on now.
The economic calendar is busy this morning as Jobless Claims, Import Prices, Housing Starts, Building Permits, and the Philly Fed all just hit the tape. Jobless Claims on both an initial and continuing basis were lower than expected, Import Prices dropped less than expected, and Building Permits and Housing Starts both came in significantly better than expected. The only report that missed forecasts was the Philly Fed manufacturing which came in at -23.2. Surprisingly, there has been little reaction (so far) in equity futures or the treasury market as attention will now shift to the ECB decision.
What started as a bank run on a regional bank in California last week quickly spread to regional and money center banks around the country and then this week across the Atlantic to European banks. But the weakness in equities hasn’t been confined to just the Financials sector. In the US, the Financials sector is down just over 10% over the last five trading days, but other cyclical sectors have also been pounded as Energy is down 9%, Materials is down 7.5%, and the Industrials sector is down over 5%. Around the world too, equities are down over the last week.
The snapshot below from our Trend Analyzer shows the performance of international regional ETFs. Over the last week, every single one of them is down with declines ranging from a loss of 1.42% for the Global 100 ETF (IOO) to a loss of 7.6% for the Latin America 40 ETF (ILF). Over the last three years, we’ve become all too familiar with the process of disease and virus transmission, and what we’ve seen over the last week is the very definition of contagion. Whether or not it’s just a cold or something worse like the flu will become more apparent in the coming weeks.

Our Morning Lineup keeps readers on top of earnings data, economic news, global headlines, and market internals. We’re biased (of course!), but we think it’s the best and most helpful pre-market report in existence!
Start a two-week trial to Bespoke Premium to read today’s full Morning Lineup.
The Bespoke Triple Play Report — 3/15/23
An earnings triple play is a stock that reports earnings and manages to 1) beat analyst EPS estimates, 2) beat analyst sales estimates, and 3) raise forward guidance. You can read more about “triple plays” at Investopedia.com where they’ve given Bespoke credit for popularizing the term. We like triple plays as an indication that a company’s business is firing on all cylinders, with above-expectations results and an improving outlook. A triple play is indicative of positive “fundamental momentum” instead of pure fundamentals, and there are always plenty of names with both high and low valuations on our quarterly list.
Bespoke’s Triple Play Report highlights companies that have recently reported earnings triple plays, and it features commentary from management on triple-play conference calls, company descriptions and analysis, and price charts. Bespoke’s Triple Play Report is available at the Bespoke Institutional level only. You can sign up for Bespoke Institutional now and receive a 14-day trial to read this week’s Triple Play Report, which features 18 stocks. To sign up, choose either the monthly or annual checkout link below:
Bespoke Institutional – Monthly Payment Plan
Bespoke Institutional – Annual Payment Plan

Fall of the Empire Fed
Among the bad news this morning was disappointing economic data in the form of the New York Fed’s Empire Manufacturing report. The report was expected to remain in contraction falling to -7.9 versus a reading of -5.8 last month. Instead, the index plummeted to a much weaker reading of -24.6. Although that is not a new low with even weaker readings as recently as January and last August, the report indicated a significant deterioration in the region’s manufacturing sector, and whereas weather in January was an easy scapegoat for the weakness, that’s not the case for the March report.
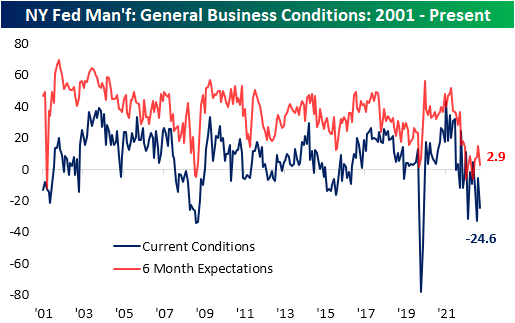
Given the large drop in the headline number, breath was equally bad with many other significant declines. Like the headline number’s 5th percentile reading and month-over-month decline, New Orders and Shipments both saw double-digit declines into bottom decile readings. In the case of Shipments, that low reading comes after an expansionary reading last month. Inventories was the only other current conditions index to move from expansion to contraction leaving Prices Paid and Prices Received as the last expansionary categories.

As mentioned above, demand appears weak as New Orders and Shipments are the two most depressed categories from a historical perspective with each index coming in the bottom 3% of all months since the start of the survey in the early 2000s. Six-month expectations are equally low. Unfilled Orders were one of two categories to see a higher reading month over month with the 2.5 point increase much smaller than the move in expectations. Unfilled Orders expectations surged by 12.1 points, ranking in the 95th percentile of all monthly moves on record. That would indicate the region’s firms expect unfilled orders to rise at a rapid pace in the months ahead, likely as a result of weakened sales. That does not mean the area’s firms are expecting inventory build-ups, though. Inventory expectations saw a modest 1.4-point increase month over month in March, but that remains one of the lower readings of the past decade.

The only other current conditions index to move higher month over month was delivery times. Even though it moved higher, the index continues to indicate lead times are rapidly improving and expectations are calling for those improvements to continue.

Next to the dampened demand picture, employment metrics were perhaps the next most jarringly negative. Hiring is falling precipitously with the Number of Employees index hitting a new cycle low of -10.1. Average Workweek also is reaching new lows. At -18.5 it has only been as low during the spring of 2020 and during 2008 and 2009. Click here to learn more about Bespoke’s premium stock market research service.

Bespoke’s Morning Lineup – 3/15/23 – Et tu, Credit Suisse
See what’s driving market performance around the world in today’s Morning Lineup. Bespoke’s Morning Lineup is the best way to start your trading day. Read it now by starting a two-week trial to Bespoke Premium. CLICK HERE to learn more and start your trial.
“Beware the Ides of March.” – Shakespeare, Julius Caesar
Below is a snippet of content from today’s Morning Lineup for Bespoke Premium members. Start a two-week trial to Bespoke Premium now to access the full report.
Futures are down sharply this morning, but surprisingly it has nothing directly to do with issues facing a US regional bank. Today’s weakness is due to a 30% plunge in Credit Suisse as its largest shareholder said it will no longer put additional capital into the bank. Dow futures are down over 600, the S&P 500 is indicated to open down 1.7% and the Nasdaq is holding up better with a drop of 1.4%. It’s been a busy morning for economic data as PPI missed expectations, Empire Manufacturing plunged, and Retail Sales were in line with forecasts. European stocks are down well over 2%, and Treasury yields are plunging. The only risk asset rallying on the day, at this point, is bitcoin.
As we type this, the two-year yield is down over 20 basis points (bps) and below 4% again in what can only be characterized as a turbulent move. If you were on an airplane, you’d be asking for another one of those white bags that they keep in the seat pocket in front of you. Today’s move is on pace to be the fifth straight day that the yield has moved more than 20 bps (up or down) in a single day. To put that move in perspective, the only other time that the two-year yield has had as many 20 bps moves in succession over the last 45 years was in December 1980. Outside of the early 1980s, there has never been another time when the yield on the two-year even moved 20 bps for three consecutive days. Two-year Treasuries have always been one of the most stable assets across the financial spectrum, but they’ve failed on that front lately.

The current moves in the two-year treasury stand out even more when you consider the actual level of yields. Sure, the last year or so has seen yields rise to the highest level since 2007, but in the early 1980s, which was the last time there was as much volatility in two-year yields as there is now, yields were more than double where they are now. Double. The Fed has gotten a lot wrong in their forecasts over the last few years, but one point where Powell was spot on was last August when he said that fighting inflation will “bring some pain”. He should have just come out and said, “Beware the Ides of March.”

Our Morning Lineup keeps readers on top of earnings data, economic news, global headlines, and market internals. We’re biased (of course!), but we think it’s the best and most helpful pre-market report in existence!
Start a two-week trial to Bespoke Premium to read today’s full Morning Lineup.
Nothing SHY About This
shy /SHī/ – adjective 1. being reserved or having or showing nervousness or timidity in the company of other people.
When one thinks about short-term US Treasuries and their traditional day-to-day price action, shy is a pretty good description. Traditionally, short-term Treasuries have not been the place an investor who was looking for action would go to look. That’s what tech stocks are for! As the Fed has embarked on what has been the most rapid pace of rate hikes in at least 40 years, though, no type of financial asset, including short-term Treasuries, has been spared. The chart below shows the iShares 1-3 Year Treasury Bond ETF (with the aptly named ticker SHY) over the last year. A year ago, the ETF was trading just above $84, and last week it was down near $80 before rebounding over the past few days to a high of $82.02 yesterday. A one-year range of just under 5% is hardly volatile, but from the perspective of a short-term Treasury investor, it’s a gigantic move.

The last week has been a period of historic volatility for US Treasuries – at least relative to the last 20 years. The chart below shows the daily percentage changes in SHY since its inception in July 2002. Yesterday, the ETF had its largest-ever one-day gain at just under 1% (0.997%). You can also see from the chart that ever since the FOMC started hiking rates in early 2022, the magnitude of SHY’s average daily moves has rapidly expanded.

Monday’s (3/13) nearly 1% rally in SHY also marked a milestone for the ETF in that it experienced a one-day gain or loss of at least 0.25% for three consecutive trading days. That tied the longest-ever streak of 0.25% daily moves from back in September 2008 just after Lehman declared bankruptcy. With SHY down 0.34% on the day in late trading Tuesday, it is now on pace for its 4th straight day of 0.25% daily moves. Yup, you read that correctly; volatility in short-term Treasuries is greater now than it was during the Financial crisis! When Powell said last Summer that fighting inflation would ‘bring some pain’, he wasn’t kidding. As a result, SHY may want to consider changing its ticker to something more applicable. “BOLD” is available. Click here to learn more about Bespoke All Access, our premium membership offering.

Some Good and Some Bad in Small Business Optimism
Early this morning, the NFIB released the results of its February survey of small business optimism. The headline index rose to 90.9 versus expectations of it remaining unchanged at 90.3. In spite of the bounce, small businesses continue to report some of the worst sentiment of the past decade with the February reading right back in line with the April 2020 low.

Diving deeper into the categories of the report, breadth was mixed. Of the ten inputs into the headline number, four were lower month over month, one was unchanged, and the other half were higher. For the most part, these indices also remain in the bottom decile of their historical readings.

In today’s Morning Lineup, we highlighted how the report’s labor metrics have been improving in each of the past four months on an aggregate basis. Plans to increase employment remain healthy in the 77th percentile while the percentage of respondents reporting job openings as hard to fill hit a new record high after rising by a near record 9 points month over month. Although openings were harder to fill, firms also took on more workers. With actual employment changes moving up to 4, it hit the highest level of the post-pandemic period. However, that did clash with hiring plans falling 2 points to match December for one of the lowest readings of the past few years. Likewise, plans to increase compensation are at the lower end of their recent range even while actual observed changes to compensation have improved in the past few months.

The same dynamic in which plans are headed in the opposite direction of actual changes can be observed with regards to capital expenditures. Capital expenditure plans were unchanged at 21 last month for the joint lowest reading since March 2021. Meanwhile, actual capital expenditures rose to 60, the highest since March 2020 and credit conditions have improved. Turning to inventories, satisfaction (meaning the net percent of firms reporting if inventories are too low versus too high) fell to the lowest since the spring of 2020. As a result, a net 7% of firms are reporting that they plan to decrease inventories in the coming months.

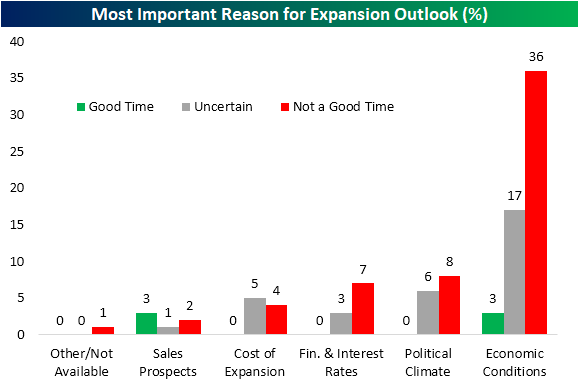
Finally, we would note that on net more firms are seeing lower rather than higher sales in spite of improvements to inflation metrics. The outlook for general business conditions has yet to see any improvement as few businesses report now is a good time to expand.

Most firms report now as a poor time to expand due to economic conditions at 36% of responses. The next most commonly credited reason is political climate followed by interest rates, which at 7% match the December reading for the highest since at least 2020. Click here to learn more about Bespoke’s premium stock market research service.
Bespoke’s Morning Lineup – 3/14/23 – The Number You’ve All Been Waiting For
See what’s driving market performance around the world in today’s Morning Lineup. Bespoke’s Morning Lineup is the best way to start your trading day. Read it now by starting a two-week trial to Bespoke Premium. CLICK HERE to learn more and start your trial.
“History is largely a history of inflation, usually inflations engineered by governments for the gain of governments.” – Friedrich August von Hayek
Below is a snippet of content from today’s Morning Lineup for Bespoke Premium members. Start a two-week trial to Bespoke Premium now to access the full report.
Futures have been rallying this morning as bond yields move higher as investors breathe a sigh of relief due to the fact that there were no additional bank blowups overnight. Regional banks are seeing the most strength as a stock like First Republic (FRC) is up over 60% in the pre-market. That’s great if you bought the stock yesterday, but it’s still down sharply from where it closed last Friday, let alone where it was coming into the year.
The big number of the morning is obviously the February CPI and that reading came in right in line with forecasts at the headline level (0.4%). Ex Food and Energy, the reading was 0.5% which was slightly higher than expected (0.4%). On a y/y basis, both headline (6.0%) and core (5.5%) were right in line with forecasts. Markets were worried about another hot reading, so the immediate reaction has been a modest bounce in equity futures.
While the moves have been the most pronounced in the Treasury market and regional banks stocks, volatility and extreme reversals have been showing up all over global financial markets in the last several days. Take the equity market of Japan. Last week, the TOPIX finally broke above multi-month resistance to new 52-week highs on Thursday. From a technical standpoint, the action looked like a textbook breakout with well-defined support at former resistance near the 2,000 level. That was Thursday.
In the three days that followed, the TOPX has been down at least 1.5% every day for a total decline of 6%. And that support around the 2,000 level? It was more like Swiss cheese. In last night’s trading, the TOPIX also sliced right through its 50-day moving average (DMA) although it did find some support at the 200-DMA.

Going all the way back to the mid-1980s, the last four trading days for the TOPIX represent just the second time that the index hit a 52-week high and then followed that up with three straight declines of at least 1%. The other period was in October 2003 when the TOPIX hit a 52-week high on 10/20 and then followed that high up with daily declines of 1.1%, 1.8%, and 5.3%, respectively for a total decline of 8.8%. During that correction, the TOPIX’s total decline from that 52-week high pullback was 14.5% before the index went on to recover and resume its upward trend.

Our Morning Lineup keeps readers on top of earnings data, economic news, global headlines, and market internals. We’re biased (of course!), but we think it’s the best and most helpful pre-market report in existence!
Start a two-week trial to Bespoke Premium to read today’s full Morning Lineup.
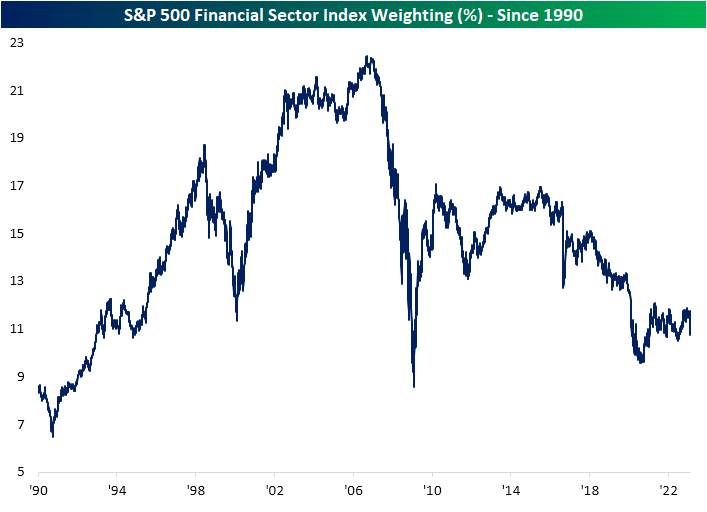
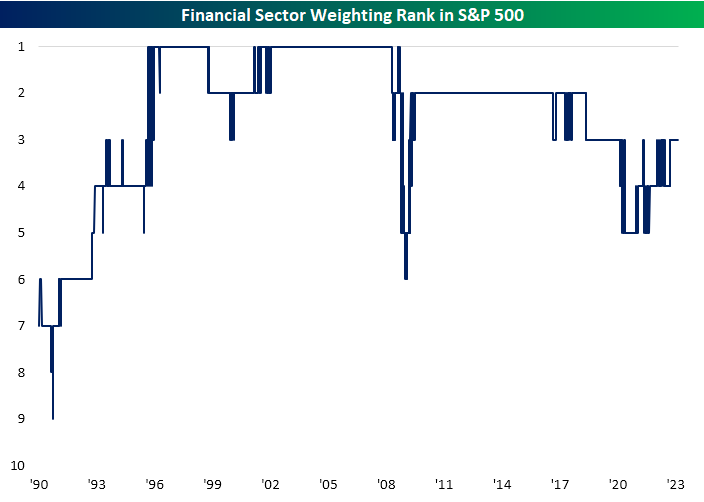
A Look at the Financial Sector’s Weighting
At its YTD high back on February 7th, the S&P Financial sector ETF (XLF) was up more than 8% on the year. Since that high, the sector has fallen more than 13% and is now down more than 6% YTD.
With systemic risk in the Financial system making front-page headlines again, we checked in on the sector’s weighting in the S&P 500 to see how it compares to where things stood back in the mid-2000s ahead of the Financial Crisis. Below is a look at the Financial sector’s weighting in the S&P going back to 1990. As of this writing, the Financial sector has a weighting of 10.73% in the S&P. That’s down a full percentage point from where it was at the end of February.
What’s interesting to note is how much smaller the sector is today compared to its weighting back in early 2006 when we were on the cusp of the Financial Crisis. At its peak in early 2006, the sector’s weight in the S&P had ballooned to 22.4%, which made it the largest sector of the S&P at the time. When the Financial sector, which is a sector meant to service the rest of the economy becomes the largest sector, something’s off! Of course, the Financial Crisis following the bursting of the housing bubble of the mid-2000s corrected this problem, as the Financial sector’s weighting fell from north of 22% down to south of 9% when the bottom was finally put in back in early 2009. During this latest bout of issues for Financials, the sector is still big enough to be the third largest sector in the S&P behind Tech and Health Care, but it’s not nearly as “weighty” as it was before the Financial Crisis, and its weighting has actually been trending lower for the last 7-8 years. Click here to learn more about Bespoke’s premium stock market research service.
Don’t Forget About CPI
With all the worry about the potential for bank runs, you may have forgotten that there’s a CPI report tomorrow morning. After January data came in higher than investors had hoped, consensus forecasts for Tuesday’s February CPI are calling for a 0.4% m/m increase on both a headline and core basis. Based on recent trends, while the bias towards higher-than-expected readings hasn’t been as extreme as it was just a few months ago, lower-than-expected headline readings have been hard to come by over the last year with just three in the last 12 months.

In terms of seasonality, history isn’t really on the side of those who are looking for a lower-than-expected report tomorrow. Going back to 1999, headline CPI reports released in March have been lower than expected just two times which is easily the lowest of any month. In total, of the 24 CPI reports released in March since 1999, 10 have been higher than expected, 12 have been inline, and two have missed forecasts. Will tomorrow be the third time the charm? Click here to learn more about Bespoke’s premium stock market research service.
