FANG+ Flying
As we noted in today’s Morning Lineup, sector performance has heavily favored areas like Tech, Consumer Discretionary, and Communication Services in recent weeks. Playing into that sector level performance has been the strength of the mega-caps. The NYSE FANG+ index tracks ten of the largest and most highly traded Tech and Tech-adjacent names. In the past several days, that cohort of stocks is breaking out to the highest level since last April whereas the S&P 500 still needs to rally 4% to reach its February high.

Although FANG+ stocks have been strong recently, that follows more than a full year of underperformance. As shown below, relative to the S&P 500, mega-cap Tech consistently underperformed from February 2021 through this past fall. In the past few days, the massive outperformance has resulted in a breakout of the downtrend for the ratio of FANG+ to the S&P 500.

More impressive is how rapid of a move it has been for that ratio to break out. Below, we show the 2-month percent change in the ratio above. As of the high at yesterday’s close, the ratio had risen 22.5% over the prior two months. That comes up just short of the record (22.6%) leading up to the pre-COVID high in February 2020. In other words, mega-cap Tech has experienced near-record outperformance relative to the broader market. However, we would note that this is in the wake of last year when the group had seen some of its worst two-month underperformance on record with the worst readings being in March, May, and November.

Have you tried Bespoke All Access yet?
Bespoke’s All Access research package is quick-hitting, actionable, and easily digestible. Bespoke’s unique data points and analysis help investors better visualize underlying market trends to ultimately make more informed investment decisions.
Our daily research consists of a pre-market note, a post-market note, and our Chart of the Day. These three daily reports are supplemented with additional research pieces covering ETFs and asset allocation trends, global macro analysis, earnings and conference call analysis, market breadth and internals, economic indicator databases, growth and dividend income stock baskets, and unique interactive trading tools.
Click here to sign up for a one-month trial to Bespoke All Access, or you can read even more about Bespoke All Access here.

Bespoke’s Morning Lineup – 3/22/23 – Now Batting
See what’s driving market performance around the world in today’s Morning Lineup. Bespoke’s Morning Lineup is the best way to start your trading day. Read it now by starting a two-week trial to Bespoke Premium. CLICK HERE to learn more and start your trial.
“Those who have the task of making such policy don’t expect you to applaud.” – William McChesney Martin

Below is a snippet of content from today’s Morning Lineup for Bespoke Premium members. Start a two-week trial to Bespoke Premium now to access the full report.
There’s no economic data on the calendar and there’s little in the way of earnings news to focus on this morning, so for the next six hours, we’ll only have the Fed to worry about. Markets are still overwhelmingly pricing in a 25 bps hike with the current odds at close to 90%. It’s hard to imagine a rate hike given the weakening macro backdrop and the crisis in the banking sector, but those are the numbers, and at this point, there have been little signs of the problems spreading.
The fact that UK CPI just printed its sixth straight month of double-digit y/y increases and ECB President Christine Lagarde was out saying she doesn’t see clear evidence that inflation is trending down doesn’t help the cause of those calling for a pause. Those are trends literally an ocean away, though, and over on this side of the Atlantic, just about every inflation indicator we track has been trending lower. Whatever decision the FOMC makes, it’s safe to assume that there will be no shortage of critics after the fact, and we don’t envy the position that Powell is in.
Heading into today’s rate decision, most sectors have traded down over the last week with Real Estate and Energy leading the way lower. Surprisingly, in the middle of a banking ‘crisis’ Financials isn’t even the worst performing sector as it is down less than 1% over the last five trading days and isn’t even the worst performing sector on a YTD basis. Sure, it’s down over 6.5%, but Utilities and Energy are also both down more than the Financials.
While Financials, Utilities, and Energy have been a drag on the market, Communication Services, Technology, and Consumer Discretionary have been the main drivers of gains this year. Not only are they the only sectors up more than 1% on the year, but they’re also all up over 10%, so these three sectors are basically in a league of their own versus the rest of the field.

Lately, Technology has been the clear leader. It’s only the second-best performing sector YTD, but its further above its 50-DMA than any other sector, and it’s on the verge of breaking out of the sideways range it has been in for the last two months.

Our Morning Lineup keeps readers on top of earnings data, economic news, global headlines, and market internals. We’re biased (of course!), but we think it’s the best and most helpful pre-market report in existence!
Start a two-week trial to Bespoke Premium to read today’s full Morning Lineup.
Bespoke’s Morning Lineup – 3/21/23 – All Quiet (For Now) on the Banking Front
See what’s driving market performance around the world in today’s Morning Lineup. Bespoke’s Morning Lineup is the best way to start your trading day. Read it now by starting a two-week trial to Bespoke Premium. CLICK HERE to learn more and start your trial.
“Bank failures are caused by depositors who don’t deposit enough money to cover losses due to mismanagement.” – Dan Quayle
Below is a snippet of content from today’s Morning Lineup for Bespoke Premium members. Start a two-week trial to Bespoke Premium now to access the full report.
There’s been no new news on the banking front this morning, and investors are taking the lack of news as an excuse to rally. US futures are up about 0.80% as treasury yields spike higher. Ahead of tomorrow’s fateful Fed decision, the only economic report on the calendar is Existing Home Sales at 10 AM today.
With an increase of ‘just’ 14 basis points (bps), yesterday broke a streak of seven straight days that the yield in the yield of the 2-year US Treasury had a daily move of more than 20 bps. Another record streak that continued, though, was the fact that the 2-year yield traded with an intraday range of at least 30 bps. Going back to 2000, which is as far back as we have intraday data for the 2-year yield, the current six-trading day streak of 30+ bps intraday moves is now longer than the five-trading day streak in September 2008 after the Lehman bankruptcy.

Not only is the current streak of wide daily ranges a record, but it also included what was a record single-day intraday range. Last Wednesday, the 2-year yield’s intraday range spanned a low of 3.71% to a high of 4.41%. That 70-bps range was a full 10 bps more than the prior record of 60 bps back on 9/19/08. Is that enough action for you?

Our Morning Lineup keeps readers on top of earnings data, economic news, global headlines, and market internals. We’re biased (of course!), but we think it’s the best and most helpful pre-market report in existence!
Start a two-week trial to Bespoke Premium to read today’s full Morning Lineup.
The Bespoke Triple Play Report — 3/21/23
An earnings triple play is a stock that reports earnings and manages to 1) beat analyst EPS estimates, 2) beat analyst sales estimates, and 3) raise forward guidance. You can read more about “triple plays” at Investopedia.com where they’ve given Bespoke credit for popularizing the term. We like triple plays as an indication that a company’s business is firing on all cylinders, with above-expectations results and an improving outlook. A triple play is indicative of positive “fundamental momentum” instead of pure fundamentals, and there are always plenty of names with both high and low valuations on our quarterly list.
Bespoke’s Triple Play Report highlights companies that have recently reported earnings triple plays, and it features commentary from management on triple-play conference calls, company descriptions and analysis, and price charts. Bespoke’s Triple Play Report is available at the Bespoke Institutional level only. You can sign up for Bespoke Institutional now and receive a 14-day trial to read this week’s Triple Play Report, which features 14 stocks. To sign up, choose either the monthly or annual checkout link below:
Bespoke Institutional – Monthly Payment Plan
Bespoke Institutional – Annual Payment Plan

Nasdaq Leaves the S&P in the Dust
Looking at the major US index ETF screen of our Trend Analyzer shows just how disconnected the Nasdaq 100 (QQQ) has become from other major index ETFs recently. As shown below, as of Friday’s close, QQQ actually finished in overbought territory (over 1 standard above its 50-DMA) whereas many other major index ETFs were oversold, some of those to an extreme degree. On a year to date basis, the Nasdaq 100 (QQQ) has rallied more than 14% compared to low single digit gains or losses for the rest of the pack.

Historically, the major indices, namely the S&P 500 and Nasdaq, tend to trade at similar overbought and oversold levels. In the chart below we show the Nasdaq 100 and S&P 500’s distance from their 50-DMAs (expressed in standard deviations) over the past five years. As shown, typically the two large cap indices have seen similar albeit not identical readings. That is until the past few weeks in which the two have diverged more significantly.

On Friday there was more than 2 standard deviations between the Nasdaq’s overbought 50-DMA spread and the S&P 500’s oversold spread. As shown in the chart below, that surpassed recent highs in the spread like the spring of 2020 to set the highest reading since October 2016.
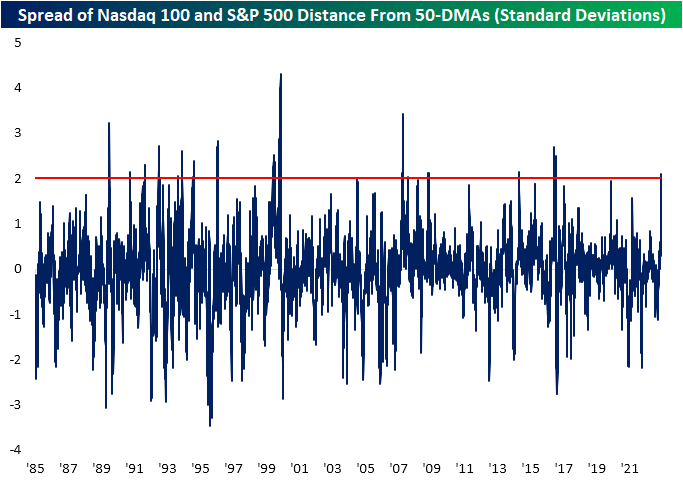
Going back to 1985, the spread between the Nasdaq and S&P 500 50-DMA spreads diverging to such a degree is not without precedent, but it is also not exactly common. Friday marked the 16th time that spread eclipsed 2 standard deviations for the first time in at least 3 months. Relative to those prior instances, the current overbought and oversold readings in both the S&P 500 and Nasdaq are relatively middling. However, only the instance in early 2000 similarly saw the Nasdaq technically overbought (trading at least a standard deviation above its 50-DMA) while the S&P 500 was simultaneously oversold (at least one standard deviation below its 50-DMA). Click here to learn more about Bespoke’s premium stock market research service.
Bespoke’s Morning Lineup – 3/20/23 – “Merger” Sunday
See what’s driving market performance around the world in today’s Morning Lineup. Bespoke’s Morning Lineup is the best way to start your trading day. Read it now by starting a two-week trial to Bespoke Premium. CLICK HERE to learn more and start your trial.
“You’re finished…When you’re down by half, people figure you can go down all the way. They’re going to push the market against you.” Vinny Mattone, When Genius Failed: The Rise and Fall of Long-Term Capital Management
Below is a snippet of content from today’s Morning Lineup for Bespoke Premium members. Start a two-week trial to Bespoke Premium now to access the full report.
After opening higher last night, futures gave up all of their initial gains and sold off sharply as Asia opened for trading. Shortly after the European open, though, buyers stepped back in and futures have rebounded back to the flat line. Outside of the Credit Suisse/UBS arranged marriage by Swiss Bank regulators that was announced on Sunday afternoon, there really hasn’t been much in the way of market-moving news, and there are no economic reports on the US calendar. Regional banks have been rallying, but First Republic (FRC) is down sharply again after it had its second ratings downgrade in a week.
In the press conference on Sunday discussing the shotgun ‘merger’ between Credit Suisse and UBS, regulators and officials of the banks cited the turmoil in the US banking sector as the reason for Credit Suisse’s demise. There’s always a need for a scapegoat, but to blame regional US banks for Credit Suisse’s downfall is a stretch. For now, let’s put aside the fact that just last week Credit Suisse announced an $8 billion loss in its delayed annual report. The bank noted that “the group’s internal control over financial reporting was not effective,” and its auditor PriceWaterhouse Coopers gave the bank an ‘adverse opinion’ with respect to the accuracy of its financial statements. Well before the SVB failure, Credit Suisse was already a dirty shirt.
Just look at the stock price. From its peak of over $77 per ADR in 2007, Credit Suisse (CS) has been in a long downtrend. After bottoming at just under $19 in early 209, the share price quickly tripled over the last six to seven months, but the bounce was short-lived. By 2012, the share price was back below its Financial Crisis lows and in the ensuing years, any rally attempt quickly ended with a lower high followed by a lower low. The collapse of SVB and stresses on other US banks may very well have been the straw that broke Credit Suisse’s back, but if the bank had proper internal controls in the first place maybe it would have noticed the pile of hay on its back in the first place.

Our Morning Lineup keeps readers on top of earnings data, economic news, global headlines, and market internals. We’re biased (of course!), but we think it’s the best and most helpful pre-market report in existence!
Start a two-week trial to Bespoke Premium to read today’s full Morning Lineup.
The Bespoke Report — Something Broke
This week’s Bespoke Report newsletter is now available for members. (Log in here if you’re already a subscriber.)
Back in September of 2022, we published a Bespoke Report entitled “Hike It ‘Til You Break It” (link). In that report we characterized the Powell Fed as seeming “committed to breaking either the financial system or economy…whichever it can mangle first”. Stocks made their major bear market low about three weeks later, on October 12th. The Fed Funds rate has been raised another 225 bps since that point, while the 2 year yield (a proxy for the Fed Funds rate a year ahead) went up another 90 bps to a peak of 5.07% on March 8th. The result? The Powell Fed absolutely broke something.
During the pandemic, enormous fiscal transfers and Federal Reserve QE of government bonds meant an enormous buildup of deposits in the banking system. Those deposits were created by either issuance of government bonds or by purchases of those bonds, financed by bank reserves which match with deposits. Banks faced with those massive inflows of deposits generally bought government bonds. Unable to invest in riskier securities or grow loans rapidly thanks to macroprudential regulation, banks were forced to buy low credit-risk government bonds.
While those bonds don’t have a credit risk, they do have duration risk. As long as banks aren’t forced to sell them thanks to ample deposits, they do not have to recognize a mark-to-market loss on those holdings. But for banks that are under deposit pressure, things can get out of hand quickly. Concentrated crypto deposits (like at Silvergate or Synchrony) or exposure to specific demographics (like at Silicon Valley Bank or to a lesser extent First Republic) that fled quickly led to stress and ultimately a need to wipe out equity, though for now the total losses remain unclear.
It remains to be seen whether this effort to break the financial system will have a large macro-economic feedback, but the Federal Reserve has certainly at least managed to create collateral damage via interest rate markets that has dominated headlines this week.
Continue reading this week’s Bespoke Report newsletter by starting a one-month trial, or click the image below to view our membership options page.

Nasdaq 100 Steadily Outperforms
Everywhere you look these days, you can find crazy things going on with the market. A case in point is the Nasdaq 100’s performance relative to the performance of the S&P 500. In early afternoon trading, the Nasdaq 100 is on pace for its 12th straight day of outperforming the S&P 500. That’s a streak that has only been exceeded two other times (July 2005 and July 2017) since 1996, and there have only been a total of six streaks where the Nasdaq 100 outperformed the S&P 500 for ten or more trading days.

During this 12-day span of outperformance for the Nasdaq 100, it has rallied 4.7% compared to a decline of 0.73% for the S&P 500 for a gap of 5.4%. That may sound like a pretty wide spread, but it has hardly been out of the norm in the post-COVID period. As shown in the chart below, there have been several times over the last three years where the 12-day performance spread has been as high or higher than it is now. During the post-Financial Crisis period from 2010 up until the end of 2019, the spread oscillated in a relatively tight range. Before that, though, the performance spread between the two indices was also routinely as large as it is now, especially in the late 1990s and early 2000s when it dwarfed the current range. While the steady pace of days where the Nasdaq 100 has outperformed the S&P 500 has been unusual, the performance gap between the two has been anything but. Click here to learn more about Bespoke’s premium stock market research service.

Bespoke’s Morning Lineup – 3/17/23 – An Irish Morning
See what’s driving market performance around the world in today’s Morning Lineup. Bespoke’s Morning Lineup is the best way to start your trading day. Read it now by starting a two-week trial to Bespoke Premium. CLICK HERE to learn more and start your trial.
“Being Irish, he had an abiding sense of tragedy, which sustained him through temporary periods of joy.” —William Butler Yeats
Below is a snippet of content from today’s Morning Lineup for Bespoke Premium members. Start a two-week trial to Bespoke Premium now to access the full report.
President Eisenhower once said that everyone is Irish on St. Patrick’s Day, and most investors probably consider themselves Irish today. Even on a good day like yesterday, they can’t shake the feeling that there’s still more pain to come, especially heading into another weekend. Maybe that just comes with the territory after a year-long bear market, a war in Europe, and the most aggressive Fed tightening cycle since the early eighties. But a banking crisis is only the newest entry on to the growing list of worries.
Futures are in the red this morning and have been drifting lower all morning ahead of a busy day for economic data. European stocks opened higher, and traded up over 1%, but are now in the red. At 9:15, we’ll get updates on Industrial Production and Capacity Utilization for February, and then at 10 AM, we’ll close out the week with Leading Indicators and Michigan Confidence. Leading indicators have been in recessionary territory for months now, and in the Michigan report, the key area of focus will be inflation expectations following the NY Fed’s update earlier this week which showed a significant decline in one- and three-year inflation expectations.
Given it’s St Patrick’s Day, it’s an appropriate time to highlight the stocks deepest in the green this year that investors would be the luckiest to have in their portfolios. The table below lists the 20 stocks in the S&P 500 that are up the most YTD. Topping the list, NVIDIA (NVDA) and Meta (META) have already rallied 70% in the first two and a half months of the year. After these two stocks, eight others are up over 40%, and all 20 are up over 25% on the year. Looking at where each of these stocks is trading relative to their trading ranges, most are at overbought levels, but there are a handful like Tesla (TSLA), Warner Bros (WBD), Royal Caribbean (RCL), and Wynn Resorts (WYNN) that are trading relatively close to or even below their 50-day moving averages.
Usually, when you look at a list of best (or worst) performing stocks in an index, smaller names dominate the list as they are the most prone to large swings in either direction. What stands out about this list is the fact that some of the best performers are also among the largest stocks in the index. The two top performers – NVDA and META – both have market caps of more than $500 billion, and when you take Tesla (TSLA) into account, three of the top four have market caps of greater than $500 billion. Lastly, of the top ten performers, half of them have market caps of over $100 billion. In other words, these are some big leprechauns!

Our Morning Lineup keeps readers on top of earnings data, economic news, global headlines, and market internals. We’re biased (of course!), but we think it’s the best and most helpful pre-market report in existence!
Start a two-week trial to Bespoke Premium to read today’s full Morning Lineup.
Claims Come in Strong
After disrupting the trend of lower readings last week, this week’s reading on initial jobless claims returned to improvements as the print totaled 192K. That means eight of the last nine weeks have seen claims come in below 200K as the indicator continues to show a historically healthy labor market.
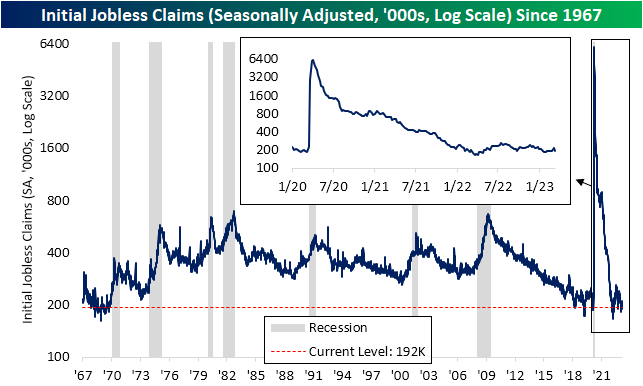
Before seasonal adjustment, claims are sitting at 217.4K. That marked a slight decline from 238.8K the previous week and little change versus the comparable week last year. From this point of the year, based on seasonal patterns claims are likely to continue falling through the spring albeit at a slower rate than what has been observed over the past few months.

Not only were initial claims strong, but so too were continuing claims. The seasonally adjusted number fell back into the 1.6 million range after topping 1.7 million (the highest level since mid-December) last week. Like initial claims, continuing claims remain at healthy levels consistent with the few years prior to the pandemic. Click here to learn more about Bespoke’s premium stock market research service.
