Bespoke’s Consumer Pulse Report — April 2023
Bespoke’s Consumer Pulse Report is an analysis of a huge consumer survey that we run each month. Our goal with this survey is to track trends across the economic and financial landscape in the US. Using the results from our proprietary monthly survey, we dissect and analyze all of the data and publish the Consumer Pulse Report, which we sell access to on a subscription basis. Sign up for a 30-day free trial to our Bespoke Consumer Pulse subscription service. With a trial, you’ll get coverage of consumer electronics, social media, streaming media, retail, autos, and much more. The report also has numerous proprietary US economic data points that are extremely timely and useful for investors.
We’ve just released our most recent monthly report to Pulse subscribers, and it’s definitely worth the read if you’re curious about the health of the consumer in the current market environment. Start a 30-day free trial for a full breakdown of all of our proprietary Pulse economic indicators.

Bespoke’s Morning Lineup – 4/5/23 – The Streak Ends
See what’s driving market performance around the world in today’s Morning Lineup. Bespoke’s Morning Lineup is the best way to start your trading day. Read it now by starting a two-week trial to Bespoke Premium. CLICK HERE to learn more and start your trial.
“He was sitting over there, waiting like a possum for something to happen.” – Joe Torre

Below is a snippet of content from today’s Morning Lineup for Bespoke Premium members. Start a two-week trial to Bespoke Premium now to access the full report.
Futures are indicating another weaker open this morning after this morning’s weaker-than-expected ADP Private Payrolls report. In what is a big week for employment data, we’re currently 0-2 (weaker than expected JOLTS and ADP) with jobless claims on deck tomorrow and the Non-Farm Payrolls report in the hole on Friday.
September 20th, 1998 seemed like just a normal night in Baltimore. Heading into the last home game of the season, the Orioles were just two games over .500 and out of the post-season with only the Devil Rays separating them from last place. For most fans, the only reason to go to the game was that they were playing the Yankees who were having one of the best regular seasons of all time and on their way to sweeping the Padres in the World Series. Plus, it was a good weather night for baseball with temperatures in the high 60s. What fans heading into Camden Yards that night didn’t know was that they would leave with an unforgettable memory. No, it wasn’t bobblehead night. It was even better as one of the most iconic records in sports came to an end as Cal Ripken pulled himself from the lineup and ended his iron-man streak of 2,632 consecutive games.
Compared to the environment three years earlier when Lou Gehrig’s ‘unbreakable’ streak of 2,130 games that stood for 56 years was broken, there wasn’t much celebration around the end of Ripken’s streak. The Yankees did come out of the dugout to tip their cap to Ripken and the fans gave him a standing ovation and two curtain calls. But while the whole country watched as Ripken broke the streak in 1995, most Americans didn’t find out about the streak ending until the next morning. The Orioles ended up losing 5-4 as ‘El Duque’ notched his 11th win and the 107th for the Yankees.
In the markets yesterday another record streak ended with even less fanfare than Ripken’s, and chances are that even the morning after, you never even knew about it. After yesterday’s weak economic data, the 10-year yield finished the day at 3.34% which was its lowest close since early last September, marking the first time that the 10-year Treasury yield closed at a six-month low since – wait for it – August 2020! That 664-trading day stretch without a six-month closing low in the 10-year yield was the longest streak in the history of the data going back to at least 1962.
Admittedly, this was a much more obscure streak than Gehrig’s ‘unbreakable’ streak that stood in place for 56 years, but this was something that hasn’t been done in at least 61 years. Also, when you think about it, a run in the 10-year yield that kept it from closing at a six-month low for nearly three years definitely had more of a real-world impact on the lives of Americans (and people around the world for that matter) than any streak of Gehrig’s, Ripken’s, or anyone else who follows them.

Our Morning Lineup keeps readers on top of earnings data, economic news, global headlines, and market internals. We’re biased (of course!), but we think it’s the best and most helpful pre-market report in existence!
Start a two-week trial to Bespoke Premium to read today’s full Morning Lineup.
Gold Back at 52-Week Highs
Gold has been trending higher since the fall, and after a retracement earlier this year, the past month has seen the yellow metal surge by over 12% to reach new 52-week highs on an intraday and closing basis as it moves back above the March 20th intraday high.

Not only is gold at a 52-week high, but it is at the highest level since March 2022. That was when gold spiked higher to come up just short of the August 2020 high. In other words, the recent rally in gold has been significant, but leaves it short of a critical resistance level to watch.

While the post-pandemic highs have yet to be taken out, the fact that the commodity has reached a 52-week high is at least promising based on historical performance. In the charts below we show the average performance of front-month gold after the first 52-week highs (on an intraday basis) in at least two weeks. As shown, near-term performance is nothing to write home about with one-week returns that are basically right in line with the norm for performance since 1975. From there, returns tend to get much stronger with a higher consistency of gains to boot. Longer run returns like six months to one year out are particularly impressive with average gains that are more than double that of the average gain for all periods. As always, past performance is no guarantee of futures results.

Have you tried Bespoke All Access yet?
Bespoke’s All Access research package is quick-hitting, actionable, and easily digestible. Bespoke’s unique data points and analysis help investors better visualize underlying market trends to ultimately make more informed investment decisions.
Our daily research consists of a pre-market note, a post-market note, and our Chart of the Day. These three daily reports are supplemented with additional research pieces covering ETFs and asset allocation trends, global macro analysis, earnings and conference call analysis, market breadth and internals, economic indicator databases, growth and dividend income stock baskets, and unique interactive trading tools.
Click here to sign up for a one-month trial to Bespoke All Access, or you can read even more about Bespoke All Access here.

Bespoke’s Morning Lineup – 4/4/23 – Ctrl+Alt+Del
See what’s driving market performance around the world in today’s Morning Lineup. Bespoke’s Morning Lineup is the best way to start your trading day. Read it now by starting a two-week trial to Bespoke Premium. CLICK HERE to learn more and start your trial.
“We always overestimate the change that will occur in the next two years and underestimate the change that will occur in the next ten.” – Bill Gates
Below is a snippet of content from today’s Morning Lineup for Bespoke Premium members. Start a two-week trial to Bespoke Premium now to access the full report.
We’re looking at a modestly positive start to the trading day with overseas markets leading futures higher. The Reserve Bank of Australia announced a pause in its rate hiking cycle, and PPI fell more than expected in the Eurozone, and inflation expectations in the region slowed from 6.2% down to 5.8%.
48 years ago today, a college dropout and a computer programmer in Boston started one of the most successful business stories in US history. The number of millionaires minted from “Micro-Soft’s” founding in 1975 is nowhere near the number of ‘blue screens of death’ and subsequent airborne staplers flying across the room that its software has caused, but when it comes to money printing presses, they don’t get much more efficient than Microsoft (MSFT). With its market cap of just over $2 trillion, Microsoft is now the second-largest company in the US. To put it another way, $10,000 invested in MSFT stock on the day of the IPO would be worth A LOT more today – like, 20 million more.
The chart below shows the rolling 10-year price performance of MSFT stock since 1996 (ten years after the company went public). The early years for the company were a great time to be a stockholder or a Microsoft employee with stock options, but the heady days of gains came to an end in the early 2000s when the US government launched its antitrust suit against the company. After a judge originally ruled that Microsoft violated parts of the Sherman Antitrust Act, the company later won on appeal, and the verdict was overturned. Microsoft may have won in the courtroom, but it was losing in the stock market. The stock’s rolling 10-year returns plummeted throughout the early 2000s and even went negative for the first time in its history during the financial crisis.

Looking just at the last twenty years, the last decade has been another golden era for the stock, in what has been a legendary reinvention of the company. It’s hard enough to lead one major industry trend, but to completely change your business model and do it again is rare indeed. While the chart above makes it look as though returns for the stock have continued to languish in the last ten years, that’s only because of the perspective of the stock’s returns during the 1990s. As late as 2021, the stock’s rolling 10-year return was a gain of over 1,200%. Even after the market turmoil of the last year or so, MSFT stock is still up over 900% in the last ten years which works out to an annualized gain of 25%. Yup 25%! Feel free to run the numbers in Excel yourself or just go over to Bing and ask GPT.
Another lesson of Microsoft’s stock performance over the last several decades is the power of compounding and the fact that sometimes, the best action is no action. An investor frustrated with the stock’s performance in the early 2000s could have easily sold the stock to chase the next best thing. Not only would they have taken a major tax hit on their gains, but by switching, they would have missed out on what has been a stock run unequaled by the vast majority of other publicly traded stocks. That doesn’t mean that you should always stick with an underperforming position, but if you are going to make a move, you want to be as sure as possible that the alternative is a better option.

Our Morning Lineup keeps readers on top of earnings data, economic news, global headlines, and market internals. We’re biased (of course!), but we think it’s the best and most helpful pre-market report in existence!
Start a two-week trial to Bespoke Premium to read today’s full Morning Lineup.
Bespoke Market Calendar — April 2023
Please click the image below to view our April 2023 market calendar. This calendar includes the S&P 500’s historical average percentage change and average intraday chart pattern for each trading day during the upcoming month. It also includes market holidays and options expiration dates plus the dates of key economic indicator releases. Click here to view Bespoke’s premium membership options.

The Last Shall Be First and the First Shall Be Last
In our newest Bespoke Report sent to Bespoke subscribers last Friday, we analyzed the stock characteristics that drove performance in Q1 2023. Along with characteristics like valuations, short interest, and analyst ratings, one of the biggest things to impact performance in Q1 seemed to be how a stock performed during the downturn we saw in 2022.

Taking a closer look, in the chart below we’ve broken up the S&P 500 into deciles (10 groups of 50 stocks each) based on how stocks performed in 2022. Decile 1 contains the 50 stocks that performed the best in 2022, decile 2 contains the 50 next best, and so on and so forth until you get to decile 10, which contains the 50 stocks that did the worst in 2022. As shown below, the three deciles containing the 150 best performing stocks in 2022 all averaged declines in Q1. On the flip side, the stocks in the decile containing the worst performers in 2022 averaged a huge gain of 16.8% in Q1 2023. Q1 really was a mirror of what we saw in 2022. Investors that looked at their portfolios at the end of 2022 and decided to shift out of the year’s losers and into the year’s winners only ended up feeling more pain in Q1. The correct approach would have been to shift out of last year’s winners and into last year’s losers.

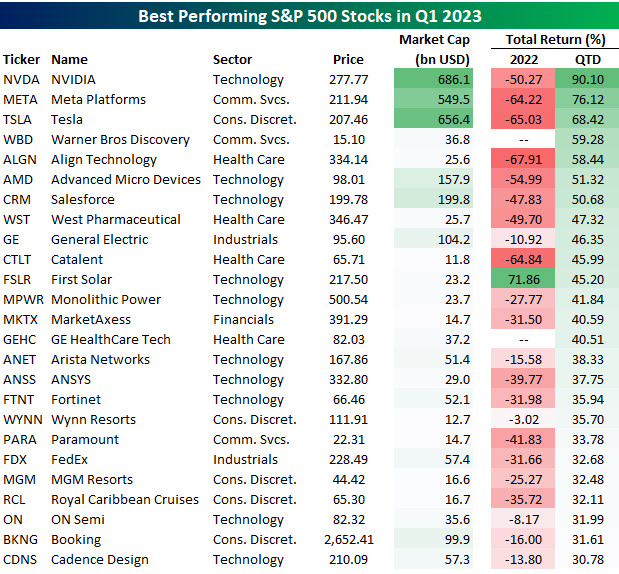
With Q1 2023 now in the books, below is a table of the S&P 500 stocks that gained the most over the first three months of the year. NVIDIA (NVDA) came out on top with a gain of 90.1%, followed by Meta (META) at +76.1% and Tesla (TSLA) at +68.4%. Other notables on the list of winners include Salesforce (CRM), General Electric (GE), First Solar (FSLR), GE HealthCare (GEHC), Arista Networks (ANET), Wynn Resorts (WYNN), FedEx (FDX), and Royal Caribbean (RCL).
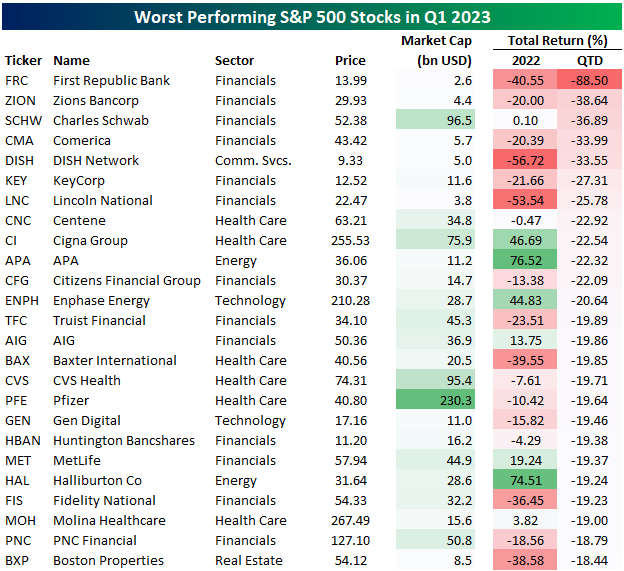
The list of the first quarter’s biggest losers in the S&P 500 is made up of plenty of banks that got caught up in the deposit flight that ultimately took down SVB (SIVB) and Signature Bank (SBNY) — which were also both in the S&P 500 before their abrupt removals in mid-March.
As we move into April and the start of Q2, give our newest Bespoke Report a read for an analysis of how the market is positioned for the months ahead. You can read the Bespoke Report and everything else we publish on a daily basis with a new Bespoke All-Access membership.
Bespoke’s All Access research package is quick-hitting, actionable, and easily digestible. Bespoke’s unique data points and analysis help investors visualize underlying market trends to ultimately make more informed investment decisions.
Our daily research consists of a pre-market note, a post-market note, and our Chart of the Day. These three daily reports are supplemented with additional research pieces covering ETFs and asset allocation trends, global macro analysis, earnings and conference call analysis, market breadth and internals, economic indicator databases, growth and dividend income stock baskets, and unique interactive trading tools.
Click here to sign up for a one-month trial to Bespoke All Access, or you can read even more about Bespoke All Access here.
Bespoke’s Morning Lineup – 4/3/23 – Oil Gushes
See what’s driving market performance around the world in today’s Morning Lineup. Bespoke’s Morning Lineup is the best way to start your trading day. Read it now by starting a two-week trial to Bespoke Premium. CLICK HERE to learn more and start your trial.
“Man himself is the beginning and the end of every economy.” – Carl Menger
Below is a snippet of content from today’s Morning Lineup for Bespoke Premium members. Start a two-week trial to Bespoke Premium now to access the full report.
Equities are poised to open right around the unchanged level this morning as crude oil is surging following news of the OPEC+ production cut over the weekend. Within the market, though, there’s a lot of dispersion as energy stocks are surging while tech stocks have been under pressure on concerns that higher oil prices will push inflation higher and keep the Fed on the warpath to hike rates for longer.
The surprise production cut from OPEC+ over the weekend has both oil prices and oil-related stocks rallying this morning as the S&P 500 Energy sector ETF (XLE) is set to gap up over 4%. As mentioned above, the S&P 500 is treading water after last week’s surge and is poised to open around the unchanged level. While energy stocks are notoriously volatile, this morning is set to be just the ninth time since 2000 that XLE has gapped up at least 3% even as the S&P 500 ETF (SPY) gapped down or up less than 0.5%.
The first chart below shows the performance of SPY over the last ten years (a period that covers all the occurrences mentioned above) with the red dots indicating each of the days that XLE gapped up 3%+ while the S&P 500 was basically flat or down at the open. More than half of these occurrences (5) occurred in a three-month span from April to June 2020 with another occurrence last February and the other two occurrences back in 2019 and 2016. While the most recent occurrence was followed by weakness, the S&P 500 rallied immediately following the prior occurrences.

Below we show a similar chart for the Energy sector. Here, forward returns were more mixed. The most positive period was after the most recent occurrence, but forward returns following each of the pre-COVID occurrences were weaker.

Our Morning Lineup keeps readers on top of earnings data, economic news, global headlines, and market internals. We’re biased (of course!), but we think it’s the best and most helpful pre-market report in existence!
Start a two-week trial to Bespoke Premium to read today’s full Morning Lineup.
Bespoke Brunch Reads: 4/2/23
Welcome to Bespoke Brunch Reads — a linkfest of the favorite things we read over the past week. The links are mostly market related, but there are some other interesting subjects covered as well. We hope you enjoy the food for thought as a supplement to the research we provide you during the week.
While you’re here, join Bespoke Premium with a 30-day trial!
ChatGPT
The Jobs Most Exposed to ChatGPT by Lauren Weber and Lindsay Ellis (WSJ)
UPenn and ChatGPT’s overseers predict one-fifth of the US workforce is at risk of being displaced by so-called artificial intelligence programs like ChatGPT. [Link; paywall]
Italy temporarily bans ChatGPT over privacy concerns by Madhumita Murgia and Silvia Sciorilli Borrelli (FT)
National data protection authorities in Italy have moved to temporarily ban the software until it can determine whether the software does enough to protect privacy. [Link; paywall]
Real Estate
He Wasn’t Thinking About Renting His Arizona Home. Then Rihanna Came Knocking. by E.B. Solomont (WSJ)
The owner of a one-acre five bedroom near Phoenix didn’t plan to be a landlord, but when a $500k offer (almost 7% of the value of the house) to rent it for a week came in from Rihanna, how could he say no? [Link; paywall]
Some Guy Bought the Flatiron Building and Didn’t Pay for It (Hell Gate)
The iconic Flatiron Building sold for $190mm, but the buyer immediately defaulted by failing to make the $19mm down payment required to close the transaction. [Link]
Disney
Disney cuts metaverse division as part of broader restructuring by Rebecca Bellan (TechCrunch)
As part of an effort to boost profitability after over-investing in streaming, Disney will completely eliminate the division it had staffed up to focus on the metaverse. [Link]
Demographics
Social Security Reserves Projected to Run Out Earlier Than Expected by David Harrison (WSJ)
A new estimate projects that the Social Security’s trust fund will be consumed in 2034, with incoming payments only covering about 80% of outgoing payments. The issue also impacts Medicare, and both programs could rely on transfers from the government’s general fund or changes in payrolls taxes or benefits to allow full payments to continue. [Link; paywall]
Why are Americans dying so young? by John Burn-Murdoch (FT)
While the US enjoys drastically higher standards of living when measured by income and purchasing power, other metrics measuring well-being like life expectancy are almost unbelievably worse. [Link; paywall]
Speculators
‘Degenerate Gambling’ in Zero-Day Options Thrills Retail Traders by Claire Ballentine and Charlie Wells (Bloomberg)
The fastest-growing derivatives markets in finance can be found in options which exist for less than a day, giving them a unique degree of leverage to underlying stocks. [Link; soft paywall]
Star-Led Hedge Funds Hit by Steep Losses, Stunting Their Comeback by Nishant Kumar (Bloomberg)
Macro-oriented hedge funds which saw returns soar last year and have broadly performed well in the post-COVID environment have gotten positively torched by the latest banking stress-driven swing in interest rates. [Link; soft paywall]
Billionaire Whimsy
Can a billionaire die without anyone noticing? by Tim Fernholz (Quartz)
A $7bn collection of estate and gift taxes on February 28th was the largest for a single day since at least 2005. If that whole collection came from one source, it would imply an estate or gift of more than $17bn. [Link]
TikTok
Two New Bills on TikTok and Beyond: The DATA Act and RESTRICT Act by Justin Sherman (Lawfare)
Legal analysis of two bills attempting to ban TikTok in the US, with one including a much broader protectionist framework that would turn anyone accessing banned social media apps a felon with punishments of up to 20 years behind bars. [Link]
Visualizing California’s Water Storage – Reservoirs and Snowpack (Engaging Data)
With reservoirs filled above the typical year and an all-time record snowpack, California has more water on hand than at any point in the state’s history. [Link]
Read Bespoke’s most actionable market research by joining Bespoke Premium today! Get started here.
Have a great weekend!
The Bespoke Report — Equity Risk Gauge — March 2023
This week’s Bespoke Report newsletter is now available for members.
In this week’s newsletter, we’ve updated our Equity Market Risk Gauge for the month of March, and we also take a look at market technicals, inflation stats, Q1 performance numbers, April seasonality, and what’s on tap for the coming weeks.
To see our updated Equity Risk Gauge and access everything else Bespoke’s research platform has to offer, join Bespoke Institutional and get half off for the first three months!


Bespoke’s Morning Lineup – 3/31/23 – That’s a Wrap
See what’s driving market performance around the world in today’s Morning Lineup. Bespoke’s Morning Lineup is the best way to start your trading day. Read it now by starting a two-week trial to Bespoke Premium. CLICK HERE to learn more and start your trial.
“Good publicity is preferable to bad, but from a bottom-line perspective, bad publicity is sometimes better than no publicity at all. Controversy, in short, sells.” – Donald Trump
Below is a snippet of content from today’s Morning Lineup for Bespoke Premium members. Start a two-week trial to Bespoke Premium now to access the full report.
A bunch of economic data just hit the tape and it was generally better than expected. Personal Income was slightly better than expected (0.3% vs 0.2%) while Personal Spending was a little weaker (0.3% vs 0.2%). On the inflation front, Core PCE came in lower than expected on both a month-over-month and year-over-year basis. The m/m reading came in at 0.3% versus forecasts for an increase of 0.4% while the y/y reading was also a tenth lower than expected at 4.6%. In response, futures, which were already higher, added a little bit to their gains.
What an interesting quarter it’s been for the stock market. While the S&P 500 is up 5.5%, the Russell 2000 is barely hanging on to gains, and the Dow is actually slightly lower. These all pale in comparison to the Nasdaq which is up 14.8% and the Nasdaq 100 which is up an unbelievable 18.5%. If these gains hold through the end of today, Q1 will go down as the best quarter for the Nasdaq 100 since Q2 2020, and it will mark the 21st quarter in the Nasdaq 100’s history (since 1985) that the index was up at least 15%.
Of the 20 prior quarters where the Nasdaq 100 was up 15%+, its median performance in the following quarter was a gain of 6.1% with positive returns 65% of the time. That compares to an average gain of 4.0% with positive returns 68.4% of the time in all quarters since 1985. When the 15%+ gain occurred in Q1, however, forward returns weren’t as positive. In those six quarters, the median performance in Q2 was a decline of 1.2% with gains just half of the time while the median rest of year gain was 7.5% also with positive returns half of the time. Before reading too much into these numbers, though, we would caution that returns were all over the map. In terms of the rest of year performance, 97 percentage points separate the best (50.4% in 1998) and worst performances (-46.8% in 2000).

Looking at the Nasdaq 100 ETF’s (QQQ) price chart shows an interesting picture depending on your perspective. In the short run, QQQ broke above resistance this week and traded to its highest level since Powell’s Jackson Hole speech in late August. It has also carved out what technicians would describe as a bullish cup and handle formation.

Longer-term, QQQ’s rally has taken it to levels that once acted as support back in the first half of 2021 and Q1 2022. Since that Q1 2022 period there have only been a handful of days that QQQ traded above these levels, and two other times it attempted to make a break of that level it immediately pulled back.

Our Morning Lineup keeps readers on top of earnings data, economic news, global headlines, and market internals. We’re biased (of course!), but we think it’s the best and most helpful pre-market report in existence!
Start a two-week trial to Bespoke Premium to read today’s full Morning Lineup.