Bespoke’s Morning Lineup – 4/20/23 – Claims High, Philly Blunted
See what’s driving market performance around the world in today’s Morning Lineup. Bespoke’s Morning Lineup is the best way to start your trading day. Read it now by starting a two-week trial to Bespoke Premium. CLICK HERE to learn more and start your trial.
“Computers are magnificent tools for the realization of our dreams, but no machine can replace the human spark of spirit, compassion, love, and understanding.” – Lou Gerstner

Below is a snippet of content from today’s Morning Lineup for Bespoke Premium members. Start a two-week trial to Bespoke Premium now to access the full report.
There was nothing especially insightful or controversial about the above quote from Lou Gerstner, former Chairman and CEO of IBM, when he made it years ago, and it has been applicable for the entire history of computers – that is until now. With the rise of AI tools, whether computers have sentience has become a topic of debate, and as the technology improves, those on the side that believes computers can in fact express compassion, love, and understanding will only grow.
You can ponder what computers with feelings will mean for mankind later (maybe, if you observe, as you celebrate 4/20 day later on), but for now, we have the thick of earnings season to deal with, and this morning, investors aren’t particularly pleased with what they see. The major driver of market weakness this morning is Tesla (TSLA) which is down over 7% after reporting weaker-than-expected margins.
Outside of TSLA yesterday, most earnings reports after the close were better than expected with three-quarters of companies reporting topping EPS forecasts. This morning has been another story, though, as only half of the companies reporting have beat estimates on the bottom line. One trend that could be weighing on markets this morning is guidance. Since yesterday’s close, eight companies have lowered guidance while just two (Calix Networks and D.R. Horton) have managed to raise guidance. It’s only a one-day snapshot, but if it becomes a more persistent trend, it would be a cautionary sign for the economy.
Economic data just released showed that jobless claims came in higher than expected on both an initial and continuing basis, and both are either at or near 52-week highs. The Philly Fed report on manufacturing also came in much weaker than expected and fell to a post-Covid low. Not only that but Prices Paid also dropped sharply falling to its lowest level since June 2020 while Prices Received actually went negative for the first time since May 2020. Later on, we’ll get updates on Existing Home Sales and Leading Indicators.
Related to the broader economy, crude oil just can’t seem to trade and stay above $80 per barrel. Earlier this month, it looked like crude would finally get the push it needed to get there when OPEC+ announced its surprise production cut. In immediate response to that news, prices spiked from the mid $70 to above $80 per barrel, but then completely stalled and traded in a sideways range through the Easter holiday. The fact that there was no follow-through to the announcement was a warning sign.
After Easter, prices traded to build on their gains from earlier in the month, but any upside was completely squashed at the 200-day moving average (DMA) this week. Yesterday, crude oil traded back down below $80 per barrel, and this morning, it is trading down even further and within a dollar of its 50-DMA. The fact that prices can’t catch and hold on to a bid for more than a few days doesn’t say much for the fundamental backdrop of crude.

Our Morning Lineup keeps readers on top of earnings data, economic news, global headlines, and market internals. We’re biased (of course!), but we think it’s the best and most helpful pre-market report in existence!
Start a two-week trial to Bespoke Premium to read today’s full Morning Lineup.
Fixed Income Weekly: 4/19/23
Searching for ways to better understand the fixed income space or looking for actionable ideas in this asset class? Bespoke’s Fixed Income Weekly provides an update on rates and credit every Wednesday. We start off with a fresh piece of analysis driven by what’s in the headlines or driving the market in a given week. We then provide charts of how US Treasury futures and rates are trading, before moving on to a summary of recent fixed income ETF performance, short-term interest rates including money market funds, and a trade idea. We summarize changes and recent developments for a variety of yield curves (UST, bund, Eurodollar, US breakeven inflation and Bespoke’s Global Yield Curve) before finishing with a review of recent UST yield curve changes, spread changes for major credit products and international bonds, and 1 year return profiles for a cross section of the fixed income world.
In this week’s report, we dive in to bank exposure to CRE.

Our Fixed Income Weekly helps investors stay on top of fixed-income markets and gain new perspectives on the developments in interest rates. You can sign up for a Bespoke research trial below to see this week’s report and everything else Bespoke publishes free for the next two weeks!
Click here and start a 14-day free trial to Bespoke Institutional to see our newest Fixed Income Weekly now!
Bespoke’s Morning Lineup – 4/19/23 – Financials and Everyone Else
See what’s driving market performance around the world in today’s Morning Lineup. Bespoke’s Morning Lineup is the best way to start your trading day. Read it now by starting a two-week trial to Bespoke Premium. CLICK HERE to learn more and start your trial.
“If you want to build a ship, don’t drum up the people to gather wood, divide the work, and give orders. Instead, teach them to yearn for the vast and endless sea.” – Reed Hastings
Below is a snippet of content from today’s Morning Lineup for Bespoke Premium members. Start a two-week trial to Bespoke Premium now to access the full report.
Investors and traders are taking a breather this morning as they digest the latest round of earnings results. A higher-than-expected inflation print in the UK has contributed to the negative tone. Gold, oil, and bitcoin are also trading moderately lower as yields rise in what to this point has been a risk-off environment so far this morning.
It’s still early in earnings season, but we wonder if the batch of earnings since yesterday’s close will be a trend. Of the 23 companies reporting earnings since Tuesday’s close, 65% have exceeded EPS forecasts while just 55% have topped sales estimates. Neither of those rates is exceptionally strong, and the 55% revenue beat rate is weak.
Breaking down the numbers a little bit, though, shows an entirely different picture. Of the eight companies that reported weaker-than-expected EPS, all eight of them were from the Financials sector. In other words, ex Financials, the EPS beat rate was 100%. You can’t get much better than that! In terms of sales, the beat rate wasn’t as strong, but it was still 70%. It’s only one day, but if you’re a bear, the wave of weaker results has started to show up in full force- except it has only been evident in one sector. If that weakness remains ringfenced to the Financials, bulls may stay in the driver’s seat.

Our Morning Lineup keeps readers on top of earnings data, economic news, global headlines, and market internals. We’re biased (of course!), but we think it’s the best and most helpful pre-market report in existence!
Start a two-week trial to Bespoke Premium to read today’s full Morning Lineup.
Sector Breadth All Over the Place
In terms of price, the Industrials sector remains 5.75% below its high from January of last year and has yet to even take out the highs from earlier this year, but breadth has been more constructive recently. Just yesterday, the sector’s cumulative advance/decline line—the cumulative sum of the sector’s daily difference in the number of advancing and declining stocks—hit a new all time high.
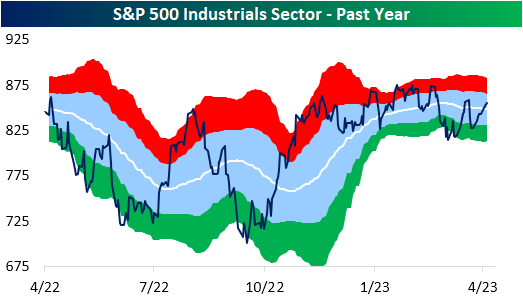

Although that measure of breadth is making promising moves, other breadth measures have not exactly echoed that strength. In spite of the record high in the cumulative A/D line Monday, only 37% of the sector’s stocks finished above their 50-DMAs. As shown below, of all other instances of a record high in the cumulative AD line, there has never been such a low reading in the percentage of stocks above their 50-DMAs. In fact, no other readings have even crossed into the 30% range! For the vast majority of previous highs, the percentage of stocks above their 50-DMAs has sat at 70% or more.

All that is to say that most Industrials sector stocks are moving higher, but have not yet moved above potential resistance at their 50-DMAs. And even though the reading on the percentage of stocks above their 50-DMAs is low at the moment, that is not to say it is not improving rapidly. As shown below, it has risen sharply from the low of 19.18% on April 6th. Furthermore, whereas Monday’s close only saw 37% of the sector finish above their 50-DMAs, as of mid-morning Tuesday, the reading is already up another 8.2 percentage points to 45.2% as the average stock in the sector trades just 7 bps below its 50-DMA.

Have you tried Bespoke All Access yet?
Bespoke’s All Access research package is quick-hitting, actionable, and easily digestible. Bespoke’s unique data points and analysis help investors better visualize underlying market trends to ultimately make more informed investment decisions.
Our daily research consists of a pre-market note, a post-market note, and our Chart of the Day. These three daily reports are supplemented with additional research pieces covering ETFs and asset allocation trends, global macro analysis, earnings and conference call analysis, market breadth and internals, economic indicator databases, growth and dividend income stock baskets, and unique interactive trading tools.
Click here to sign up for a one-month trial to Bespoke All Access, or you can read even more about Bespoke All Access here.

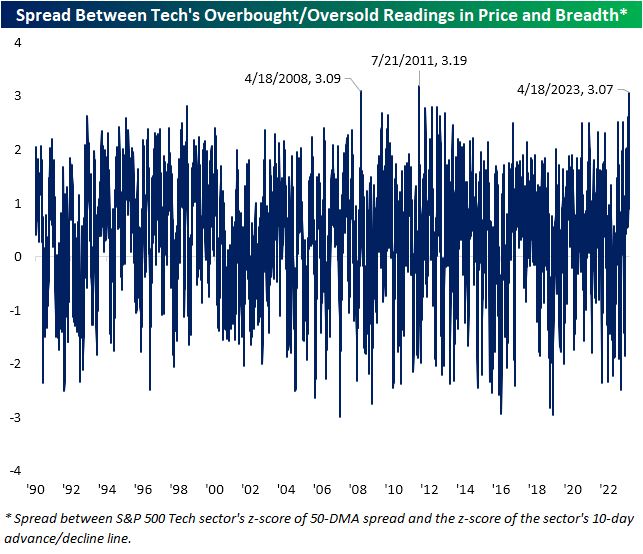
Historic Divergence in Tech Price and Breadth
Each day in our Sector Snapshot, we highlight the overbought and oversold readings of each S&P 500 sector based on price and breadth. For price, we consider a sector to be overbought when it trades at least one standard deviation above its 50-DMA and oversold when it is one standard deviation below its 50-DMA. For breadth, we look at the 10-day advance-decline line. Again, when the 10-day A/D line rises at least one standard deviation above its historical average, it can be considered overbought and vice versa.
The Tech sector is in an unusual place in which price has been overbought for the entirety of the past month while short-term breadth has dropped into oversold territory in the past two sessions.

Taking a spread of the two measures, that is nearly a record divergence. As shown below, there have only been two other times in which there has been a three-standard deviation difference between the overbought/oversold levels of price and breadth. The most recent of these was in July 2011 when similar to now, the sector traded over 1.4 standard deviations above its 50-DMA while the 10-day A/D line was over a standard deviation below its historical average. The other instance was exactly 15 years ago in April 2008. That time was slightly different in that price was extremely overbought trading 3 standard deviations above its 50-DMA while breath was neutral and only slightly negative.
Given the Tech sector has managed to perform well on unimpressive breadth, it would imply mega caps are buoying the market cap-weighted index.
Have you tried Bespoke All Access yet?
Bespoke’s All Access research package is quick-hitting, actionable, and easily digestible. Bespoke’s unique data points and analysis help investors better visualize underlying market trends to ultimately make more informed investment decisions.
Our daily research consists of a pre-market note, a post-market note, and our Chart of the Day. These three daily reports are supplemented with additional research pieces covering ETFs and asset allocation trends, global macro analysis, earnings and conference call analysis, market breadth and internals, economic indicator databases, growth and dividend income stock baskets, and unique interactive trading tools.
Click here to sign up for a one-month trial to Bespoke All Access, or you can read even more about Bespoke All Access here.
Bespoke’s Morning Lineup – 4/18/23 – Here Comes the Tax Man
See what’s driving market performance around the world in today’s Morning Lineup. Bespoke’s Morning Lineup is the best way to start your trading day. Read it now by starting a two-week trial to Bespoke Premium. CLICK HERE to learn more and start your trial.
“The income tax created more criminals than any other single act of government.” – Barry Goldwater
Below is a snippet of content from today’s Morning Lineup for Bespoke Premium members. Start a two-week trial to Bespoke Premium now to access the full report.
It’s a positive tone in the futures market this morning as the market builds on yesterday’s gains with some strong earnings reports from Bank of America (BAC), J&J (JNJ), and Lockheed Martin (LMT). It hasn’t all been sunshine and lollipops, though, as both Goldman Sachs (GS) and JB Hunt (JBHT) are down close to 4%. Coming up as we send this, we’ll get updates on Building Permits and Housing Starts at 8:30 Eastern.
Accountants across the country are breathing a sigh of relief this morning as they close the books on another tax season, although their relief is probably being drowned out by the collective swearing on the part of Americans who have taxes due. While today may be the worst day of the year for Americans who owe any taxes, it could get even worse for a lot of Americans this year as IRS plans to hire 87,000 new agents will inevitably lead to a lot more Americans being audited as well!
As bad as Tax Day may be for many Americans, seasonally it isn’t the worst time of year. In fact, over the last 25 years, the S&P 500 has been up in the week after the Federal Tax deadline 19 times for a median gain of 0.83%. That compares to a median gain of 0.31% with positive returns 57% of the time for all one-week periods over the last 25 years.

Our Morning Lineup keeps readers on top of earnings data, economic news, global headlines, and market internals. We’re biased (of course!), but we think it’s the best and most helpful pre-market report in existence!
Start a two-week trial to Bespoke Premium to read today’s full Morning Lineup.
Homebuilder Sentiment and Stocks Trend in Opposite Directions
Homebuilder sentiment from the National Association of Home Builders (NAHB) was updated this morning. As expected, the headline index rose from 44 in March to 45. Of the sub-indices, increases in both present and future sales drove the headline reading higher. While those readings remain relatively muted versus most of the past decade, it reiterates the modest improvement in sentiment we have seen this year. In fact, and as shown in the second chart below, homebuilder sentiment’s improvement over the past four months marks the longest streak of monthly increases since another streak lasting for four months that ended in December 2021.


As for the regional breakdown, sentiment in the Northeast and South was unchanged versus last month which leaves the indices in the middle of their historical ranges. The Midwest saw more substantial improvement rising by 3 points to the highest level since September. The West experienced an even more substantial increase of five points. That month-over-month increase ranks in the 85th percentile of all moves on record for that sub-index.

Although the NAHB’s reading on homebuilders has improved over the past few months, homebuilder stocks as proxied by the SPDR S&P Homebuilder ETF (XHB) have been trending lower since February. Recently, XHB has run up to its 50-DMA (which has begun to roll over) and the downtrend line off the aforementioned early February high. So far, XHB has failed to break out.

Have you tried Bespoke All Access yet?
Bespoke’s All Access research package is quick-hitting, actionable, and easily digestible. Bespoke’s unique data points and analysis help investors better visualize underlying market trends to ultimately make more informed investment decisions.
Our daily research consists of a pre-market note, a post-market note, and our Chart of the Day. These three daily reports are supplemented with additional research pieces covering ETFs and asset allocation trends, global macro analysis, earnings and conference call analysis, market breadth and internals, economic indicator databases, growth and dividend income stock baskets, and unique interactive trading tools.
Click here to sign up for a one-month trial to Bespoke All Access, or you can read even more about Bespoke All Access here.
Europe Treasure
For an area of the world that couldn’t have been considered less attractive last summer, European equities have been on a tear since the October lows. The Euro Stoxx 50 Europe ETF has now rallied more than 50% off its October lows and broke out to 52-week highs last week.

The S&P 500, meanwhile, hasn’t fared nearly as well. While it has formed a gradual uptrend from its October lows, SPY currently has three prior highs (February 2023, August 2022, and April 2022) standing between it and 52-week highs.

Other parts of the global equity market spectrum haven’t been able to keep up with Europe either. Emerging markets, as tracked by the iShares MSCI Emerging Markets ETF (EEM), rallied sharply off its lows in October, but that rally ran out of gas in early February and hasn’t been able to recover. Like the S&P 500, EEM remains well below 52-week highs from last April.

Since Europe accounts for a major share of international equity market cap, the MSCI All Country World Ex US ETF (CWI) is much closer to 52-week highs than EEM, but it still has a number of resistance points to clear.
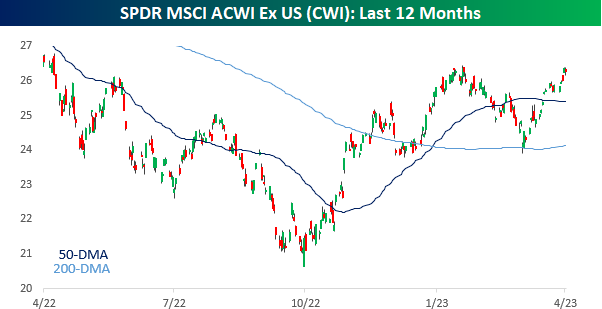
The chart below compares the relative strength of all three ETFs (FEZ, EEM, CWI) to the S&P 500 (SPY) over the last three years and provides a clear look at how Europe has led the global rally. From April 2020 through April 2021, all three ETFs outperformed the S&P 500, but then they really started to underperform as the US economy reopened and the FOMC later started to hike rates. Last October was the major turning point for global stocks, though, as the relative strength for all three ETFs made multi-year lows. While they’ve all started to reverse, only Europe has managed to erase all of its underperformance from the post-COVID period and move into the black versus the S&P.

Have you tried Bespoke All Access yet?
Bespoke’s All Access research package is quick-hitting, actionable, and easily digestible. Bespoke’s unique data points and analysis help investors better visualize underlying market trends to ultimately make more informed investment decisions.
Our daily research consists of a pre-market note, a post-market note, and our Chart of the Day. These three daily reports are supplemented with additional research pieces covering ETFs and asset allocation trends, global macro analysis, earnings and conference call analysis, market breadth and internals, economic indicator databases, growth and dividend income stock baskets, and unique interactive trading tools.
Click here to sign up for a one-month trial to Bespoke All Access, or you can read even more about Bespoke All Access here.
Bespoke’s Morning Lineup – 4/17/23 – Big Beat in the Big Apple
See what’s driving market performance around the world in today’s Morning Lineup. Bespoke’s Morning Lineup is the best way to start your trading day. Read it now by starting a two-week trial to Bespoke Premium. CLICK HERE to learn more and start your trial.
“Either write something worth reading or do something worth writing.” – Ben Franklin
Below is a snippet of content from today’s Morning Lineup for Bespoke Premium members. Start a two-week trial to Bespoke Premium now to access the full report.
Futures were flat up until a few minutes ago, but have moved modestly into positive territory this morning following a better-than-expected Empire Manufacturing report. Just as important as the headline beat was the fact that Prices Paid fell back down to what is basically post-pandemic lows. Despite the bounce in futures, treasury yields have moved higher following the release of the report.
While it didn’t end on a positive note, stocks finished the week higher last week with the S&P 500 up by about 0.8%. Small and mid-caps led the way higher with gains of about 1.5% while mega-caps in the Nasdaq 100 barely finished the week higher. In many respects, last week was mostly about a reversion to the mean where the most overbought sectors underperformed while sectors that were either oversold or neutral heading led the way higher. As shown in the image below from our Trend Analyzer, Financials, Energy, and Industrials were all oversold or neutral heading into the week, and they rallied more than 2%. Meanwhile, all five sectors that were overbought were all either down or up less than 1%. The only exception to the trend was Real Estate. Even though it was one of five sectors below its 50-day moving average coming out of the Easter weekend, it was still the worst-performing sector in the week.

After a strong one-month rally off the October lows, the last five months or so have been a lot like watching paint dry as the S&P 500 is barely higher now than it was at the end of November. Six months removed from the low last October, in order for the S&P 500 to keep its uptrend intact, it’s going to need to clear resistance above its early February high just below 4,200 or roughly $418 in SPY.

Our Morning Lineup keeps readers on top of earnings data, economic news, global headlines, and market internals. We’re biased (of course!), but we think it’s the best and most helpful pre-market report in existence!
Start a two-week trial to Bespoke Premium to read today’s full Morning Lineup.
Bespoke Brunch Reads: 4/16/23
Welcome to Bespoke Brunch Reads — a linkfest of the favorite things we read over the past week. The links are mostly market related, but there are some other interesting subjects covered as well. We hope you enjoy the food for thought as a supplement to the research we provide you during the week.
While you’re here, join Bespoke Premium with a 30-day trial!
Labor
‘Zero Interest in Doing Business’: TSMC Snubs Phoenix Construction Workers by Lee Harris (The American Prospect)
Unionized construction workers in Arizona are getting little interest from Taiwan Semi’s massive fab investment, as the chip giant prefers importing contractors from out of state. [Link]
Next Wave of Remote Work Is About Outsourcing Jobs Overseas by Konrad Putzier (WSJ)
With tight labor markets and strong wage growth, some traditionally localized, skilled service workers are being outsourced to emerging markets economies. [Link; paywall]
Tech Dystopia
They’re Selling Nudes of Imaginary Women on Reddit — and It’s Working by EJ Dickson (Yahoo!/Rolling Stone)
A pair of computer scientists are selling nude pictures of women that don’t exist, proving that machine learning algorithms like Stable Diffusion have leaped forward towards full realism. [Link]
The U.S. Cracked a $3.4 Billion Crypto Heist—and Bitcoin’s Anonymity by Robert McMillian (WSJ)
Since blockchain transactions are immutable, with enough hard work forensic efforts to track bitcoins and other crypto currencies have yielded an impressive list of criminals. [Link; paywall]
Discord Member Details How Documents Leaked From Closed Chat Group by Shane Harris and Samuel Oakford (WaPo)
A small group chat on the platform Discord turned into the source of one of the most damaging national security leaks in recent history, with hundreds upon hundreds of documents transcribed and later photographed and sent to the small group of gamers and gun enthusiasts. [Link; soft paywall]
People Are Sick and Tired of All Their Subscriptions by Rachel Wolfe and Imani Moise (WSJ)
Attrition among subscription models is rising, with streaming cancellations up 49% and a range of other services repeatedly getting the axe from cost-conscious consumers. [Link; paywall]
Corporate Culture
JPMorgan Calls Managing Directors to Office Five Days a Week by Hannah Levitt & Daniel Taub (Bloomberg)
Leadership will be pushed to show their face in person at the nation’s largest bank, setting a tone for JPM after years of remote work jump-started by the pandemic. [Link; soft paywall]
Your Email Does Not Constitute My Emergency by Adam Grant (NYT)
The ever-present nature of email creates pressure for rapid responses which in turn raise the stress of workers receiving what they perceive as high priority communiques. [Link; soft paywall]
Cars & Drivers
After a Boom, an Auto Profit Bust Looms by Stephen Wilmot (WSJ)
In the wake of three years with tight inventories, under-producing factories, and key component shortages, the American auto industry is eying rate hikes and financial stress nervously. [Link; paywall]
General Motors will stop offering Apple CarPlay and Android Auto connectivity by Car Dow (Top Gear)
In an effort to keep Apple and Alphabet out of their data and customer relationships, GM won’t be including popular phone-mirroring apps in future EVs (even as they continue to offer them in their ICE fleet). [Link]
E.P.A. Lays Out Rules to Turbocharge Sales of Electric Cars and Trucks by Coral Davenport (NYT)
Under new emissions standards, automakers would be obliged to convert roughly two-thirds of their new sales to EVs in less than a decade, with heavy trucks targeted at a perhaps more ambitious quarter. [Link; soft paywall]
Real Estate
Downtown San Francisco Whole Foods Closing a Year After Opening by Josh Koehn (The San Francisco Standard)
Whole Foods is shuttering a downtown San Francisco location, citing deteriorating street conditions including drug use and crime near the store, including high theft and hostile visitors. [Link]
What’s the Real Situation with CRE and Banks: Doom Loop or Headline Hype? By Kevin Fagan, Matt Reidy, Thomas Lasalvia, Blake Coules, and Victor Calanog (Moody’s)
Moody’s analysts think that while banks are heavily exposed to commercial real estate and CRE is dependent on banks, mitigating factors can keep the two from spiraling together into a major credit crunch. [Link]
Sports
Quinnipiac Shocked the College Hockey Universe in 10 Seconds by Jason Gay (WSJ)
A historic come-from-behind victory to earn a national championship may have looked like a lucky break, but to win its first NCAA title Quinnipiac bet on itself rather than relying on luck. [Link; paywall]
Michael Jordan’s signed trainers sell for record $2.2mn at Sotheby’s auction by Alexandra White (FT)
A pair of signed Michael Jordan sneakers worn during Game 2 of the 1998 NBA Finals were sold for $2.2mm in a record for a shoe transaction; an MJ jersey went for $10mm back in September. [Link; paywall]
Climate Change
Policies, Projections, and the Social Cost of Carbon: Results from the DICE-2023 Model by Lint Barrage & William D. Nordhaus (NBER)
An update to the giant cost-benefit model which was most recently updated in 2016 shows a significantly higher social cost of carbon and therefore more urgency for action on climate change. [Link; soft paywall]
The American West
Biden Administration Proposes Evenly Cutting Water Allotments From Colorado River by Christopher Flavelle (NYT)
Overuse and drought have left the mighty Colorado near dry, leading the federal government to propose pro-rata cuts to water distributions out of the river system. But that would flout legal precedent, which gives California first dibs on water and could almost eliminate drinking water supplies in Phoenix. [Link; soft paywall]
Peak Real Estate: This Tiny Wyoming Community Has Some of the Country’s Priciest Mountain Homes by Jessica Flint (WSJ)
A tiny town of 1600 people in the neighborhood of Jackson Hole is the second-most expensive mountain town real estate in the country, trailing only Aspen. [Link; paywall]
Read Bespoke’s most actionable market research by joining Bespoke Premium today! Get started here.
Have a great weekend!