Bespoke’s Morning Lineup – 9/22/22 – Central Bank – Palooza
See what’s driving market performance around the world in today’s Morning Lineup. Bespoke’s Morning Lineup is the best way to start your trading day. Read it now by starting a two-week trial to Bespoke Premium. CLICK HERE to learn more and start your trial.
“No one knows whether this process will lead to a recession.” – Jerome Powell
Below is a snippet of content from today’s Morning Lineup for Bespoke Premium members. Start a two-week trial to Bespoke Premium now to access the full report.
Futures are modestly higher following a slew of central bank rate hikes around the world and a currency intervention from the BoJ. Jobless Claims were just released for the latest week and came in at 213K which was 4K below consensus forecasts. Continuing claims were likewise lower than forecasts coming in at a level of 1.379 million versus forecasts for a level of 1.418 million. While yesterday’s close at the lows was disheartening for the bulls, when you consider how the market has performed following positive initial reactions to the Fed this year, maybe the Fed day weakness wasn’t so bad.
Years before he became Chairman of the Federal Reserve, Jerome Powell received an undergraduate degree from Princeton, a law degree from Georgetown, was a partner at the Carlye Group, and even served as under-secretary of the Treasury for domestic finance. He’s not only extremely intelligent, but unlike many of his colleagues on the FOMC, he has real-world experience of how the private sector and financial markets work.
Given his experience, we’re sure Powell is familiar with the yield curve and how its shape impacts the economy. Specifically, when the curve inverts and short-term interest rates rise above long-term rates, it tends to slow down economic activity. While at the Carlyle Group and the private equity firm that he started after (Severn Capital Partners), he probably experienced these slowdowns firsthand and was able to make investments on good terms for his clients.
The Federal Reserve’s preferred measure of the yield curve is the spread between 3-month and 10-year US Treasuries, which still has a modestly positive slope at about 25 basis points (bps). Besides that, another widely followed point on the curve is the spread between the 2-year and 10-year US Treasuries (2s10s). As of yesterday’s close, the 2s10s curve inverted to the tune of 52 bps making it the most inverted it has been since 1982! It was nearly as inverted in April 2000, but back then the maximum point of inversion was 51 bps. Think about that for a minute. A lot of people – maybe up to half- reading this right now weren’t even alive the last time the 2s10s curve was as inverted as it is now! Looking at the chart below, since the mid-1970s, there has never been a period when the 2s10s yield curve was as inverted as it is now that a recession wasn’t just over the horizon.

Getting back to Chair Powell, at one point in his press conference yesterday, he responded to one question with the answer that “No one knows whether this process will lead to a recession.” Let’s get this straight. The yield curve is extremely inverted, GDP growth in the first two quarters of this year has already been negative, and forecasts for growth in Q3 have been steadily declining as we close out the month. All this is before the recent unprecedented round of 75 bps rate hikes have had the opportunity to filter through the economy, and yet the Fed Chair is unsure of whether the US economy is either already in or on pace for a recession. Now we know that it’s not a good look for a Fed Chair to forecast a recession as the base case scenario, but does he really believe what he’s saying?
Our Morning Lineup keeps readers on top of earnings data, economic news, global headlines, and market internals. We’re biased (of course!), but we think it’s the best and most helpful pre-market report in existence!
Start a two-week trial to Bespoke Premium to read today’s full Morning Lineup.
Bespoke’s Morning Lineup – 9/21/22 – Washington in Focus
See what’s driving market performance around the world in today’s Morning Lineup. Bespoke’s Morning Lineup is the best way to start your trading day. Read it now by starting a two-week trial to Bespoke Premium. CLICK HERE to learn more and start your trial.
“The worst of COVID may be behind us, but the economic challenges we face are no less daunting.” – Jane Fraser
Below is a snippet of content from today’s Morning Lineup for Bespoke Premium members. Start a two-week trial to Bespoke Premium now to access the full report.
Despite some bellicose comments from Putin overnight regarding the war in Ukraine, futures are higher this morning as US Treasury yields are modestly lower and oil prices trade moderately higher. There’s also been some positive earnings news as General Mills (GIS) reported better than expected EPS and raised guidance, while Coty (COTY), a smaller company, raised Q1 guidance and sees full-year estimates inline with forecasts. You can read all you want into these early moves, but it’s likely to all be irrelevant by the end of the day after the FOMC rate decisions and Powell’s press conference.
The comments above come from the prepared remarks of Citibank CEO Jane Fraser in testimony to Congress today. Mid-term elections are just over a month away, so our elected representatives need some campaign soundbites. What better way to do that than bring a bunch of bank CEOs to DC in person and give them a good scolding? Anyways, the prepared remarks of Citibank CEO Jane Fraser and JP Morgan Chase CEO Jamie Dimon, who will say that “many Americans are being crushed by high inflation eroding real incomes, particularly from higher prices on gas and food,” don’t paint a very positive picture for the economy. Whatever happened to the roaring 20s we were supposed to have after COVID?
On the same day that bank CEOs present these dour economic forecasts, the FOMC will announce what is expected to be an increase of at least 75 basis points (bps) in the Fed Funds rate which would be the third straight increase of at least that magnitude. Not only that but Powell is widely expected to set the stage for more rate hikes to come. How much more in rate hikes that follow today’s meeting may depend on what the stock market does. In an article earlier this week, Nick Timiraos at the Wall Street Journal reported that Fed officials were unhappy with the market’s positive reaction following the July rate hike of 75 bps. Powell’s displeasure with the market rally was so intense that he scrapped his prepared Jackson Hole speech in favor of a more direct and forceful message that the FOMC would “Keep At It” and do everything it could to bring inflation down.
Powell got exactly what he wanted from the market following that speech as stocks have been cratering ever since. Minneapolis Fed President Neel Kashkari reinforced the Fed’s intent to get stock prices lower when he remarked that “I was actually happy to see how Chair Powell’s Jackson Hole speech was received…I certainly was not excited to see the stock market rallying after our latest Federal Open Market Committee meeting”.
Investors always discuss the Fed’s dual mandate of maximum employment and stable prices, and lately they have questioned whether the Fed has shifted to focus on a single mandate of stable prices. With Powell taking the unusual step of completely ditching his Jackson Hole speech last month and then Kashkari outright endorsing the negative market reaction to Powell’s speech, the idea of a single mandate Fed – one intent on lower stock prices – now seems accurate. Now, if only we knew how much of a bear market would satisfy the Fed’s new mandate.
When you have members of the Federal Reserve openly rooting for lower stock prices, you can’t be surprised by the performance of equities this year, but when you put it in a historical perspective, 2022 ranks right up there with the worst of them. Yesterday, the S&P 500 fell more than 1% for the 45th time this year. That works out to 25% of all trading days, or more than one 1% decline a week. Since the five-trading day week started in 1952, the only other years with a higher percentage of 1% down days were 1974, 2002, and 2008. With declines of 29.7%, 23.3%, and 38.5%, respectively in those years, this year’s decline of 19.10% seems pedestrian.

Our Morning Lineup keeps readers on top of earnings data, economic news, global headlines, and market internals. We’re biased (of course!), but we think it’s the best and most helpful pre-market report in existence!
Start a two-week trial to Bespoke Premium to read today’s full Morning Lineup.
The Streak is Over
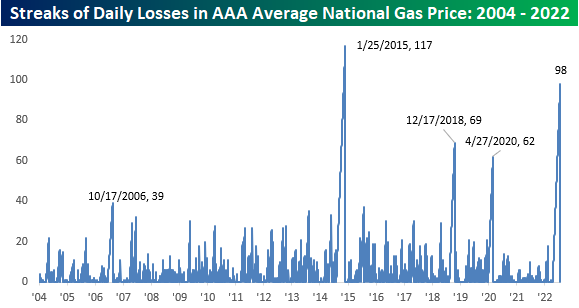
After falling every day since June 14th, the average price of a gallon of gasoline in the United States, according to AAA, rose yesterday. That ends what was the second-longest streak of consecutive declines going back to at least 2005. Had the streak lasted another three weeks, it would have gone down as the longest on record, exceeding the 117 days from back in 2015, but it’s ironic that this streak began back in mid-June when the Federal Reserve started to panic about inflation and leaked plans to hike rates by 75 bps at its June meeting to the WSJ and is now ending on a day when the Fed is expected to hike rates by at least 75 bps for an unprecedented third straight meeting.
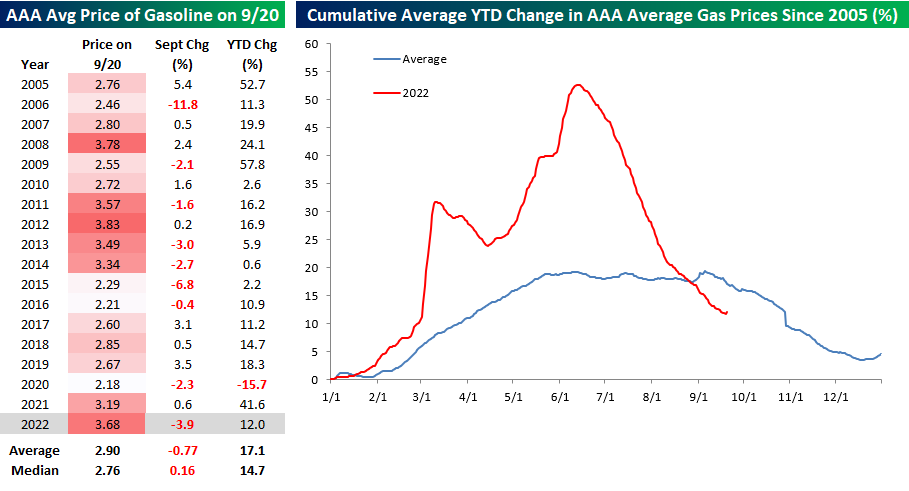
While the streak is over, it still doesn’t diminish the fact that prices at the pump have been in freefall since that peak in June, falling by 27%. Prices at the pump are down close to 4% in September alone. While the national average price has only been higher at this time of year two other times (2008 and 2012), the 3.9% decline this month is larger than average. Even more surprising is the fact that with prices at the pump up 12% YTD, they are actually up less YTD than average for this time of year. There’s no dismissing that inflation continues to be a major problem, but most people probably wouldn’t believe that gas prices are up less this year through 9/20 than they are in the average year. Click here to learn more about Bespoke’s premium stock market research service.
Worse Before It Gets Better
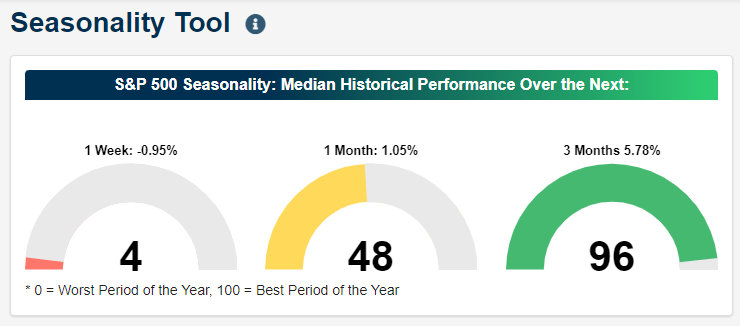
For those checking in on our Seasonality Tool in the past week, the current point of the year can either look like one of the worst, middling, or best times of the year depending on the time frame. As shown below, the median one-week performance of the S&P 500 from the close on 9/20 over the last ten years has been a decline of 95 bps loss which ranks in just the fourth percentile of all days of the year. Extending out to look at the S&P 500’s median one-month performance, the 105 bps median gain is about smack dab in the middle of the range of historical one-month returns. Moving out to three months, the S&P 500’s median gain of 578 bps ranks in the top 5% of all days.
To look at seasonality in another way, the charts below show the average S&P 500 5-day performance (including a smoothed look via a 7-day moving average) and the percentage of time the index has traded positively at each calendar day of the year going all the way back to 1945. The current week of the year has averaged some of the worst one-week returns for the S&P 500 across all years of the post-WWII period while the index has tended to fall more often than not.
Again, contrary to short-term seasonal weakness, taking a similar look but using a 3-month performance window, we are entering one of the best times of the year. As shown below, the second half of September into October sees the average 3-month performance rocket higher and by early October has tended to be the strongest of any point of the year. Click here to learn more about Bespoke’s premium stock market research service.
Housing Starts and Permits Mixed But Still Trending Lower
Relative to expectations, Tuesday’s report on Building Permits and Housing Starts was mixed, but overall, it was pretty lousy. Housing Starts exceeded expectations by over 100K, but Building Permits missed expectations by nearly 100K, and as shown in the table below, both are currently down on a year/year basis. Within the better-than-expected Housing Starts report, practically all of the strength was in multi-family units which increased 28% m/m. Single-family units were also positive but increased at just a fraction of the rate of multi-family units. Building Permits were a more gloomy part of the report with the headline reading down 10% m/m and 14.4% y/y. On a regional basis, Permits were down across the board with weakness concentrated in the Northeast and South.
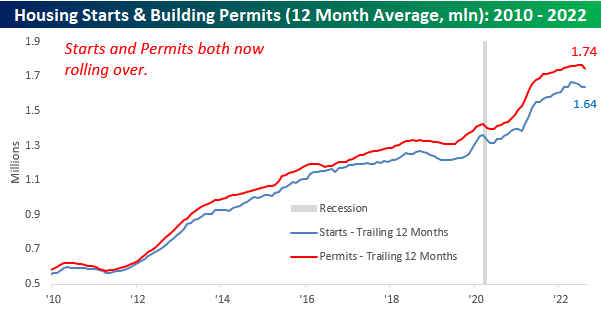
As we have highlighted frequently over the years, Housing Starts have been an excellent leading indicator of the economic cycle. With the exception of the COVID crash, every other recession since the mid-1960s was preceded by a rollover in the 12-month average of Housing Starts (even ahead of COVID, Housing Starts technically rolled over from a peak, but nothing of the magnitude like they did ahead of prior recessions). The current magnitude of decline from the recent peak is by no means near the severity of rollovers leading up to prior recessions, but there has been a clear trend of weakness in this reading with four straight months of declines in the 12-month moving average.
Looking more closely at the post-financial crisis trends in Housing Starts and Building Permits, both appear to have reached at least a short-term peak. Building Permits had been holding up in the months leading up to August’s report, but with a current reading of 1.517 million replacing a reading of 1.772 million from 12 months ago, the one-year average took a sharp turn lower. In fact, the last time it dropped as much as it did this month was back in mid-2009.
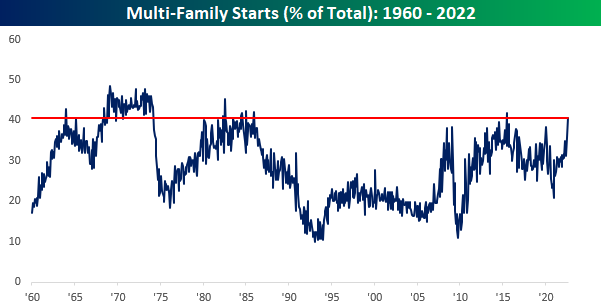
Finally, with the release of each month’s Housing Starts report, a phrase you increasingly hear is something along the lines of “but all the strength was in multi-family units”. As noted above, that was the case again this month and so much so that multi-family starts accounted for over 40% of all starts. Relative to recent history, that’s a very high percentage, and outside of one month in June 2015 when the reading was distorted due to the expiration of a tax break for multi-family units in New York, it’s the highest reading since 1985. Given their smaller size, multi-family units aren’t considered to be nearly as economically impactful as single-family units and therefore suggests that the strength of the August report wasn’t as much as it looked at the surface. Click here to learn more about Bespoke’s premium stock market research service.
Bespoke’s Morning Lineup – 9/20/22 – Weak Start as Fed Meeting Begins
See what’s driving market performance around the world in today’s Morning Lineup. Bespoke’s Morning Lineup is the best way to start your trading day. Read it now by starting a two-week trial to Bespoke Premium. CLICK HERE to learn more and start your trial.
“The sea is dangerous and its storms terrible, but these obstacles have never been sufficient reason to remain ashore.” – Ferdinand Magellan
Below is a snippet of content from today’s Morning Lineup for Bespoke Premium members. Start a two-week trial to Bespoke Premium now to access the full report.
Just like yesterday, futures are lower this morning as interest rates continue to make new multi-year highs while crude oil is marginally higher. The major news event of the overnight session was a 100 basis point rate hike from Sweden’s Riksbank. That was the largest rate hike for the central bank since 1992. In economic news, Germany’s headline PPI increased 7.9% month over month. Yes, you read that right- month over month. In the US, Building Permits and Housing Starts came in mixed relative to expectations. Housing Starts were expected to come in roughly unchanged at 1.45 million, but the actual reading came in at 1.575 million. Building Permits, however, missed expectations by just about as much as starts beat (1.517 million vs 1.610 million consensus forecast).
As has been the case for most of the year, interest rates are on the rise again this morning. The 2-year and 10-year US Treasury yields are up about 4 basis points (bps) pushing both up to new multi-year highs. What’s somewhat notable about the moves in the last 24 hours is that for the first time in just over three months, both the 2 and 10-year yields are at 52-week highs.
In the case of the 2-year yield, its yield has been hitting 52-week highs pretty much every day since Labor Day, but the 10-year yield only took out its June highs yesterday. No matter how many times we say it, it’s hard to imagine that less than nine months ago, ten-year yields were at 1.5% while two-year yields were less than 0.75%.


Our Morning Lineup keeps readers on top of earnings data, economic news, global headlines, and market internals. We’re biased (of course!), but we think it’s the best and most helpful pre-market report in existence!
Start a two-week trial to Bespoke Premium to read today’s full Morning Lineup.
The Biggest Pandemic Losers
With President Biden declaring that “the pandemic is over” on 60 Minutes last night, we thought we’d take a look at stock market performance since the pandemic began. At its peak on January 3rd, 2022, the S&P 500 was up more than 40% from its closing price on February 19th, 2020 — the peak reading for the index prior to the COVID Crash. After entering bear market territory in 2022, the S&P is currently only 14% above its pre-COVID high. In the Russell 1,000 — another large-cap index — 41% of stocks are now trading below their closing price on February 19th, 2020. 20% of stocks in the index are down more than 20%! Given that two and a half years have passed, we think it’s safe to say that any stock down 20% from pre-COVID levels has been a “pandemic loser.” At least at this point in time.
Below are stocks with market caps above $15 billion that are down at least 20% from their closing price on 2/19/20. Names like Boeing (BA), Delta (DAL), Uber (UBER), and Las Vegas Sands (LVS) were some of the initial “lockdown losers” that never really recovered, but other stocks that were initially viewed as “lockdown winners” are also on the list like Netflix (NFLX), Meta (META), Spotify (SPOT), and Zoom Video (ZM). Go figure.
Boeing (BA) and Intel (INTC) have been two of the biggest losers since pre-COVID with declines of more than 56%. Other “blue chips” that have been crushed since the pandemic hit include Biogen (BIIB), Citigroup (C), General Electric (GE), Verizon (VZ), 3M (MMM), Square (SQ), Disney (DIS), Adobe (ADBE), and salesforce (CRM). It’s interesting that there’s representation from nearly every sector of the economy on this list. The only sector that’s NOT included is Energy, which is crazy since the sector was one of the hardest hit in the early days of COVID as the price of oil even went negative for a day.
Of course, COVID isn’t the reason why all of these large-cap stocks are now down so much since the pandemic began, but the performance numbers are the performance numbers, and there’s no getting around it. Management at big travel & leisure companies have always wished COVID never happened, but more and more companies in sectors like Tech that thought the pandemic might be a game-changer for them in a positive way are now staring at big 2+ year declines thinking “what the hell just happened.” Click here to learn more about Bespoke’s premium stock market research service.
Bespoke’s Morning Lineup – 9/19/22 – More of the Same
See what’s driving market performance around the world in today’s Morning Lineup. Bespoke’s Morning Lineup is the best way to start your trading day. Read it now by starting a two-week trial to Bespoke Premium. CLICK HERE to learn more and start your trial.
“Objects in motion stay in motion in the same direction unless acted upon by an unbalanced force.” – Isaac Newton
Below is a snippet of content from today’s Morning Lineup for Bespoke Premium members. Start a two-week trial to Bespoke Premium now to access the full report.
There’s very little in the way of economic or earnings data this morning, the Fed is in its blackout period, and the buyback window is closed. Therefore, there appears to be very little in the way of catalysts to interrupt the current path of equities which has been lower and interest rates which have been higher. Futures are indicating a decline of about 0.75% at the open for the S&P 500, and the 10-year yield is above 3.5%. The only economic report on the calendar today is homebuilder sentiment, and given the moves in interest rates, it’s hard to imagine an upside surprise.
The negative start to this week follows what was a lousy week for not just US equities but equities all over the world. US stocks were easily the worst performers last week with the S&P 500 (SPY) and Nasdaq 100 (QQQ) both falling 5%, but other major regional equity ETFs all fell at least 2.5%. Of the nine ETFs listed below, they are all at least 4% below their 50-DMAs, all of them are oversold, and all but three (SPY, ACWI, and VPL) are down 20% YTD. It’s not even three-quarters finished, but 2022 is already shaping up to be one of the worst in the post-WWII period for not just US stocks but stocks all over the world.

Our Morning Lineup keeps readers on top of earnings data, economic news, global headlines, and market internals. We’re biased (of course!), but we think it’s the best and most helpful pre-market report in existence!
Start a two-week trial to Bespoke Premium to read today’s full Morning Lineup.
Bespoke Brunch Reads: 9/18/22
Welcome to Bespoke Brunch Reads — a linkfest of the favorite things we read over the past week. The links are mostly market related, but there are some other interesting subjects covered as well. We hope you enjoy the food for thought as a supplement to the research we provide you during the week.
While you’re here, join Bespoke Premium with a 30-day trial!
Wealth
U.S. household wealth suffers record drop in second quarter by Dan Burns (NASDAQ/Reuters)
Rising interest rates and falling asset prices are unwinding many of the huge wealth gains from the pandemic period when soaring prices sent US net worth above $150trn. [Link]
Gulf States, Rich From Oil, Spread Influence With Financial Lifelines by Chelsey Dulaney and Rory Jones (WSJ)
Oil-rich economies are seeing a massive inflow of cash amidst high energy prices. Some are using that cash to support other countries that are reeling under balance of payments stress and natural disaster crises. [Link; paywall]
Electric Vehicles
Tesla Shifts Battery Strategy as It Seeks U.S. Tax Credits by Rebecca Elliott and Mike Colias (WSJ)
The passage of the Inflation Reduction Act earlier this year is already driving companies to re-think their approach to offshoring and supply chain design as the world’s largest EV maker may be switching battery production from Germany to the US. [Link; paywall]
Ford Reveals New EV-Selling Rules to Dealers by Nora Eckert (WSJ)
The Big Blue Oval is rolling out a new approach to selling EVs which will require no-haggle prices. New infrastructure for charging will also be a must. [Link; paywall]
Surgical Science
I Wish I Was a Little Bit Taller by Chris Gayomali (GQ)
Men who want to be a little bit taller are undertaking a dangerous surgery designed to lengthen their legs and add a few inches via broken femurs, titanium rods, and a lot of pain. [Link]
An ACL Tear That Heals Itself? by Aylin Woodward (WSJ)
Imagine your body re-growing its own ACL? A new generation of biologic treatments that create a scaffold for the ligament to grow on is being used to replace the injured tissue. [Link; paywall]
Scarcity & Abundance
Low-Paid Workers Face Worst-Ever Financial Crisis, Study Finds by Alan Jones (Press Association/Bloomberg)
The Living Wage Foundation surveyed low-wage workers and discovered more than half have used a food bank over the past year with almost as many regularly skipping meals. [Link; soft paywall]
From Shortage to Glut: Scotts Miracle-Gro Is Buried in Fertilizer by Thomas Gryta (WSJ)
The huge boom in consumer demand during the pandemic convinced goods producers and importers to ramp up their inventories. Now, that demand isn’t appearing to the same degree that was expected, a glut of inventories and over-production remains. [Link; soft paywall]
Global Food Supply Faces Fresh Turmoil With Rice Set to Climb by Patpicha Tanakasempipat, Pratik Parija, and Mai Ngoc Chau (Bloomberg)
Export controls in India are expected to drive up the price of rice globally. Global production has already been curtailed by weather and the shock of other crop prices soaring earlier this year. [Link; soft paywall]
Ukraine
Ukraine Pulled Off a Masterstroke by Phillips Payson O’Brien (The Atlantic)
The offensive that let Ukraine retake large swathes of Kharkiv Oblast in a dramatic breakout was part of a broader strategic feint which has played out over the entire summer. [Link; soft paywall]
Read Bespoke’s most actionable market research by joining Bespoke Premium today! Get started here.
Have a great weekend!
What a Way to Start the Weekend
If you’ve been in a particularly bad mood heading into weekends this year, you’re obviously paying pretty close attention to the markets. With today’s decline, the S&P 500 is in the familiar position of ending the week with a decline of 1% or more. If the current declines hold up into the close, it will be the 12th daily drop of 1% or more to end a week this year. Going back to 1952 when the five trading day week started, there have only been five other years (1974, 2000, 2001, 2002, and 2008) where there were as many or more down 1% Fridays (or last trading day of the week) in a given year. As you might expect, all five of those years were lousy for the stock market.
While this year is currently tied for having the fourth-highest number of 1%+ down days, the year isn’t even three-quarters done (heaven help us). After today there are still another 15 weeks left in the year, so there is plenty of time to move up the rankings. On a percentage basis, the S&P 500 has closed down at least 1% on the last trading day of the week just under a third (32.4%) of the time, and if that pace were to keep up for the remainder of the year, 2022 would easily set the record for the highest frequency of 1% declines to close out the week. Never have we needed a happy hour more than this year. Click here to learn more about Bespoke’s premium stock market research service.

