AI Craze Closing In On Crypto Craze
Last Friday’s Bespoke Report was our quarterly Equity Market Pros and Cons edition. In it, we noted the boom of artificial intelligence both in terms of search interest (measured by Google Trends data) and mentions of the term in the earnings calls of mega caps. Google Trends data measures how much a given term(s) is being searched for on Google’s search engine. That interest is indexed with 100 being the peak in searches. Thus a reading of 75 would be when search interest is 75% of said peak, 50 would be 50% of the peak, and so on. Google Trends also allows for comparisons across multiple terms to evaluate relative search interest.
Given the topic of AI is extremely in vogue, we wanted to compare how search interest stands up to bitcoin, which before AI was the last tech craze among investors and the general public. Bitcoin, and crypto more broadly, came into the mainstream as the next big thing in tech in late 2017. As shown below, December 2017 would mark the height of Google searches for “Bitcoin”. A few years later in early 2021 when meme stocks were all the rage, search interest for Bitcoin again spiked, but that has been the closest it has come since to returning to 2017 levels of interest. Meanwhile, AI has come to the forefront.
As shown below, searches for “artificial intelligence” or the abbreviation “AI” began to explode higher a little over a year ago with the launch of ChatGPT. Search interest for each of those terms has not ceased rising, and all three just hit record highs last week. As for the actual index values versus Bitcoin, the Trends score for “artificial intelligence” has climbed to 56 and the index for “AI” has gone even higher to 65. That means that search volumes for “AI” are currently around two-thirds as high as search volumes for “Bitcoin” were at the peak in late 2017. That is to say that (as if it wasn’t obvious) AI is the buzzword of the time, but it’s not quite as buzzy (yet) as Bitcoin was several years ago.

While AI-related searches have quickly risen in popularity, the pace hasn’t been as rapid as it was for Bitcoin. In the chart below we show Google Trends scores for the same terms as above, but for each one, we show the two years before their respective peaks. While the bulk of the increase to peak searches for Bitcoin in 2017 occurred in just a few months, the more recent growth in AI searches appears to have been much more steady. That offers at least one counterpoint to assuage concerns over AI being a fad.


Bespoke’s Brunch Reads – 2/4/24
Welcome to Bespoke Brunch Reads — a linkfest of the favorite things we read over the past week. The links are mostly market-related, but there are some other interesting subjects covered as well. We hope you enjoy the food for thought as a supplement to the research we provide you during the week.
While you’re here, join Bespoke Premium with a 30-day trial!
On This Day in History:
TheFacebook: META just had a pretty stellar earnings report this past week that saw its stock up 80 points, or 20.3%, in a single day on Friday. It was not long ago that the stock traded at just $88 a share in November of 2022. Since that low, META has exploded upwards of 400% and just traded at another new all-time high on Friday.
The company has seen ups and downs over the years, but it all got started 20 years ago today on February 4th, 2004. A Harvard student by the name of Mark Zuckerberg, along with his some of his college roommates and fellow students, launched“TheFacebook” from their dorm room. Initially, it was just limited to Harvard students, aimed at creating a network that connected people through a web of friends. That’s an idea we take for granted as part of our daily lives now, but it was once revolutionary to have an online platform that mimicked any individual’s unique social life. The platform quickly blew up and became wildly popular, and the rest, as they say, is history.

*This image is taken from a scene in The Social Network, depicting Zuckerberg working on the early stages of TheFacebook.
Investing
Passive Funds Overtake Active Thanks in Part to Advisory Shift (AdvisorHub)
In 2023, passive investment funds in the US, including mutual funds and ETFs, surpassed actively managed funds in total assets, reaching $13.252 trillion versus $13.244 trillion. This landmark shift, a first in 48 years, was propelled by significant annual growth of 22.6% in passive funds against 10.6% for active funds. Clients are moving away from commission-based trading to advisory accounts and advisors are moving from traditional broker-dealers to fee-only RIAs. [Link]
TIPSplaining a lousy inflation hedge (Financial Times)
In the pandemic era, investors poured their money into TIPS, hoping to mitigate the risk of inflation. However, 2022 saw investors facing significant losses in both nominal and real terms, with the TIPS market barely outperforming the nominal US Treasury market. The Fed’s response to inflation by raising rates resulted in increased real yields and led to lower TIPS prices and negative returns. This did not align with investor expectations, leading to around $30 billion being withdrawn from the four largest TIPS ETFs since their peak at the end of 2021. [Link]
Chinese Fervor for Overseas Stocks Is Breaking ETF Trading (BNN Bloomberg)
Chinese investors are increasingly seeking exposure to overseas equities, to the extent of paying premiums of up to 40% over the asset value in some ETFs. This surge in demand has led to trading halts and purchase limits on numerous ETFs tracking foreign stocks. Despite the high premiums, both retail and institutional investors are drawn to these ETFs due to stronger performances in international indices like the S&P 500 and Nikkei 225. The phenomenon underscores a broader shift away from Chinese equities amid frustration with their underwhelming returns. [Link]
This ETF outperforms by stressing corporate culture — but not ESG (MarketWatch)
The Harbor Human Capital ETF invests in companies with strong corporate cultures, as indicated by a proprietary index that assesses factors like employee engagement, management respect, and innovation. Launched in October 2022, the ETF aims to provide investors with the opportunity to invest in large-cap companies that are believed to have better performance potential due to their positive work environments. Since then, it has outperformed the S&P 500. [Link]
AI & Technology
Elon Musk Says Neuralink Has Implanted Brain Chip in Human (WSJ)
The first human has successfully received a Neuralink brain implant, marking a significant step in brain-computer interface technology, potentially aiding individuals with conditions like quadriplegia. The patient is reported to be recovering well, with the implant showing promising initial results in neuron spike detection. The development could be a potential breakthrough for severely disabled individuals, although it is expected to take years before the technology becomes widely available. [Link]
Battle Looming Between AI and Counter-AI, Says Official (US DoD)
The Department of Defense and other defense departments around the world are beginning to integrate AI, which could lead to a future “arms race” between AI and counter-AI. The department aims to leverage AI for threat analysis, vulnerability assessment, and enhancing the security of government and defense systems. AI’s role in processing vast amounts of data for threat detection is seen as crucial to staying ahead of adversaries and maintaining security in an ever-evolving digital environment. [Link]
The Hollywood Jobs Most At-Risk From AI (The Hollywood Reporter)
A study indicates that nearly 240,000 positions in Hollywood, particularly among sound engineers, voice actors, concept artists, and entry-level employees, could be affected by AI within three years. AI is developing abilities to efficiently produce content such as sound design, 3D assets, and realistic dubbing, posing a threat to traditional roles in the industry. The development sparks new reasons for concern regarding AI, this time among the elite in the entertainment business. [Link]
FCC moves to criminalize most AI-generated robocalls (NBC News)
The FCC is set to criminalize unsolicited robocalls that utilize AI-generated voices, following an incident involving a fake AI-generated message mimicking President Joe Biden. This proposal would extend the Telephone Consumer Protection Act (TCPA) of 1991 to include such AI-generated calls, as concern over AI’s role in scams grows. [Link]
Can This A.I.-Powered Search Engine Replace Google? It Has for Me. (NYT)
The AI-powered search engine Perplexity, founded by former OpenAI and Meta researchers, has attracted a lot of attention and investment for offering a new approach to online searches, namely tech insiders and investors like Jeff Bezos. Differing from traditional search engines like Google, Perplexity provides AI-generated summaries of web content rather than a list of links, aiming to make information gathering more efficient. Still, there are concerns about its accuracy and the impact on digital media, essentially making it unnecessary to visit websites anywhere. [Link]
Plane Problems
Kayak reports 15-fold increase in passengers filtering out 737 Max flights (The Independent)
Kayak is a travel search engine that allows users to filter and find the most ideal traveling and hotel plans. Since the recent incident with an Alaska Airlines 737 Max 9’s fuselage blowing out mid-flight, Kayak reported a massive increase in users filtering out flights on 737 Max 9s. The FAA has grounded dozens for inspection after a potentially fatal event and some travelers are taking no chances with the jet. Confidence is surely rattled and therefore, aircraft type is an important part of flying for travelers right now. [Link]
‘I would absolutely not fly a Max airplane’: Ex-Boeing manager raises alarm on jets returning to service (Los Angeles Times)
Some airlines have resumed flights with 737 Max 9 jets that had been grounded after the viral incident with Alaska Airlines. Many, including former Boeing employees, still express deep concerns about the safety of the Max planes, citing persistent issues and a culture prioritizing speed and profit over quality and safety. The decision to resume flights after specific inspections has been met with skepticism, suggesting a need for major change to truly ensure passenger safety. [Link]
EVs
Electric vehicles and hybrids surpass 16% of total 2023 U.S. light-duty vehicle sales (EIA)
In 2023, the United States saw a significant increase in the sales of hybrid vehicles, plug-in hybrid electric vehicles (PHEVs), and battery electric vehicles (BEVs), which collectively rose to 16.3% of total new light-duty vehicle sales, up from 12.9% in 2022. This growth was driven by an increase in the number of BEV models available, a shift towards offering hybrids in more popular size classes like crossovers, and a reduction in BEV prices, partly due to manufacturer price cuts and incentives from the Inflation Reduction Act. [Link]
Planning & Zoning
Legislature Advances Proposal Allowing Cafes in More Neighborhoods (The Urbanist)
The state of Washington is considering a legislative proposal that could increase the number of small neighborhood cafes within walking distance of homes, aiming to ease strict zoning laws that have long segregated commercial and residential uses. The move is seen as a way to enhance community access to services and strengthen local connections, also expanding the definition of cafes to potentially include venues serving alcohol with food. [Link]
Empty Nest Emptiness
When Junior Heads to College, Helicopter Parents Turn to Empty-Nest Coaches (WSJ)
“Helicopter parents” who become deeply invested in their children’s daily activities and development may experience deep sadness once those kids fly the coop. Enter empty-nest coaching, a niche that offers support and counseling for parents struggling with the emotional and logistical void left by their children’s departure. These coaches have even gone viral on social media platforms like TikTok for helping parents cope with their changing roles. [Link]
“Beware the Viral Graph”
Maybe young men and women aren’t so ideologically different (Good Authority)
This article challenges an article from last week’s installment of Bespoke’s Brunch Reads. Last week’s article showed a graph that went viral for the ideological gap between young men and women in the US. The contrast was eye-catching, but this article argues that these ideological differences are much smaller, averaging about a 5-point difference vs the 30-point difference suggested previously suggesting that the differences are also not necessarily more defined among young people. [Link]
Read Bespoke’s most actionable market research by joining Bespoke Premium today! Get started here.
Have a great weekend!
The Bespoke Report — Equity Market Pros and Cons — Q1 2024
This week’s Bespoke Report is an updated version of our “Pros and Cons” edition for Q1 2024.
With this report, you’re able to get a complete picture of the bull and bear case for US stocks right now. It’s heavy on graphics and light on text, but we let the charts and tables do the talking!
On page three of the report, you’ll see a full list of the pros and cons that we lay out. Slides for each topic are then provided on page four and beyond.
To read this report and access everything else Bespoke’s research platform has to offer, sign up for Bespoke’s “Leap Year” special today. Our Leap Year special gets you access to Bespoke Institutional (everything we publish!) for two months for just $29. You can either continue with the service past the first two months or cancel at any time. SIGN UP HERE.


Bespoke Market Calendar — February 2024
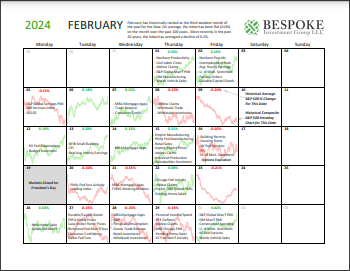
Please click the image below to view our February 2024 market calendar. This calendar includes the S&P 500’s historical average percentage change and average intraday chart pattern for each trading day during the upcoming month. It also includes market holidays and options expiration dates plus the dates of key economic indicator releases. Click here to view Bespoke’s premium membership options.
The Bespoke 50 Growth Stocks — 2/1/24
The “Bespoke 50” is a basket of noteworthy growth stocks in the Russell 3,000. To make the list, a stock must have strong earnings growth prospects along with an attractive price chart based on Bespoke’s analysis. There were 21 changes to the list this week.
The Bespoke 50 is available with a Bespoke Premium subscription or a Bespoke Institutional subscription. With Bespoke Premium, you’ll receive a number of daily market updates from us along with our weekly newsletter and a portion of our investor tools. With Bespoke Institutional, you’ll receive everything that’s included with Premium plus additional daily macro analysis and more stock-specific research.
To see all 50 stocks that currently make up the Bespoke 50, simply start a two-week trial to Bespoke Premium or Bespoke Institutional.

The Bespoke 50 performance chart shown does not represent actual investment results. The Bespoke 50 is updated weekly on Thursday unless otherwise noted. Performance is based on equally weighting each of the 50 stocks (2% each) and is calculated using each stock’s opening price as of Friday morning each week. Entry prices and exit prices used for stocks that are added or removed from the Bespoke 50 are based on Friday’s opening price. Any potential commissions, brokerage fees, or dividends are not included in the Bespoke 50 performance calculation, but the performance shown is net of a hypothetical annual advisory fee of 0.85%. Performance tracking for the Bespoke 50 and the Russell 3,000 total return index begins on March 5th, 2012 when the Bespoke 50 was first published. Past performance is not a guarantee of future results. The Bespoke 50 is meant to be an idea generator for investors and not a recommendation to buy or sell any specific securities. It is not personalized advice because it in no way takes into account an investor’s individual needs. As always, investors should conduct their own research when buying or selling individual securities. Click here to read our full disclosure on hypothetical performance tracking. Bespoke representatives or wealth management clients may have positions in securities discussed or mentioned in its published content.
High Share Prices vs. Low Share Prices
It shouldn’t matter, but we saw a huge disparity in the performance of stocks with high versus low share prices in January. Here are the numbers:
As shown below, in the large-cap Russell 1,000, the 100 stocks that began 2024 with the lowest share prices fell an average of 7.4% in January, while the 100 stocks that began the year with the highest share prices rose an average of 2%.

There are 25 stocks in the Russell 1,000 that began 2024 with a sub-$10 share price, and these stocks fell an average of 11% in January. Conversely, the 41 stocks in the Russell 1,000 that began the year with a share price of more than $500 rose an average of 3.2% during the month.
What gives?

January 2024 Key ETF Performance
The first month of 2024 is already complete, and below is a look at the performance of various asset classes during January using key ETFs that we track closely. The S&P 500 (SPY) finished the month up 1.59% even though the average stock in the index was down 0.84%. While large-cap ETFs like SPY and QQQ finished the month higher, the small-cap Russell 2,000 (IWM) was down 3.9%.
At the sector level, Real Estate (XLRE) and Consumer Discretionary (XLY) both fell 4%+, while Communication Services (XLC) saw the biggest move to the upside at 4.4%. International equity ETFs were all over the place in January with India (PIN) and Japan (EWJ) solidly higher and China (ASHR) and Hong Kong (EWH) sharply lower. Oil (USO) was actually the best performing area of the entire matrix in January with a gain of 6.4%. On the flip side, natural gas (UNG) and silver (SLV) both fell 3%+.

Start a complimentary 30-day trial to Bespoke Premium today!
Down at Noon on a Fed Day
The first Fed day of the year has arrived. While there’s widespread agreement that rates will be held steady today, according to the CME’s FedWatch tool, markets are pricing higher probabilities of cuts at other meetings this year. Looking six months out shows the market is giving a greater than 50% chance of rates being cut by at least a full percentage point from the current range of 5.25-5.50%. While time will tell what Powell and company decide, we would note that price action of the S&P 500 intraday on all Fed days since 1994 (when the FOMC first began announcing its decision on the same days as the meeting) when the FOMC holds rates steady has historically been less volatile, particularly post-decision, than when rates are cut or raised.

We would also note that the S&P 500 is currently trading lower by 0.86% as of this writing today in the wake of poorly received mega-cap earnings of Alphabet (GOOGL) and Microsoft (MSFT). While those drags on the market are independent of the Fed, that negative tone could lead to the first decline on a Fed day since the September meeting. As shown below, the meetings of the past couple of months have offered a positive change in tone after the S&P 500 largely fell on Fed days throughout late 2022 and 2023.

Not only have the past couple of meetings seen a more positive response from the S&P 500 but the moves have been particularly pronounced in afternoon trading. Below we show the intraday path of the S&P 500 on recent Fed days. The past two meetings (November and December) have resulted in gains of over 1% by the end of the day. However, in a stark difference to other recent meetings, the bulk of those gains have come from strong afternoon rallies in the wake of the decision. As shown by the red line below, the average if the prior ten meetings (those occurring from July 2022 through this past September) saw the S&P 500 trade higher throughout the session up until the final hour of trading when it gave up the ghost and closed at the lows of the day.

Looking back through all Fed days since 1994 when the FOMC began to announce its decisions on the same day of the meeting, there have been 14 times in which the S&P 500 was down by 0.5% or more by noon. Below we have constructed an intraday composite of those days. While the S&P has tended towards weakness throughout most of the session, it has experienced a rally, eating into those losses post-decision. That being said, the gains were not enough to erase all of the pre-announcement declines and the rally tended to be short-lived. Of those 14 days when the S&P 500 was down 0.5% or more by noon, it only closed higher on the day five times.

Bespoke’s Morning Lineup – 1/31/24 – That Was Fast
See what’s driving market performance around the world in today’s Morning Lineup. Bespoke’s Morning Lineup is the best way to start your trading day. Read it now by starting a two-week trial to Bespoke Premium. CLICK HERE to learn more and start your trial.
“The function of socialism is to raise suffering to a higher level.” – Norman Mailer

Below is a snippet of commentary from today’s Morning Lineup. Start a two-week trial to Bespoke Premium to view the full report.
January often seems like the longest month of the year, but it’s hard to believe it’s already winding down. What’s been a strong month for equities so far looks to be going out on a sour note as earnings from mega-caps like Alphabet (GOOGL), Microsoft (MSFT), and Tesla (TSLA) haven’t impressed investors. Based on today’s pre-market levels, all three stocks have traded down in reaction to their earnings reports. That leaves Apple (AAPL), Amazon.com (AMZN), and Meta (META) on Thursday as the last chances to salvage something from the mega-cap space this earnings season (NVIDIA doesn’t report until late February).
On the economic calendar today, the ADP Employment report for January missed forecasts coming in at a level of 107K compared to forecasts for an increase of 150K. The Employment Cost Index was also just released and showed a smaller-than-expected increase of 0.9% compared to forecasts for growth of 1.0%. The only other report on the calendar for the day is the Chicago PMI at 9:45 which is expected to modestly increase from 46.9 to 48.0. But the most important event of the day is the FOMC’s rate decision at 2 PM, and given expectations for no change in rates, every word of Powell’s press conference thirty minutes later will be dissected down to each syllable.
As mentioned above, the first of the mega caps to report haven’t impressed investors so far this earnings season. Earnings reports are just one day in a quarter, though. While a positive stock price reaction to an earnings report can be nice, it’s only a small part of the picture.
Look at the chart of GOOGL below. With the stock trading down over 5% in the pre-market, it is now on pace to have its fifth negative earnings reaction day in the last six quarters. To put that in perspective, if you had purchased the stock at the close on the day of its earnings report and only held it through the close on its earnings reaction day, you’d be down just over 21% on these six trading days alone. Over the entire period and including these six days, though, GOOGL’s cumulative performance has been a gain of over 51%. Again, not only is a stock’s performance on its earnings reaction day a small part of a bigger picture, but it can also be wildly inaccurate.

Sign up for a two-week trial to Bespoke Premium to continue reading more of today’s macro analysis.
Powell: Only Game in Town?
The FOMC kicks off its first monetary policy meeting of the year this morning with a decision tomorrow, but with universal agreement that there will be no change in rates, what Chair Powell says in his 2:30 PM ET press conference will be the primary focus of investors around the world. Some would have you believe that the prospects for the market this year rest entirely on Powell’s words, so that if he’s dovish, there’s hope for the bulls, but if he comes out as hawkish, all hope will be lost.
A hawkish tone by the Fed Chair would likely be seen as a negative short-term development for the market, but at the same time, the relationship is not as binary as many seem to believe. The chart below compares the performance of the S&P 500 to the market pricing for the probability of a rate cut at the March meeting (based on Fed Fund Futures) since last October. While equities bottomed and started to rally in late October, it wasn’t until late November that the odds for a rate cut in March started to increase and move out of their range (red-shaded area). By that time the S&P 500 was nearly 10% above its low and 3.5% above the high end of its October range. From late November through late December, both the S&P 500 and the odds of a rate cut rose in unison with each other, but pricing for a March rate cut peaked on 12/22. On that day, the S&P 500 closed at 4,754.63, and since then, the odds of a March cut have been cut in half to 44.6%. Over that same period, the S&P 500 is up over 3.5%. If the Fed was driving the bus, how come the market hasn’t been going along for the ride lately?
