A Better Than Average Decade
The S&P 500 rallied 3.6% on a total-return basis in November, which was the best monthly return for the index since June but surprisingly only the fourth-best month so far in 2019. That’s how strong equities have been this year! This November was also the best November for the S&P 500 since 2016 after President Trump was elected. While the S&P 500 is currently up 27.6% YTD on a total return basis, over the last 12 months, the index is ‘only’ up 16.1%. That’s how bad last December was!
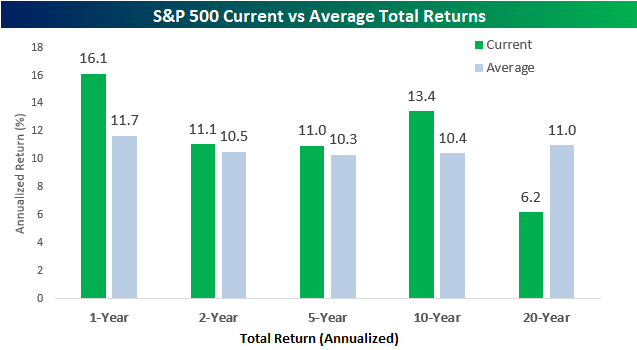
The chart below compares the S&P 500’s annualized returns over the last one, two, five, ten, and twenty years to the average annualized returns of the index for each time period since 1928. The S&P’s current one-year return is already well above its historical average of 11.7%, and barring a major decline in December, this number will be even more skewed a month from now. While the one-year gain is well above average, both the two and five-year annualized returns are actually pretty much right in line with the historical averages.
Longer-term is where the current returns relative to average are really skewed. Over the last 10 years, the S&P 500’s average annualized return of 13.4% is a full three percentage points higher than average. That may not sound like an enormous difference, but over time it adds up; 13.4% compounded over 10 years works out to a cumulative gain of 252% whereas 10.4% compounds to just 169%. While 10-year returns are well above their historical average, returns over the last 20 years have been well below average at 6.2% vs 11.0%. A three percentage point difference adds up over 10 years, but a spread of five percentage points over a 20-year period is enormous. While one could expect to multiply their original investment by seven times if it compounded at 11% annually over a 20-year period, that same investment wouldn’t even multiply by 2.5 times at a rate of 6.2%!
The chart below ranks the S&P 500’s current one, two, five, ten, and twenty-year returns on a percentile basis versus all other periods. Interestingly, the S&P 500’s current one-year performance only ranks in the 58th percentile relative to all other 12-month periods, and the two and five-year returns are both slightly below the 50th percentile. The real extreme, though, is in the S&P 500’s 20-year performance which ranks in just the 5th percentile of all other 20-year periods in the index’s history. As good as the last decade has been for bulls, the decade before was truly treacherous. Sign up for Bespoke’s “2020” special and get our upcoming Bespoke Report 2020 Market Outlook and Investor Toolkit.
![]()
Above Average Volumes on a Low Volume Day
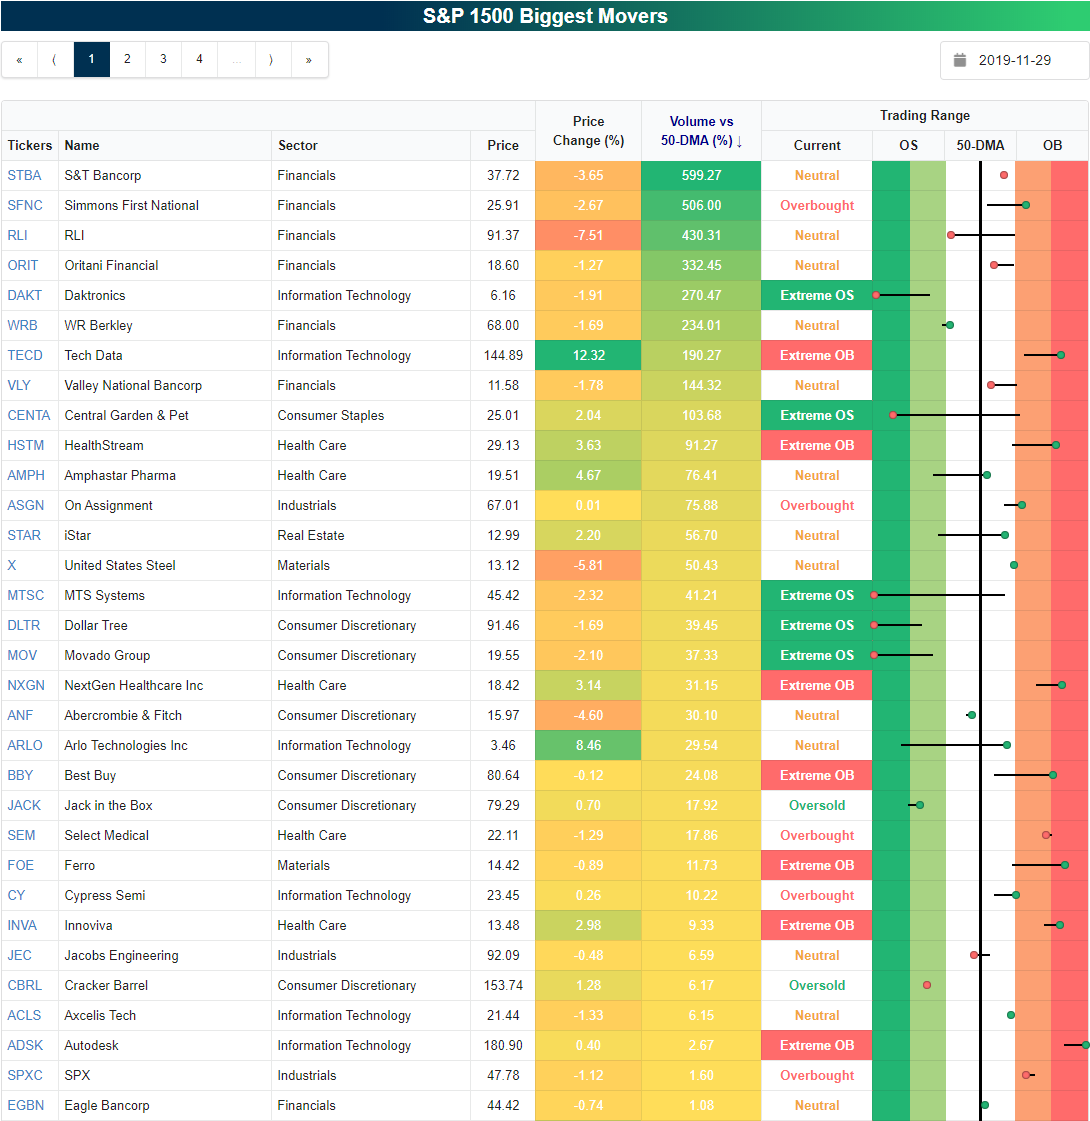
As could be expected due to the shortened session following the Thanksgiving holiday, volumes were very light on Friday. For the S&P 500 (SPY) which declined 40 bps, volumes on Friday were just 62.7% of the 50-day average. In the S&P 1500, there were just 32 stocks that saw above-average volumes. Below is snapshot of them from our Biggest Movers tool, which traders use daily to see the S&P 1500 stocks that rose and fell the most, the highest/lowest volumes relative to their 50-DMAs, and overbought and oversold levels.
Of the 32 stocks that saw above-average volumes on Friday, Tech Data (TECD) rose the most with a 12.32% gain. It was also the best performing stock of the entire S&P 1500 index on Friday. Arlo Technologies (ARLO) also surged on Friday rising more than 8%. While TECD is now extremely overbought with this move, ARLO is not even one standard deviation from its 50-DMA as it was coming off of extremely oversold levels. On the other hand, RLI (RLI) fell the most of the stocks that saw above-average volumes. While TECD was the best stock in the index, RLI was the fourth worst. Most other high volume stocks on Friday experienced more modest price changes.
While RLI and TECD were some of the biggest movers, they also saw elevated volumes of double or more their 50-day average. Other stocks that saw similarly elevated volumes include: S&T Bancorp (STBA), Simmons First National (SFNC), Oritani Financial (ORIT), Daktronics (DAKT), WR Berkley (WRB), Valley National Bancorp (VLY), and Central Garden & Pet (CENTA). Start a two-week free trial to Bespoke Institutional to access our Biggest Movers page and the rest of our popular interactive investor tools.
Bespoke’s Morning Lineup – 12/2/19 – Futures Fading
See what’s driving market performance around the world in today’s Morning Lineup. Bespoke’s Morning Lineup is the best way to start your trading day. Read it now by starting a two-week free trial to Bespoke Premium. CLICK HERE to learn more and start your free trial.

Bespoke Brunch Reads: 12/1/19
Welcome to Bespoke Brunch Reads — a linkfest of the favorite things we read over the past week. The links are mostly market related, but there are some other interesting subjects covered as well. We hope you enjoy the food for thought as a supplement to the research we provide you during the week.
While you’re here, join Bespoke Premium for 3 months for just $95 with our 2020 Annual Outlook special offer.
Education
The price you can’t pay by Myles Udland (I’m Late To This)
An analysis of why the college admissions scandal that broke earlier this year hit home so hard and was so inevitable given the specific segment of society that it broke from. [Link]
Big Calculator: How Texas Instruments Monopolized Math Class by Maya Kosoff (Medium)
Do you ever wonder why the standard equipment for high school math classes hasn’t changed in decades? It won’t surprise you to discover huge profits behind pricey calculators. [Link]
Tech Mixed-topia
Alexa, Are You Disappointed in Me? Amazon’s Voice Gets More Range by Matt Day (Bloomberg)
While the core functionality of the Alexa voice assistant won’t change, how it speaks to you is getting an expanded range in its latest update. [Link]
Mass. State Police Tested Out Boston Dynamics’ Spot The Robot Dog. Civil Liberties Advocates Want To Know More by Ally Jarmanning (WBUR)
Police in Massachusetts are using a Boston Dynamics robot in tests with their bomb squad, raising questions about the deployment of robotic tools by police forces. [Link]
Economics
A charity dropped a massive stimulus package on rural Kenya — and transformed the economy by Dylan Matthews (Vox)
A summary of new research studying large gifts of cash to the poor in East Africa: obviously there were positive impacts on recipients but there were also large multipliers and limited inflation effects, adding to the overall benefits of the transfers. [Link]
Giving Thanks for Property Rights by Caroline Baum (E21)
Forgive some of the hyperbolic language, because this account of how private property rights helped cement the Plymouth Colony in New England is worth a read. [Link]
Sports
Wall Street Wades Into Sports Gambling as Legalization Spreads by Annie Massa (Bloomberg)
With live legal sports betting spreading across the country, markets hawks are gearing up to dump capital into the evolving market. [Link; soft paywall]
Podcasts
The pod delusion by Matt Labash (Spectator)
Polemic against the spreading scourge of audio content that has come to dominate both the media and the personal lives of many would-be hosts. [Link]
Weather
The weather is big business, and it’s veering toward a collision with the federal government by Andrew Freedman (Greenwich Time/WaPo)
With falling costs to launch satellites and crunch data, private weather forecasters are now competing with NOAA to provide detailed weather information and warnings. [Link; auto-playing video]
Read Bespoke’s most actionable market research by joining Bespoke Premium today! Get started here.
Have a great weekend!
The Closer: End of Week Charts — 11/29/19
Looking for deeper insight on global markets and economics? In tonight’s Closer sent to Bespoke clients, we recap weekly price action in major asset classes, update economic surprise index data for major economies, chart the weekly Commitment of Traders report from the CFTC, and provide our normal nightly update on ETF performance, volume and price movers, and the Bespoke Market Timing Model. We also take a look at the trend in various developed market FX markets.

The Closer is one of our most popular reports, and you can sign up for a free trial below to see it!
See tonight’s Closer by starting a two-week free trial to Bespoke Institutional now!
Next Week’s Economic Indicators – 11/29/19
Even with a holiday and a shortened session Friday leaving no US releases in the past 48 hours, it was a very busy week for economic data with 36 releases in the first three days. Most of this data came in stronger than expected or above the prior reading where there were no forecasts. While the bulk of the week’s data was strong, manufacturing data, namely from the regional Fed indices, was mixed. We started off with a weaker Chicago Fed National Activity Index on Monday. The index fell from -0.45 last month to -0.71 rather than the expected improvement to -0.2. The Dallas Fed’s index was also out on Monday and it improved more than expected as well as versus the prior month. On Tuesday, the Richmond Fed’s gauge on manufacturing was also worse than expected. On the bright side, other manufacturing hard data like durable goods came in much stronger than both the previous month and consensus forecasts. Housing data was also solid this week with better than anticipated home price growth shown in two of the three indicators: the quarterly Home Price Purchase Index, FHFA, and Case-Shiller (only the Case-Shiller index was weaker than expected, albeit up from the prior month). The second release of third-quarter GDP was the most notable indicator of the week with a much stronger than expected reading which showed the economy grew by 2.1% QoQ versus estimates of a 1.9% growth rate.

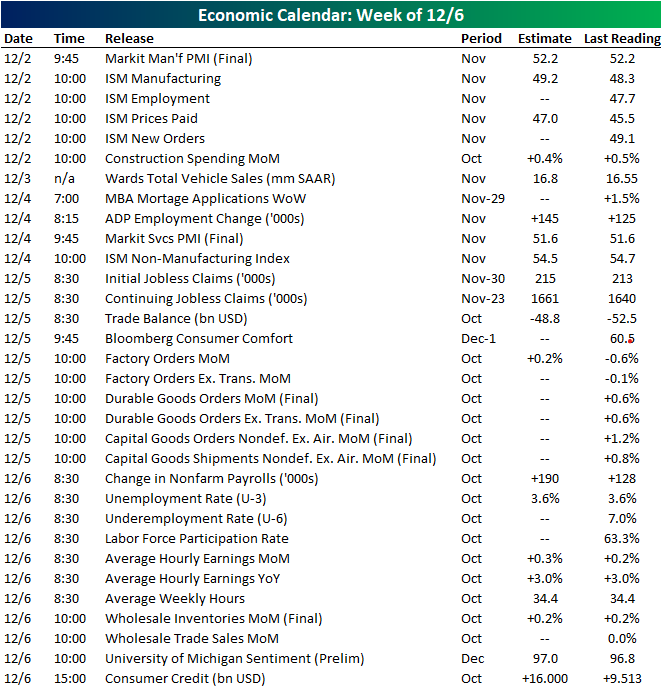
We kick off December with another busy few days next week. Final November Markit and ISM numbers will kick off the week on Monday. While Markit is not expecting any change from the preliminary readings, ISM is expected to improve to 49.2 which would still be a contractionary print. In hard manufacturing data, later in the week we will see final durable and capital goods numbers for November. Vehicle sales figures will be the only release on Tuesday followed by the service counterparts to Markit and ISM indices on Wednesday as the rest of the week’s main focus will be on labor data. After a surprisingly strong release last month, Nonfarm Payrolls is again expecting a strong print showing 190K jobs created in the month of November. Start a two-week free trial to Bespoke Institutional to access our interactive economic indicators monitor and much more.
Bespoke’s Sector Snapshot — 11/29/19
B.I.G. Tips – December 2019 Seasonality
Sentiment In A Food Coma
The American Association of Individual Investors released their weekly survey tracking investor sentiment, and in spite of even more record highs being put in place in the past week, the survey’s results did not show any major shifts and bullish sentiment remains below the historical average. The percentage of bullish respondents fell slightly this week (0.6 percentage points) down to 33.6%.

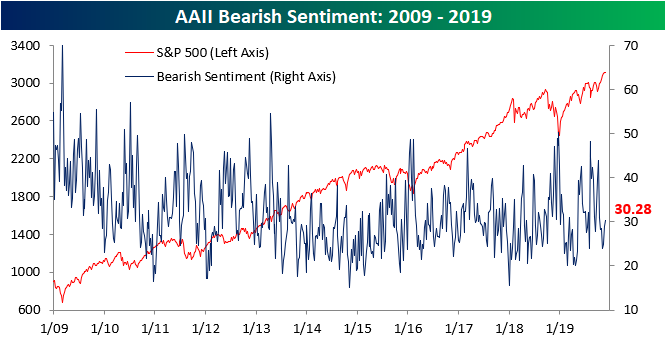
Bearish sentiment saw a similarly small move this week rising by 1.25 percentage points, moving back above 30% for the first time since mid-October. While the percentage of investors reporting as bearish is well off of the recent low of 23.93% put in place earlier this month, it is also at the lower end of the past several months’ range and just slightly lower than the historical average of 30.36%.
Neutral sentiment saw a roughly equivalent move to bullish sentiment falling 0.63 percentage points. For most of 2019, neutral sentiment has been consistently elevated relative to the past few years with the move this week leaving the reading in the middle of its recent range. As we discussed last week, neutral sentiment has been above its historical average for a pretty long time, and this week’s reading was the 16th straight making it the longest streak of above-average readings since 2017. While above its historical average, as with bullish and bearish sentiment, it is still within a normal range (within one standard deviation of the average).

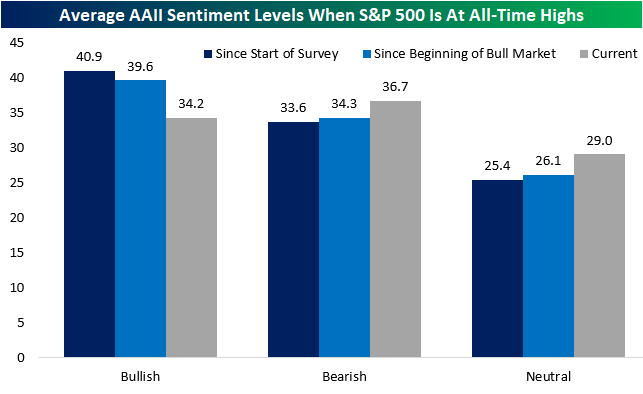
Unlike the S&P 500 and other major equity indices that have ripped higher this November, sentiment has remained rather subdued. As shown in the chart below, typically when the S&P 500 has reached record highs sentiment across the board has leaned more bullish than it currently is. Since the AAII survey began in 1987, bullish sentiment has averaged 40.9% when the S&P 500 closed at a record high. That is a 6.7 percentage point difference from where things currently stand. Even in regards to the current bull market beginning in 2009, all-time highs have typically seen bullish sentiment more elevated. Likewise, bearish and neutral sentiment is higher than the average for other all-time highs both since 1987 and in the current bull market. Despite this, there have been plenty of other record highs where sentiment has been even more subdued. Out of all the record S&P 500 highs since the survey began, the current reading on bullish sentiment is only in the 20th percentile. So while it is low, it could also be much lower.
While AAII’s survey did not see any major changes this week, another investor sentiment survey from Investors Intelligence was perhaps more notable. That survey’s reading on bullish sentiment has been consistently grinding higher over the past quarter with increases in all but two weeks. Rising again this week to 58.1%, bullish sentiment by this measure is the highest since October of last year when it was 61.8%.

The Investors Intelligence survey also gauges investor expectations for a correction. That reading fell again this week marking the tenth decline out of the past twelve weeks. While not a new low, this indicator is also sitting around levels that have not been observed since October of last year. Start a two-week free trial to Bespoke Institutional to access our interactive economic indicators monitor and much more.

Latin American Equities Go Their Own Way (Lower)
The rally in equities over the last several days hasn’t just been confined to the US. As shown in the snapshot below of regional global ETFs from our Trend Analyzer, with the exception of the Latin America 40 ETF (ILF), every ETF has had a positive return over the last five trading days, and most are up over 1%. It’s definitely nice to see equities trade broadly higher, but with those gains, they are pretty much all trading at (or close to) overbought levels. The only one that isn’t is also the only one that is down over the last week (ILF).
ILF is also the only ETF that is below its 50-day moving average and the only one up less than 5% YTD. In looking at the performance of the ETF’s components, it hasn’t just been a handful of names dragging LatAm down. YTD, nearly half of the ETF’s stocks are in the red, including its two largest components (Itau and Vale) which both have 9% weightings and are down close to 10%. Sign up for Bespoke’s “2020” special and get our upcoming Bespoke Report 2020 Market Outlook and Investor Toolkit.
