B.I.G. Tips – Market Performance After 5%+ Drops
Electric Dominating Global Auto Maker Market Cap
In today’s Chart of the Day, we detailed Tesla’s (TSLA) rise above $1,000 and what other stocks like Google (GOOGL) and Amazon (AMZN) have looked like when they first crossed $1,000. With TSLA reaching these kinds of levels, it also now has a record share of the total market cap of global automobile makers. Including the electric car company with the other 20 companies in the S&P Global 1200 Automobile Index, TSLA accounts for just over 22% of the total market cap. That is the second-largest of any company behind only Toyota whose $210.69 bn (USD-adjusted) accounts for 24.43%. As we have detailed in the past, TSLA’s market cap is now significantly larger than other US automobile producers like Ford (F), General Motors (GM), and Harley Davidson (HOG). In fact, it is now more than double the market caps of those companies combined! The rest of the world’s automobile companies including Japanese names like Honda and German names like BMW and Daimler (Mercedes) account for 69.58% of the total market cap.
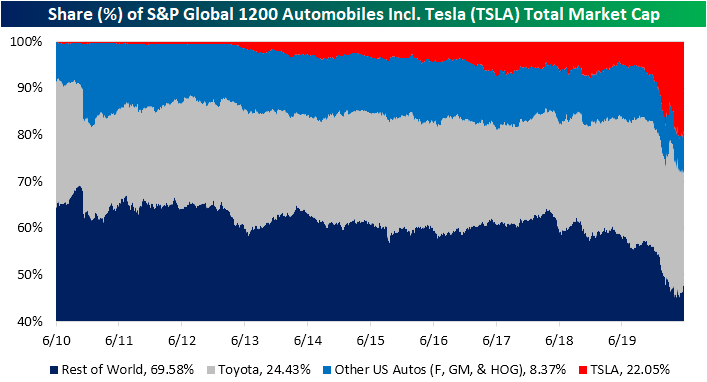
Although TSLA accounts for a massive share of world automaker’s market cap, it still makes up for a very small share of these companies’ total revenues. In fact, its $24.58 bn in sales in 2019 only accounted for 1.29% of all these companies’ total revenues. Albeit it is a high growth name, that leaves it with one of the higher valuations on a P/S and P/B basis. A similar dynamic can be seen for other high-end brands like Italian brand Ferrari and German brand Porsche. The same can be said for another electric vehicle stock that has received a large amount of headline attention recently, Nikola (NKLA). NKLA likewise is another name with a fairly large disparity between its sales and share of market cap. Another high growth name and recent IPO, Nikola actually had no revenues in 2019 but is valued at $23.46 bn or 2.56% of total market cap. That is more than some other major global brands like Hyundai, Suzuki, and Subaru to name a few. Click here to view Bespoke’s premium membership options for our best research available.

Bulls Coming Back in Favor
Although the weekly sentiment survey would not have captured equities’ sharp decline today, bullish sentiment through AAII’s weekly survey was lower by 0.27 percentage points to 34.28% this week despite the S&P 500’s general move higher in the past week. That was the smallest absolute weekly change for bullish sentiment since the final week of June of last year when it had risen by just 0.08 percentage points.

Bearish sentiment likewise was headed lower this week falling by 0.82 percentage points. That left bearish sentiment at 38.05% which is the lowest reading since February 20th.

That means most of the move this week went to neutral sentiment which was up from 26.58% last week to 27.67% this week. After being extremely muted for most of the COVID collapse, it is now at its highest level since the last week of February.

The bull-bear spread rose again this week and is now at -3.77. The spread overall still favors bears as it has for nearly four months now but is the closest to favoring bulls since early March when it stood at -0.9. This week also marked a fifth consecutive week in which the spread has risen. That is one of the longer streaks on record as shown in the second chart below and the longest since July of last year. If that streak continues through next week, it would be tied with three other streaks from 2007, 2014, and 2019 for the second-longest such streak on record.


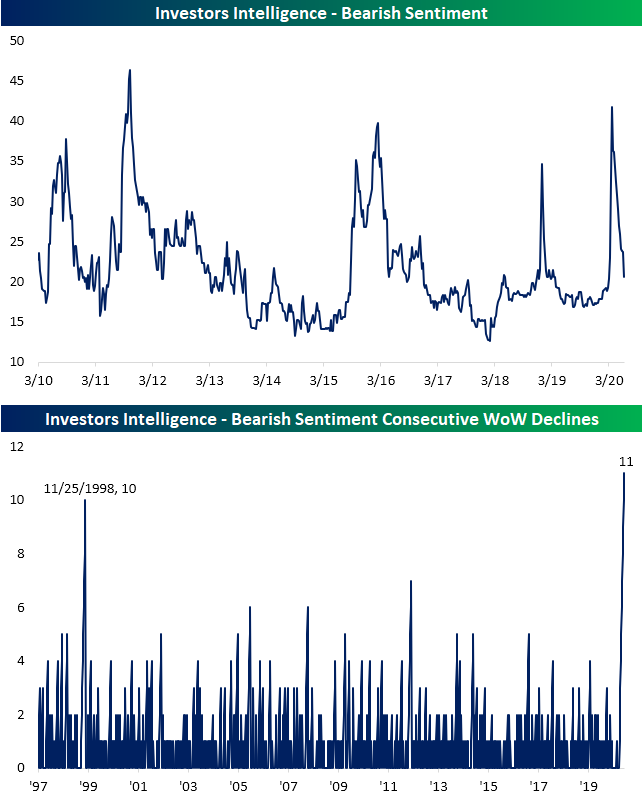
The Investors Intelligence survey is echoing the increasing bullish tones. Both bullish and bearish sentiment in this survey experienced the largest increase and decline, respectively, since the middle of April. Bullish sentiment is now 56.9% which is the highest level since January 22nd and in the 85th percentile of all readings of the past decade. This week was also a fourth consecutive and tenth of the last eleven weeks that bullish sentiment was higher week over week.

Bearish sentiment on the other hand is down to 20.6% which is the lowest level since the beginning of March. Although that only brings it to the middle of the past decade’s range, this week was the eleventh straight week with a WoW decline. As shown in the second chart below, that is the longest streak since at least 1997. Click here to view Bespoke’s premium membership options for our best research available.
B.I.G. Tips – Line Keeps Going Down
Chart of the Day: Telsa (TSLA) Tops $1,000
Claims Finally Beat Estimates
Weekly jobless claims have been a mixed bag over the past several weeks. Though they have been consistently declining to their lowest levels since the start of the pandemic, they still are well over a million and that is excluding other claims like Pandemic Unemployment Assistance (PUA). Additionally, continuing claims remain elevated at over 20 million this week. This week was more of the same for initial jobless claims as they fell to 1.542 million; a tenth consecutive decline WoW which is the longest such streak on record. This week’s 355K decline was the largest WoW decline since 5/8 when they fell 489K. That brings the total number of initial jobless claims filed since the first over 1 million print in late March to over 44 million.

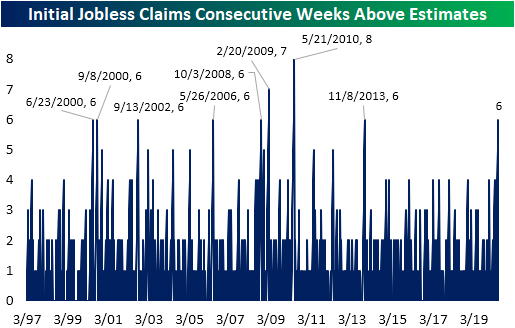
On top of being the lowest reading since late March and one of the larger WoW declines of the past couple of months, another positive of this week’s data was that it beat estimates. That was the first time this has happened in six weeks. As shown below, there have been several other streaks that initial jobless claims missed expectations for at least six straight weeks since the early 1990s. Only two of those streaks, one in 2009 and anther in 2010, came to an end at more than six weeks (seven and eight, respectively). This most recent streak was the first time claims missed that often since 2013.
As for the non-seasonally adjusted number, this week’s decline to 1.54 million was much more muted at only 82.9K. That still leaves claims at their lowest levels since the first print over 1 million and a ninth consecutive week with NSA claims lower. But this was also the smallest improvement for any week since claims began to work off their peak. Click here to view Bespoke’s premium membership options for our best research available.

Bespoke’s Morning Lineup – 6/11/20 – A Dose of Reality
See what’s driving market performance around the world in today’s Morning Lineup. Bespoke’s Morning Lineup is the best way to start your trading day. Read it now by starting a two-week free trial to Bespoke Premium. CLICK HERE to learn more and start your free trial.
Markets have seemingly been moving in one direction for the last several weeks, but today are getting a dose of reality on concerns over the pace of the economic rebound and whether it will be derailed by a new surge in cases around the country. No one said the recovery would be a smooth one.
If the current pace of declines holds, today will be the first 1% decline at the open for SPY since May 1st, and the 7th since the March 23rd low. If those prior periods are any indication, don’t look for much in the way of a rebound. In the six prior occurrences, the S&P 500 continued lower from the open to close four out of six times.
Be sure to check out today’s Morning Lineup for a rundown of the latest stock-specific news of note, moves in overseas markets, global and national trends related to the COVID-19 outbreak, and much more. In today’s report, we have also started to include data on state by state trends in hospitalizations.

In yesterday’s Chart of the Day, we highlighted the strong performance of large-cap tech as measured by the FANG+ Index over the four weeks. This morning we wanted to highlight the recent strength in another way by noting that yesterday’s rally was the fourth straight day where the FANG+ Index rallied 1% or more. As indicated by the red dots in the chart below, that’s only happened four other times in the index’s history dating back to 2014.

Chart of the Day: FAANG+ In Uncharted Waters
Daily Sector Snapshot — 6/10/20
Are Retail Investors Driving Price Action?
We’ve seen a lot of media coverage focused on the idea that small investors are piling into the market and driving lots of the aggressive price action in recent months. This phenomenon was around before the March plunge in the market, but with bankrupt rental car companies (HTZ), flailing airlines (AAL), and Chapter 11 energy names (CHK) showing up in lists of stocks most widely-held by retail investors along with hyper-speculative plays on hot new products like electric truck manufacturer NKLA, it’s easy to see why people might get the idea that small retail investors flush with commission-free trading confidence might be having an outsized impact.
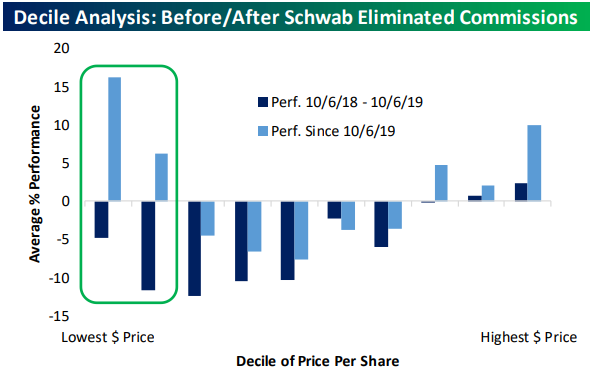
To test this theory, we started with the theory that relatively small traders are more likely to buy lower dollar price stocks. It’s easier to dip your toe into a $1 stock than a $150 stock, even if the division of the company’s value is arbitrary. For small-dollar accounts, that truism is the most important. Starting on October 7th of last year, Charles Schwab (SCHW) started offering commission-free trading to brokerage clients, competing with popular zero-commission product Robinhood. Fidelity and other brokers followed shortly after. In the year before October 7th, stocks with low dollar prices were notable underperformers relative to the rest of the market. The chart below uses the Russell 3000 as its sample and breaks the index into deciles (10 groups of 300 stocks each) based on share price. Since Schwab went to $0 commissions, the lowest priced stocks have been huge outperformers, and in fact the decile of stocks with the lowest per share prices are up 15%, substantially more than the rest of the market. To us, this looks like plausible evidence that smaller traders are playing at least some role in the performance of the market. We discussed this chart and other retail enthusiasm indicators in last night’s Closer report, which is available to Bespoke Institutional members. Click here to start a two-week free trial.
We’d note that the decile of the highest priced stocks has also outperformed over the same time period. Since $0 commissions began, we’ve also seen the introduction of fractional share trading on many online brokerage platforms, which allows investors to buy stocks by dollar amount instead of share amount. This now lets a small-dollar investor easily invest in high-priced stocks above $1,000/share like AMZN and GOOGL. Instead of having to buy a share of AMZN at $1,400, an investor can now simply buy $100 worth of AMZN and own a fraction of a share.