Facebook (FB) and Tesla (TSLA) Set for 5%+ Gaps Higher on Earnings
Our popular Earnings Explorer tool has quarterly earnings results and share price reactions to those earnings reports for nearly every US stock going back to 2001. The database is online, massive, and it’s interactive so that users can quickly look up historical results for individual companies. One way to use the database is to see how stocks that are set to experience huge opens higher on earnings typically trade from the open to the close of trading after their initial moves higher. Two stocks that are set to gap up sharply on earnings this morning are Facebook (FB) and Tesla (TSLA). At the moment, both are set to open higher by more than 5%.
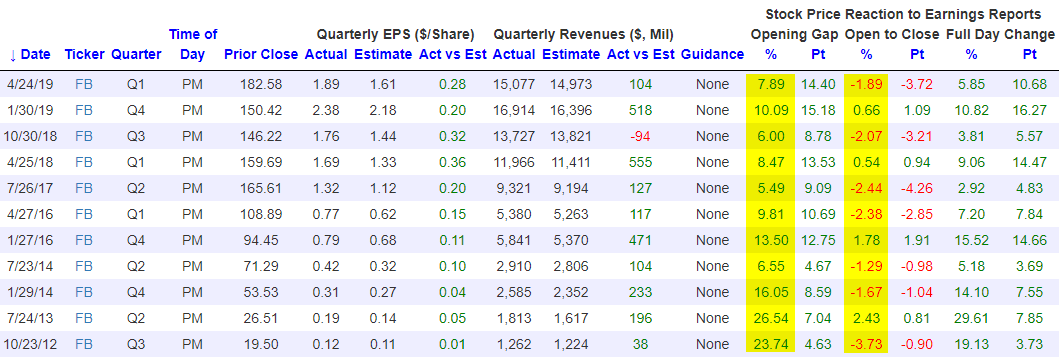
Below we have pulled all historical instances in which both Facebook and Tesla have gapped higher by at least 5% at the open of trading following quarterly earnings reports. Coincidentally, each stock has had 11 prior gaps up of 5%+ on earnings in their history as public companies. For Facebook (FB), when it has gapped up 5%+ in the past, it has actually traded lower from the open to the close 7 of 11 times for an average open to close change of -0.91%. This tells us that at least in the past, investors have more often than not used these opportunities to lighten up on shares during the regular trading day.
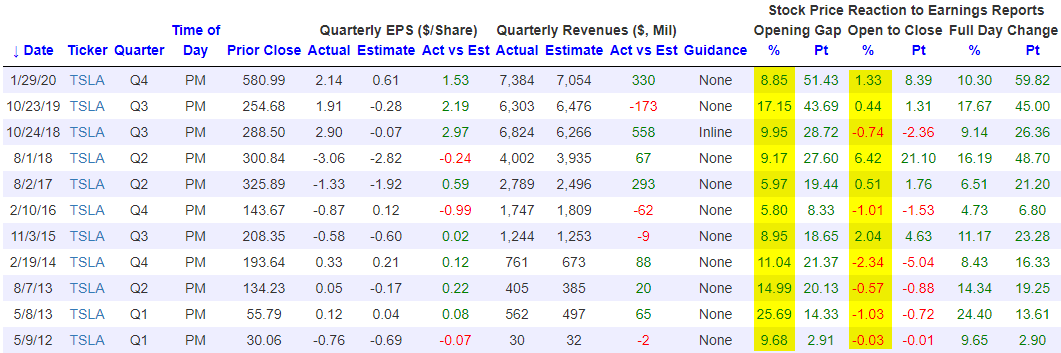
For Tesla (TSLA), when it has gapped up 5%+ on earnings, the stock has also traded down from the open to the close more often than it has traded up from the open to the close, but its average open to close change on these 11 prior gaps higher has been positive at +0.46%. We’d note that this will be the third quarter in a row that TSLA has opened higher by 5%+ on earnings, and the prior two quarters saw a slight positive move from the open to the close for the stock. If you’d like to test out our Earnings Explorer tool to see how your stocks typically trade on earnings, start a two-week free trial to Bespoke Institutional. You’ll also gain access to our entire platform that includes our most actionable research reports and our full suite of investor tools.
50-DMAs in the Rearview
Stocks have continued to rally this week and for many individual names, these gains have lifted them above their 50-DMAs. As shown in the chart below, over three quarters of stocks in the S&P 500 have now moved back above their 50-DMAs. Three sectors—Technology, Communication Services, and Health Care—have more than 90% of their stocks above their 50-DMAs with Health Care leading the way at 96.7%. Readings above 90% are very rare — just as rare as the sub-10% readings we saw in March. As for the other sectors, similar to the S&P 500, Consumer Staples, Consumer Discretionary, and Materials all have over three-quarters of their stocks above their 50-DMAs. Meanwhile, Financials, Industrials, and Energy are lagging somewhat but still have more than half of their stocks above. The only two sectors that are truly lagging with just 32.1% and 38.7% above, respectively, are Utilities and Real Estate — two defensives.

Health Care and to a lesser degree Consumer Staples were the first sectors to see a large number of stocks trade above their 50-DMAs. This reading for both sectors saw a more gradual build throughout April. As for the rest, the percentage of stocks trading above their 50-DMAs has exploded higher and in a much more rapid fashion, especially within the past week. In fact, as recently as last Thursday, excluding Health Care and Consumer Staples, the highest reading across sectors was only 40.85% (Technology). The big pickup in the number of stocks moving above their 50-DMAs means two things. For starters, many stocks are clearing resistance at their averages which is a positive technical development. Second, many stocks are roughly around the same areas of their trading ranges and are moving higher together (strong breadth). Start a two-week free trial to Bespoke Institutional to access our interactive economic indicators monitor and much more.

Bespoke’s Morning Lineup – 4/30/20 – The Last Shall Be First
See what’s driving market performance around the world in today’s Morning Lineup. Bespoke’s Morning Lineup is the best way to start your trading day. Read it now by starting a two-week free trial to Bespoke Premium. CLICK HERE to learn more and start your free trial.
Futures were higher overnight but started to lose steam right around the time Europe opened for business. Technology is holding up a bit better, though, following strong earnings reports from Microsoft (MSFT) and Facebook (FB) among others. Jobless claims were just released, and while economists were expecting a reading of 3.5 million, the actual level of claims was higher at 3.839 million.
Be sure to check out today’s Morning Lineup for a rundown of the latest major earnings reports from the US and Europe, European economic data, and the latest trends in the COVID outbreak on a global, national, and state by state basis.

The trading range picture of major US indices from our Trend Analyzer tool shows a number of interesting trends. We’ll just start off at the top. Take the Nasdaq 100. After Wednesday’s gain, the QQQ ETF is actually up over 3% YTD and nearly 9% above its 50-day moving average. With that type of spread versus the 50-DMA, the Nasdaq 100 is the only major US index that is at overbought levels (>1 standard deviation above its 50-DMA). The table below is sorted by the degree to which each index is trading relative to its 50-DMA (measured in standard deviations), and it’s no surprise that the top is loaded with large caps, and generally speaking, the further down you move the list, the smaller in market cap the indices get. On a YTD basis as well, the indices that are further above their 50-DMAs are doing better YTD while the smaller market cap indices are down the most.
While large caps have been outperforming on a YTD basis, in the last five days, the complete opposite has been the case. Indices representing small and mid-cap indices are all up between 10% and 15% or more than double their large-cap peers. Small caps were hit the hardest on the way down on concerns that they wouldn’t be able to withstand the economic calamity as well large-caps, but optimism that economic activity will come back online sooner than expected has really breathed some life into the sector.

Daily Sector Snapshot — 4/29/20
Chart of the Day – An Impressive Streak for Small Caps
Energy (XLE) Finally Above Its 50-DMA
As we noted yesterday, more and more sectors have begun to cross back above their 50-DMAs in the last couple of weeks. With the outperformance of recent underperformers in yesterday’s session, the most beaten-down sector, Energy (XLE), finally managed to move back above its 50-DMA. Yesterday marked the first time that XLE had closed above its 50-DMA since January 10th. As for today, XLE is poised to gap up over 3% at the open bringing it further above its 50-DMA.

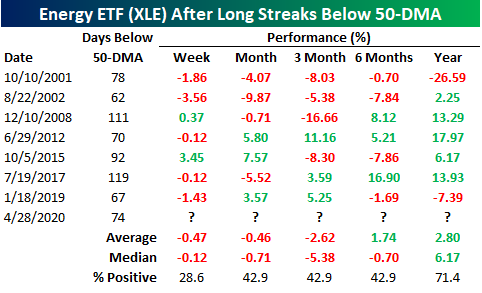
With XLE being under its 50-DMA for nearly four full months, that streak ending at 74 trading days was the fifth-longest in the ETF’s history. The last time XLE experienced a similar streak was in 2017 which was actually the longest streak on record ending at 119 days. The other longer streaks came in 2015, 2008, and in 2001.

As for performance after these long streaks below the 50-DMA come to an end, XLE has typically been pretty weak. In the table below, we look at all prior streaks below the 50-DMA that lasted for at least 60 trading days (roughly three months). One week after such streaks come to an end has only seen XLE higher around a quarter of the time with an average decline of 0.47%. Returns have also been positive less than half of the time one, three, and six months later. Fortunately, one year later XLE has been higher 71.4% of the time with an average gain of 2.8% (median 6.17%), although even here, those returns are nothing to get overly excited about. Start a two-week free trial to Bespoke Institutional to access our full range of research and interactive tools.
Historically Bad GDP For Q1 As Services Suffer
This morning the BEA released one of the worst GDP numbers in the modern history of the US economy. Total output fell 4.79% at annual rates, worse than the 4.0% decline (again, at annual rates) that economists had forecasted. That’s not as bad as the worst numbers from the financial crisis, but the details under the hood were qualitatively different. Instead of being led down by falling capital expenditures and gradually decelerating consumption, Q1 saw an outright collapse in services and durable goods spending with large but historically less remarkable declines in business spending. Services spending has been the steady Eddie of US growth for the better part of a century now: it’s never contributed more than an 82 bps headwind to total QoQ SAAR growth since World War 2. But in Q1 it was a 5% headwind, almost an order of magnitude more than its worst quarter in the global financial crisis. We outline the sobering numbers in more detail below. Start a two-week free trial to Bespoke Institutional to access our Chart Scanner, custom screens, and much more.

Bespoke’s Morning Lineup – 4/29/20 – GDP-U
See what’s driving market performance around the world in today’s Morning Lineup. Bespoke’s Morning Lineup is the best way to start your trading day. Read it now by starting a two-week free trial to Bespoke Premium. CLICK HERE to learn more and start your free trial.
Q1 GDP isn’t even going to be the ‘bad’ quarter of the COVID outbreak, but while economists were expecting GDP to drop 3.9%, the actual decline was even worse than expected at -4.8% and the worst quarter for economic growth since the depths of the recession in Q4 2008. Even worse, Consumption was even weaker, falling 7.6% for its worst quarter since Q2 1980.
While that type of news would be expected to have a negative impact on the market, at the same time that GDP was released, data regarding trials of Gilead’s (GILD) Remdesivir in the treatment of COVID showed positive results and pushed futures even higher.
Be sure to check out today’s Morning Lineup for a rundown of the latest earnings reports, Korena economic data, and the latest data on the COVID outbreak.
While the S&P 500 wasn’t able to hold onto its gains yesterday, the Russell 2000 still managed to finish the day up over 1% for the fifth straight trading day. That’s quite an impressive streak, and in the history of the Russell 2000, this has only happened three other times – October 2008, January 2000, September 2009, and now. Is it finally time for small caps to shine?

Outperformers Underperform
This morning, we highlighted the recent performance of sector ETFs noting how Health Care has led the way higher rising the furthest above its 50-DMA. Consumer Discretionary (XLY), Technology (XLK), Materials (XLB), Communication Services (XLC), and Consumer Staples (XLP) each had also risen above their 50-DMAs. Given their outperformance, as shown in the table below, headed into today these were the sectors closest to their levels on the S&P 500’s last all time high on February 19th. The Health Care ETF (XLV) actually headed into today less than 2% away from its 2/19 levels and XLP was also under 10% away.

Today, that performance was turned on its head as some of the sectors that have been playing catch up outperformed while those that have been the outperformers recently underperformed. Whereas it has typically been the strongest sector, Health Care (XLV) actually fell the most dropping ~2%. On the other hand, Energy (XLE) rose over 2.1% and it even finally rose above its 50-DMA. Other areas of strength today included Financials, Industrials, and Materials which all finished up over 1%. Recent winners were the losers today while the recent laggards were today’s winners. Start a two-week free trial to Bespoke Institutional to access our full range or research and interactive tools.
