Fresh Highs Short Term and Long Term
Stocks ripped higher yesterday with the S&P 500 rising over 3% on the day. For some stocks in the index, this surge in buying helped to finally push price above their ranges that have been in place over the past several weeks. While not every stock in the index that is experiencing this pattern is shown, in the charts from our Chart Scanner tool below, we show 20 S&P 500 stocks that saw this type of breakout from a sideways trend yesterday. These breakouts were not specific to any one group but could be found across the various sectors. While they still have a ways to go until they reach their prior highs, these bullish breakouts also marked the highest levels of these stocks since bottoming in March. For a few stocks, the sideways trends of the past several weeks also coincided with the 200-day and 50-day moving averages which have acted as either support or resistance. That was the case with stocks like Align (ALGN), Best Buy (BBY), CH Robinson Worldwide (CHRW) and Masco (MAS) to name a few.

Not only are some stocks hitting their highest level of the past few weeks but some are also reaching their highest levels of the past year. From our 52-week high screen in our Chart Scanner, the charts below show a dozen S&P 500 stocks that rose to fresh 52-week highs as of yesterday. Again these are not bound to any single group instead showing participation across sectors and industries. Start a two-week free trial to Bespoke Institutional to access our interactive Chart Scanner tool and much more.

B.I.G. Tips – Performance After Big Up Days
Bespoke’s Morning Lineup – 5/19/20 – Not The Turnaround Tuesday That Bulls Want
See what’s driving market performance around the world in today’s Morning Lineup. Bespoke’s Morning Lineup is the best way to start your trading day. Read it now by starting a two-week free trial to Bespoke Premium. CLICK HERE to learn more and start your free trial.
After an impressively strong start to the week yesterday, where equities opened higher and kept going from there, today is looking like the wrong kind of turnaround Tuesday for bulls. Futures are modestly lower as investors digest the big gains from yesterday. Walmart (WMT) reported much better than expected results as consumers stocked up on the essentials during the lockdown sending comp sales up by 10%! While there are still a number of reports left on the calendar, WMT’s report marks the unofficial end to what was a much better earnings season than most expected.
On the economic front, Housing data was mixed as Housing Starts were weaker than expected while Building Permits topped expectations.
Be sure to check out today’s Morning Lineup for a rundown of the latest stock-specific news of note, economic sentiment around the world, the latest global and national trends related to the COVID-19 outbreak, and much more.

In yesterday’s rally, there were two positive developments from a charting perspective spanning both the large and small-cap universe. Starting with large caps, after two tests of the 2,950 range, the third time was the charm yesterday as the S&P 500 appears to have cleared resistance from late April and early May.

The pattern for small-caps doesn’t look quite the same. The Russell 2000’s early May rally didn’t test the highs from late April, and when it pulled back it actually made a lower low. After yesterday’s rally, though, that downtrend from the April high appears to have broken. With a market cap that is much less the combined market cap of Microsoft (MSFT) and Apple (AAPL), it won’t take much for small caps to catch a bid when sentiment finally does start to shift.

Daily Sector Snapshot — 5/18/20
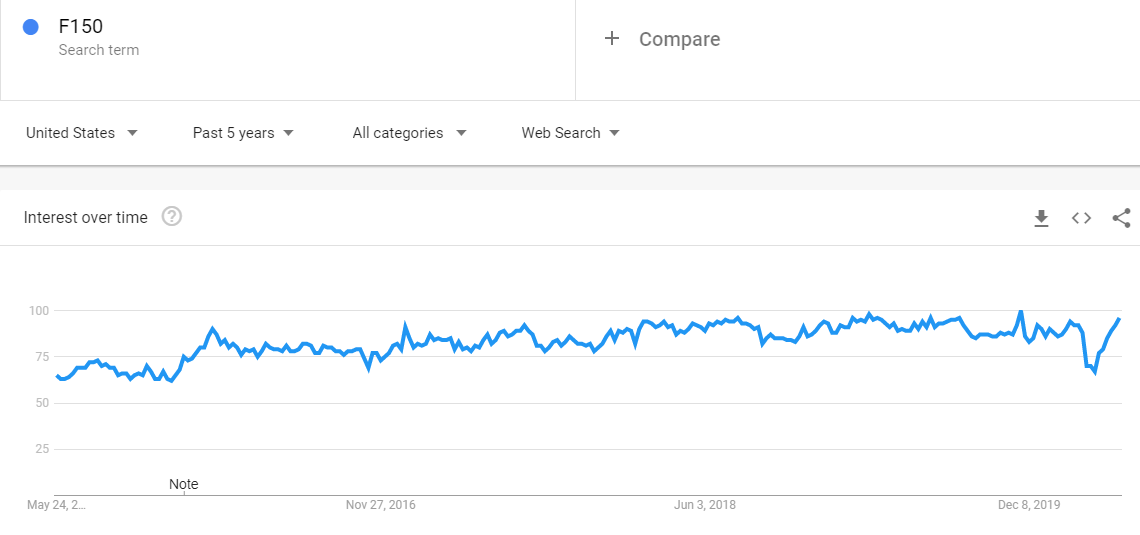
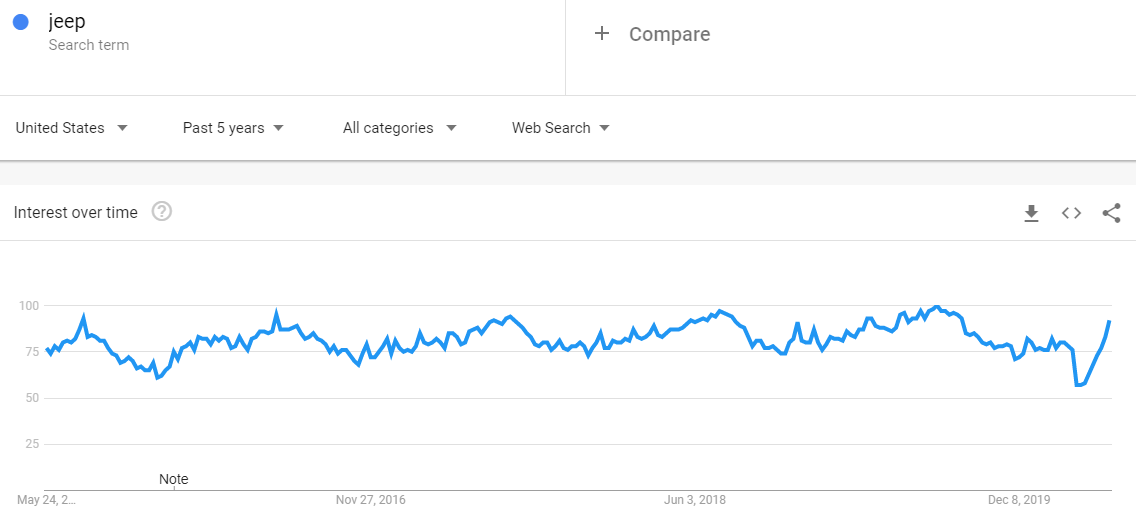
Searches for F-150s and Jeeps Picking Back Up
We’ve been monitoring Google search trends over the last couple of months, and today we noticed that searches are picking up for things like trucks and jeeps. Below are five-year charts of search trends for “F150” — the most popular truck in the country made by Ford — as well as “jeep.” Searches for both hit multi-year lows in the middle of the Covid lockdowns, but they’ve really picked up in recent weeks and are now at pre-Covid levels. Commercial air travel and public transportation will likely remain less appealing options than driving in the post-Covid economy, which is at least one thing the auto industry has going for it. Start a two-week free trial to Bespoke Premium to access our full range of equity market research and interactive tools.
B.I.G. Tips – Overrated: Volume
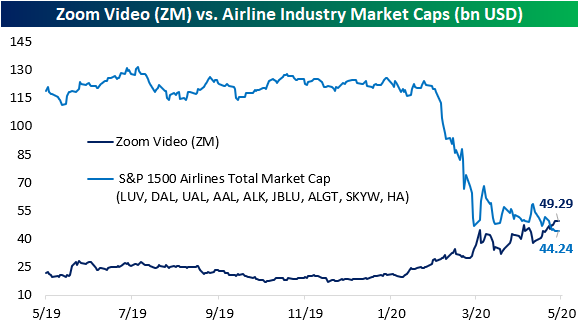
Airlines Out, Video Conferences In
It is no secret that airlines have taken it on the chin just about worse than any other industry during the ongoing pandemic. The nine airlines stocks in the S&P 1500 are down 58.86% on average since the February 19th equity market peak. Whereas the total market cap of these nine stocks stood at well over $100 billion throughout the past year, now it is less than half of that at $44.24 billion. Meanwhile, as consumers adapted to the new economy trading plane rides for video conferences, Zoom Video (ZM) surged over 65% since the 2/19 high. That massive divergence in performance led the company’s market cap to reach $49.29 billion. As of last Wednesday, for the first time the market cap of ZM actually surpassed the total market cap of those nine major airlines as shown in the chart below. But with that comes a very lofty valuation for ZM and deep discount for airlines. Whereas the average forward price to sales ratio for airlines is at only 0.55, Zoom’s is at 47.72. Start a two-week free trial to Bespoke Institutional to access our full range of research and interactive tools.
Homebuilder Sentiment Picking Up
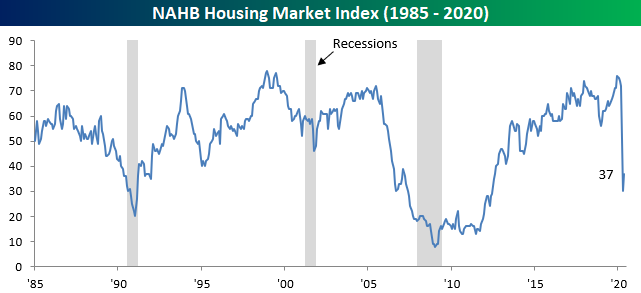
Today’s release of homebuilder sentiment for the month of May from the NAHB helped to confirm that housing data continues to hold up better than other areas of macroeconomic data. Like most other economic data of late, NAHB’s Housing Market Index has collapsed over the past few months and is sitting around some of its lowest levels in years. But unlike other data, it never reached any sort of new drastic low and there was even a significant improvement in May as the index rose from 30 in April to 37. That 7 point month over month increase was the largest monthly increase for the index since another 7 point gain in June of 2013. Outside of that 2013 occurrence and a few other 7 point increases in 2001, 1991, and 1986, there have only been six other months in the history of the survey that have seen the headline index increases by more.
After experiencing record declines across the board in April, as shown in the table below, breadth was pretty strong this month with the only sub-index to fall further being that for the Northeast. Of the sub-indices, expectations for sales for the next six months saw the biggest pickup in May rising 10 points. That is tied with four other months (March of 1991, December 2001, November 1987, and July of 2012) for the second largest monthly increase on record. Traffic also improved significantly rising 8 points. For that sub-index, that was the fourth largest month over month increase on record. Meanwhile present sales also rose, albeit by a lesser degree. In other words, homebuilders appear more optimistic for the future than the current situation.

Looking across the regions, after each one experienced their largest drop ever last month, the Northeast, which remains one of the hardest hit areas of the country by the coronavirus, was the only one to see sentiment fall even further in May. Sentiment in the region is now down to its lowest level since December of 2011 after falling another 2 points. Meanwhile in every other region, sentiment saw significant improvement with the month over month changes for the Midwest, South, and West all being in the 90th percentile or better of all monthly increases. Start a two-week free trial to Bespoke Institutional to access our interactive economic indicators monitor and much more.


Chart of the Day: Gapping & Running To Start The Week
Bespoke’s Morning Lineup – 5/18/20 – A Shot in the Arm For Futures
See what’s driving market performance around the world in today’s Morning Lineup. Bespoke’s Morning Lineup is the best way to start your trading day. Read it now by starting a two-week free trial to Bespoke Premium. CLICK HERE to learn more and start your free trial.
Futures were already higher coming into the morning following last night’s 60 Minutes interview with Fed Chair Powell, where he noted that “There’s really no limit to what we [Fed] can do.” In the last hour, we have seen the premarket gains more than double following news from Moderna (MRNA) that phase one results from its COVID vaccine study showed promising results and was tolerated well by subjects. There’s still a long road to travel before this vaccine would be available even if it proves to be effective, but any light at the end of the tunnel is welcome.
Be sure to check out today’s Morning Lineup for a rundown of the latest stock-specific news of note, economic data out of Singapore and Japan, the latest global and national trends related to the COVID-19 outbreak, and much more.
While it was a negative week for equities, it ended on a positive note with the S&P 500 trading down over 1% on an intraday basis on both Thursday and Friday but managed to finish in positive territory both days. It may not sound all that out of the ordinary, but the last time we saw back to back intraday rebounds of that magnitude was all the way back in January 2009, and there have only been seven other times in the history of SPY that it has happened. Each of those occurrences are highlighted in the chart below. As shown, they were all bunched around 2002 and 2008/2009, and with the exception of the occurrence on 9/12/08, they all typically occurred around bear market lows.
