Chart of the Day: Keeping Tabs on Triple Plays
Mixed Results From Global Data Points Last Night
Below is analysis included in today’s Morning Lineup. You can receive the Morning Lineup in your inbox each day with a Bespoke Premium or Bespoke Institutional membership. Click here to start a two-week free trial. Last night we got a couple of interesting data points about the state of the global economy. The first is near-real-time in the form of Korean trade data for the first 20 days of the month of July. As shown in the chart below, YoY rates of change bounced huge in June after enormous declines in April and May. Unfortunately, the bounce is not continuing, and preliminary trade data continues to run at a -13% YoY pace for the month.

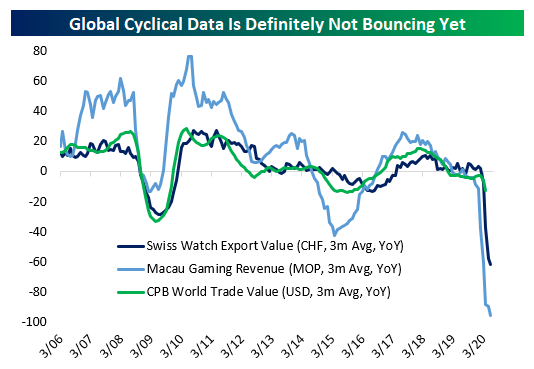
That’s consistent with slightly more lagged alternative indicators that tend to do a good job following the global economic cycle. Swiss watch exports data updated last night showed a very large decline of about one-third YoY; that’s a huge improvement on the two-thirds decline in May, but between that and still-weak performance of Macau’s casinos, it’s hard to find a data point suggesting a robust recovery in economic activity volumes and animal spirits across the global economy.
Where there’s room for hope is in capital expenditures as proxied by the machine tool orders data released each month by Japan’s trade association of manufacturers in that category. This data is very timely, with the revised June numbers showing a little more detail than the headline release a couple of weeks ago. As shown below, Chinese orders have surged while American customers are also stepping up to by at a much faster clip than the last couple of months. While the EU bounce looks small, even that amounts to 10% sequential improvement. These series have a long way to go to get back to “normal” but they’re at least on that path for now. We went into further detail on contribution to total earnings as well as YTD gains in last night’s Closer report, which is available to Bespoke Institutional members. Click here to start a two-week free trial.

Big Blue Beats
Yesterday after the close, IBM reported second-quarter results. Big Blue beat on both the top and bottom line with EPS coming in at $2.18 compared to estimates of $2.09 and revenues were $401.9 million above estimates. Although IBM beat on both the top and bottom line this quarter, EPS and sales have been grinding lower over the past several years as shown in the charts from our Earnings Explorer below. In fact, this quarter still marked EPS down 31% YoY and sales down over 5% YoY.


When it comes to stock price reaction, that beat comes during what has historically been the strongest quarter for IBM. Q2 earnings days have averaged the largest gains of any quarter in terms of the gap up, open to close change, and full-day change. Not only does Q2 experience the largest gains but it is also the quarter that IBM trades higher the most frequently. IBM has traded higher on Q2 earning days 72% of the time. Conversely, IBM has only seen shares trade higher on its Q1 report in April just 21% of the time.

Turning to today, the stock was trading up as much as 6.85% post-market shortly after earnings came out but has reversed some of those gains overnight and is now looking to gap up by 4.75%. That would make for the seventh-largest gap up on earnings for IBM since at least 2001. None of those other largest gaps up happened on a Q2 earnings report.
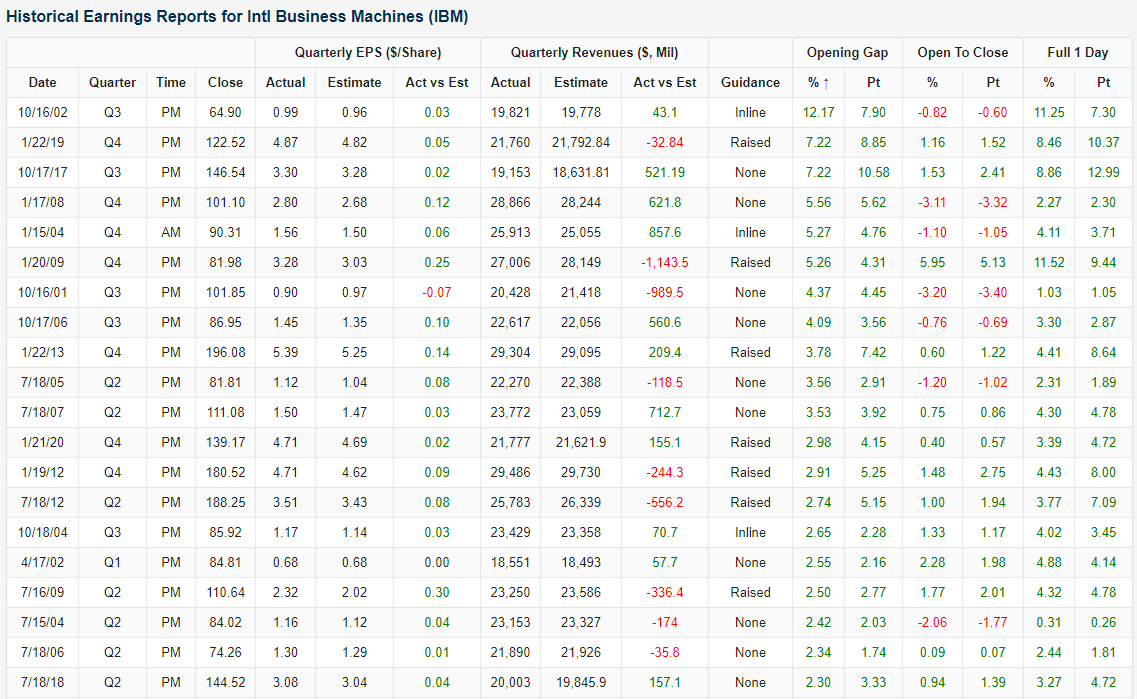
Looking through the history of IBM in our Earnings Explorer database, IBM has beaten both EPS and revenues 30 times. On average, the stock has gapped up 0.67% to be met with minor selling during the day to finish up 0.65%. Of those 30 times, the 6 occurrences in Q2 have seen even stronger returns which seems to be holding true today.

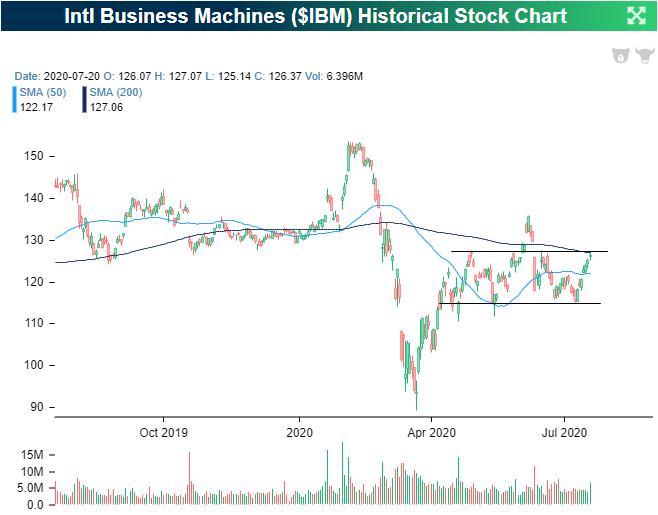
As for where today’s gap up will leave IBM, the stock has been trading in a range for the past few months. In early June, there was a breakout of that range which never held. After returning to the bottom end of said range, IBM has been rallying into earnings closing yesterday at the top of the range and just below its 200-DMA. The gap up on earnings is looking to bring the stock out of that range, above its 200-DMA for the first time since early June, and back up to levels just below its June 8th high. Click here to view Bespoke’s premium membership options for our best research available.
Recapping Monday’s Bad Breadth
By just about all accounts, Monday’s breadth was extremely weak for a day on which the S&P 500 rallied 0.84%. In terms of sector performance, just three sectors were up over 1%, while four declined more than 1%. If you account for rounding, the 0.96% decline for Consumer Staples would make it five!

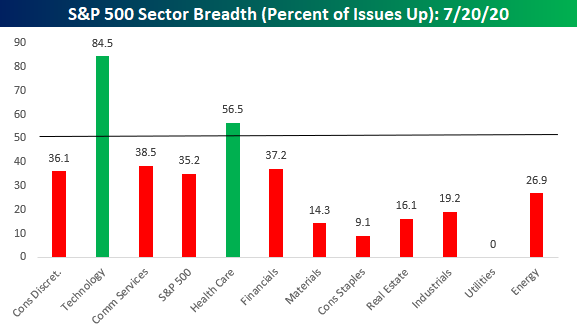
The chart of sector performance doesn’t even tell the entire story. While Consumer Discretionary was up the most yesterday at +3.14%, when Amazon.com (AMZN) comprises more than a quarter of the entire sector, it’s 8% rally can mask a lot of underlying weakness. The chart below shows the percent of stocks in each sector that finished the day in positive territory. As shown, barely a third of Consumer Discretionary stocks were even up yesterday! Technology and Communication Services were the only other sectors that outperformed the S&P 500 yesterday, and while breadth was extremely positive in tech-land, in Communication Services things weren’t much better than they were in the Consumer Discretionary sector. Besides Technology, Health Care was the only other sector that managed to see more than half of its components finish the day in positive territory.
Looking at breadth among sectors can show a bit of a misleading picture as so much market cap is concentrated into just a few sectors, while four other sectors (Energy, Materials, Real Estate, and Utilities) all have weightings of 3% or less in the S&P 500. Broadening out the picture a bit more, the chart below breaks down Monday’s performance by Industry Groups. At this level, breadth was still weak on Monday but not as bad as the picture on the sector level suggests. While five industry groups finished the day up over 1%, there were still seven that finished the day down over 1%. Still a large number, but not quite as extreme as the sector numbers would suggest. Like what you see? Click here to view Bespoke’s premium membership options for our best research available.

B.I.G. Tips – On the Downside of COVID Wave 2?
Bespoke’s Morning Lineup – 7/21/20 – The Haves and the Have Nots
See what’s driving market performance around the world in today’s Morning Lineup. Bespoke’s Morning Lineup is the best way to start your trading day. Read it now by starting a two-week free trial to Bespoke Premium. CLICK HERE to learn more and start your free trial.
Risk assets around the globe are rallying again this morning on news that the European Council has reached an agreement to a budget and COVID recovery package. The key point of the agreement is that EU fiscal policy will be backed by mutual taxation and will be used as a fiscal stabilizer.
Be sure to check out today’s Morning Lineup for a rundown of the latest stock-specific news of note, global economic data, improved trends related to the COVID-19 outbreak, and much more.

By now you’ve heard about how uneven yesterday’s rally in the market was. While the S&P 500 was up nearly 1%, the majority of stocks in the index were actually down on the day. The chart of sector performance for the day sums things up pretty well. Consumer Discretionary (pretty much entirely the result of Amazon) was up over 3%, Technology tacked on over 2.5%, and Communication Services rallied over 1.25%. Every other sector, though, was down on the day. Not only were they down, but they were down sharply. In fact, four sectors were down over 1% even though the S&P 500 rallied 0.84%. Depending on the sectors you’re overweight in, yesterday was either really good or really bad.

Daily Sector Snapshot — 7/20/20
Amazon (AMZN) Ships the S&P Higher
The S&P 500 finished up 0.84% on Monday and the index had mega-cap stocks to thank for its gains as the majority of stocks in the S&P 500 actually finished the day lower. In fact, Amazon (AMZN) was the best performing stock in the S&P 500 having its best day since 12/26/18 rallying just under 8%. That gain alone was responsible for nearly 40 basis points of the S&P’s 84 bps gain. That means Amazon accounted for just under half of the S&P 500’s gains today. That compares to the rest of the trillion-dollar club—Microsoft (MSFT), Apple (AAPL), and Alphabet (GOOG)—which added a collective 45.81 bps to the S&P 500. Again that is an impressive contribution when compared to the other 174 stocks that rose today, which collectively only added 53.13 bps. The remaining stocks dragged on the index by 54.45 bps. The stocks that dragged the index down the most included energy names like Exxon Mobil (XOM) and Chevron (CVX), Medtronic (MDT), Philip Morris (PM), and Coca Cola (KO). In other words, big days for the largest stocks helped to dramatically boost performance masking what was overall mediocre day for most stocks. Click here to view Bespoke’s premium membership options for our best research available.

This Week’s Economic Indicators – 7/20/20
Last week was a strong one for economic data with more than half of releases either beating estimates or improving from the prior period for those with no forecasts. The Treasury’s monthly budget statement was the only release on Monday, and it showed a massive increase to the deficit. Small business optimism tipped back above 100 the following day, also coming in above expectations of 97.8. CPI was the other major release on Tuesday. More inflation data followed up with import and export prices on Wednesday. Both showed further declines in June. The New York Fed’s Manufacturing reading for July exceeded estimates, rising to 17.2 while the neighboring Philly Fed showed a slight decline from 27.5 24.1. June’s Retail Sales report for June showed strong growth in sales across the board with both the headline and core measures beating estimates. Homebuilder sentiment was also strong in a later release that same morning, rising from 58 to 72. Some disappointing housing numbers rounded out the week with misses for both starts and permits.

This week, economic data will take a backseat with a lighter calendar as earnings take center stage. Although there was nothing released today, there are a dozen releases scattered throughout the rest of the week. Included in these releases will be more housing data in the form of new and existing home sales and FHFA home prices, claims, the Kansas City Fed’s activity index, and preliminary Markit PMIs. Click here to view Bespoke’s premium membership options for our best research available.
