B.I.G. Tips – A Little Tiger in CAT’s Sales
Decile Analysis of 6/11 Declines
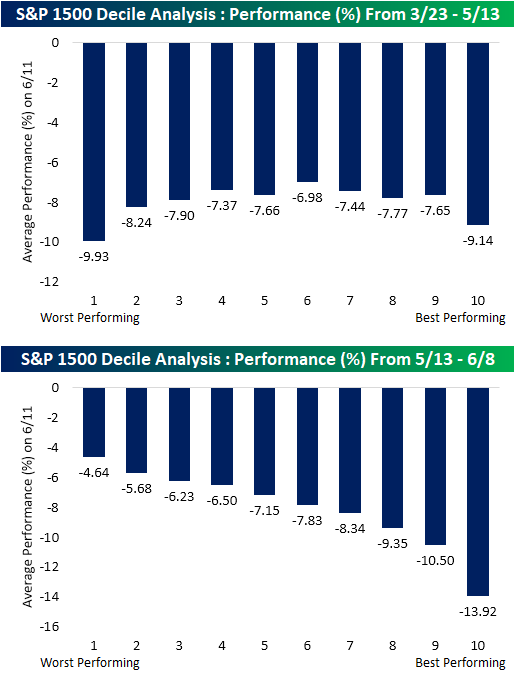
Yesterday was a flat out terrible day for equities. Breadth was extremely weak as the S&P 1500 had its worst day since March 16th falling over 6%. Most of the individual stocks within the index had fallen by even more with 23% down double digits. As shown below, one of the key driving factors of yesterday’s move was performance since the bear market low on March 23rd up through the start of this week. More specifically, the was clear profit-taking of the best-performing stocks of the new bull market. The decile of stocks that had risen the most from the March 23rd low through Monday fell 12.45% on average yesterday. No other decile fell double digits. Meanwhile, the stocks that have lagged on the way up actually outperformed yesterday, though that is not to say they were saved from sharp single-day declines.

As shown in the first chart below, performance in the initial rally off the March lows was not a very clear factor in yesterday’s selling though the best and worst performers in that period did see outsized declines yesterday. Alternatively, more recent performance was a more pronounced factor yesterday. Beginning in mid-May there began to be some rotation into names that had lagged in the first leg of the bull market rally. Over the past several weeks since then, things have reversed and these have been some of the best-performing stocks. As a result, there was major profit-taking of these recent winners yesterday. The best performing decile from 5/13 through the start of this week averaged a decline of 13.92% yesterday while the worst performers only fell 4.64% on average.
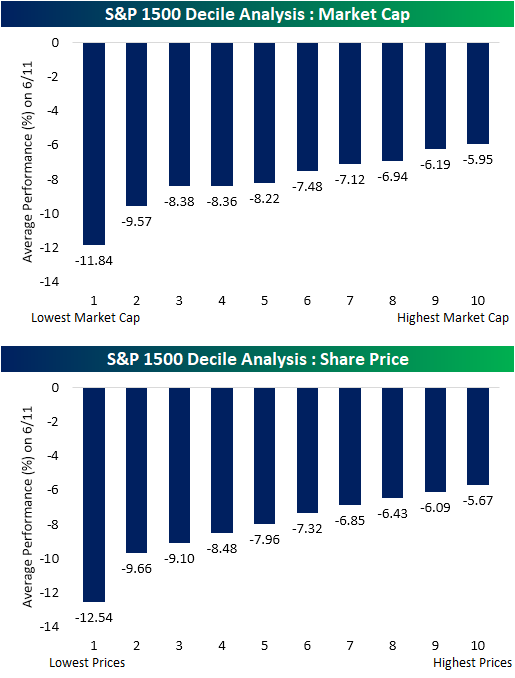
Another trend recently that has received a lot of headline attention has been the retail investor’s roll in the rally, especially in regards to the run-up in some less attractive and more beaten-down names. Given that lower-priced shares are typically seen as easier to stomach to retail investors, that also seemed to play a role yesterday. Both low market cap and low priced shares faced the worst declines yesterday. Alternatively, high priced and high market cap names saw much smaller declines. Click here to view Bespoke’s premium membership options for our best research available.
Bespoke’s Morning Lineup – 6/12/20 – “A” For Effort
See what’s driving market performance around the world in today’s Morning Lineup. Bespoke’s Morning Lineup is the best way to start your trading day. Read it now by starting a two-week free trial to Bespoke Premium. CLICK HERE to learn more and start your free trial.
After a downright horrible day for risk assets on Thursday, bulls are trying to close out the week on a high note with the S&P 500 indicated to open up by nearly 2%. The only economic data of note is Import Prices and Michigan Sentiment. Other than that, it looks like investors will be paying close attention to the latest COVID trends heading into the weekend.
Be sure to check out today’s Morning Lineup for a rundown of the latest stock-specific news of note, moves in overseas markets, an audacious move from Hertz to try and issue more equity to fund its bankruptcy, the latest Industrial Production numbers from the Eurozone, global and national trends related to the COVID-19 outbreak, and much more.

One result of yesterday’s rout in the equity market is that not a single major US index is up over the last five trading days, and every single one of them has moved out of overbought territory. Even the Nasdaq 100, is down fractionally!

Bespoke’s Weekly Sector Snapshot — 6/11/20
B.I.G. Tips – Market Performance After 5%+ Drops
Electric Dominating Global Auto Maker Market Cap
In today’s Chart of the Day, we detailed Tesla’s (TSLA) rise above $1,000 and what other stocks like Google (GOOGL) and Amazon (AMZN) have looked like when they first crossed $1,000. With TSLA reaching these kinds of levels, it also now has a record share of the total market cap of global automobile makers. Including the electric car company with the other 20 companies in the S&P Global 1200 Automobile Index, TSLA accounts for just over 22% of the total market cap. That is the second-largest of any company behind only Toyota whose $210.69 bn (USD-adjusted) accounts for 24.43%. As we have detailed in the past, TSLA’s market cap is now significantly larger than other US automobile producers like Ford (F), General Motors (GM), and Harley Davidson (HOG). In fact, it is now more than double the market caps of those companies combined! The rest of the world’s automobile companies including Japanese names like Honda and German names like BMW and Daimler (Mercedes) account for 69.58% of the total market cap.
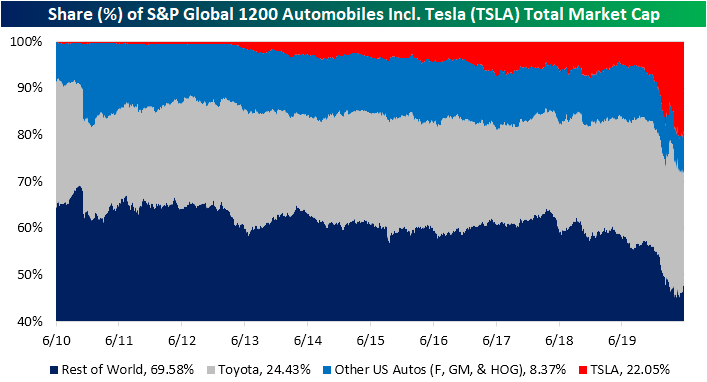
Although TSLA accounts for a massive share of world automaker’s market cap, it still makes up for a very small share of these companies’ total revenues. In fact, its $24.58 bn in sales in 2019 only accounted for 1.29% of all these companies’ total revenues. Albeit it is a high growth name, that leaves it with one of the higher valuations on a P/S and P/B basis. A similar dynamic can be seen for other high-end brands like Italian brand Ferrari and German brand Porsche. The same can be said for another electric vehicle stock that has received a large amount of headline attention recently, Nikola (NKLA). NKLA likewise is another name with a fairly large disparity between its sales and share of market cap. Another high growth name and recent IPO, Nikola actually had no revenues in 2019 but is valued at $23.46 bn or 2.56% of total market cap. That is more than some other major global brands like Hyundai, Suzuki, and Subaru to name a few. Click here to view Bespoke’s premium membership options for our best research available.

Bulls Coming Back in Favor
Although the weekly sentiment survey would not have captured equities’ sharp decline today, bullish sentiment through AAII’s weekly survey was lower by 0.27 percentage points to 34.28% this week despite the S&P 500’s general move higher in the past week. That was the smallest absolute weekly change for bullish sentiment since the final week of June of last year when it had risen by just 0.08 percentage points.

Bearish sentiment likewise was headed lower this week falling by 0.82 percentage points. That left bearish sentiment at 38.05% which is the lowest reading since February 20th.

That means most of the move this week went to neutral sentiment which was up from 26.58% last week to 27.67% this week. After being extremely muted for most of the COVID collapse, it is now at its highest level since the last week of February.

The bull-bear spread rose again this week and is now at -3.77. The spread overall still favors bears as it has for nearly four months now but is the closest to favoring bulls since early March when it stood at -0.9. This week also marked a fifth consecutive week in which the spread has risen. That is one of the longer streaks on record as shown in the second chart below and the longest since July of last year. If that streak continues through next week, it would be tied with three other streaks from 2007, 2014, and 2019 for the second-longest such streak on record.


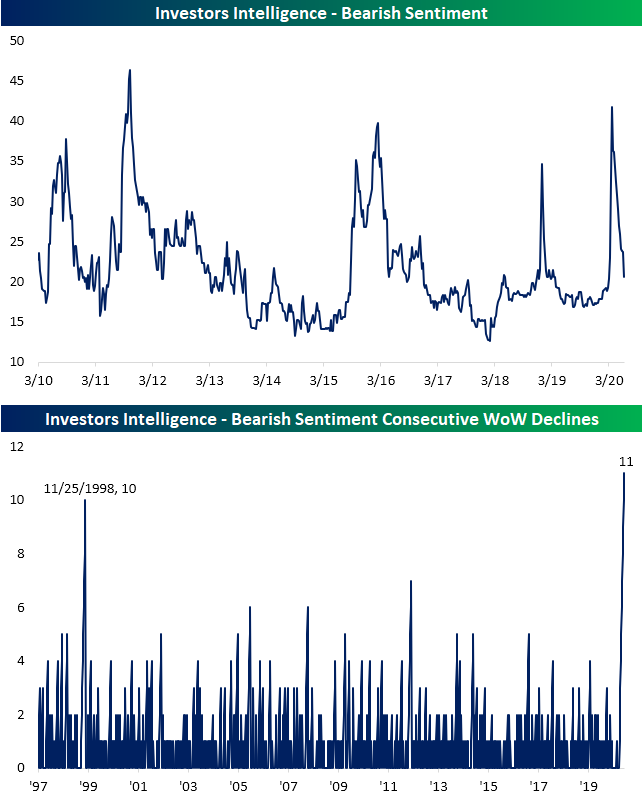
The Investors Intelligence survey is echoing the increasing bullish tones. Both bullish and bearish sentiment in this survey experienced the largest increase and decline, respectively, since the middle of April. Bullish sentiment is now 56.9% which is the highest level since January 22nd and in the 85th percentile of all readings of the past decade. This week was also a fourth consecutive and tenth of the last eleven weeks that bullish sentiment was higher week over week.

Bearish sentiment on the other hand is down to 20.6% which is the lowest level since the beginning of March. Although that only brings it to the middle of the past decade’s range, this week was the eleventh straight week with a WoW decline. As shown in the second chart below, that is the longest streak since at least 1997. Click here to view Bespoke’s premium membership options for our best research available.
B.I.G. Tips – Line Keeps Going Down
Chart of the Day: Telsa (TSLA) Tops $1,000
Claims Finally Beat Estimates
Weekly jobless claims have been a mixed bag over the past several weeks. Though they have been consistently declining to their lowest levels since the start of the pandemic, they still are well over a million and that is excluding other claims like Pandemic Unemployment Assistance (PUA). Additionally, continuing claims remain elevated at over 20 million this week. This week was more of the same for initial jobless claims as they fell to 1.542 million; a tenth consecutive decline WoW which is the longest such streak on record. This week’s 355K decline was the largest WoW decline since 5/8 when they fell 489K. That brings the total number of initial jobless claims filed since the first over 1 million print in late March to over 44 million.

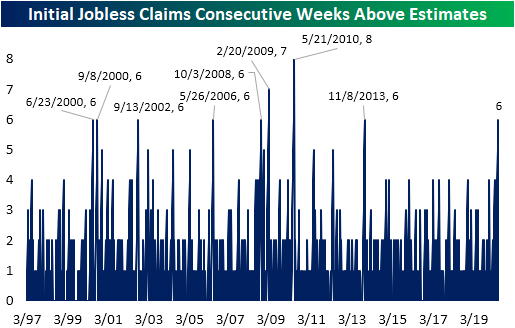
On top of being the lowest reading since late March and one of the larger WoW declines of the past couple of months, another positive of this week’s data was that it beat estimates. That was the first time this has happened in six weeks. As shown below, there have been several other streaks that initial jobless claims missed expectations for at least six straight weeks since the early 1990s. Only two of those streaks, one in 2009 and anther in 2010, came to an end at more than six weeks (seven and eight, respectively). This most recent streak was the first time claims missed that often since 2013.
As for the non-seasonally adjusted number, this week’s decline to 1.54 million was much more muted at only 82.9K. That still leaves claims at their lowest levels since the first print over 1 million and a ninth consecutive week with NSA claims lower. But this was also the smallest improvement for any week since claims began to work off their peak. Click here to view Bespoke’s premium membership options for our best research available.
