Bespoke’s Morning Lineup – 6/23/20 – He Loves Me, He Loves Me Not
See what’s driving market performance around the world in today’s Morning Lineup. Bespoke’s Morning Lineup is the best way to start your trading day. Read it now by starting a two-week free trial to Bespoke Premium. CLICK HERE to learn more and start your free trial.
Trying to read the tea-leaves in the ongoing saga between the US and China has become increasingly difficult these days with last night being a perfect example. Shortly before Asia opened for trading, US futures were moderately higher, but then Trump adviser Peter Navarro dropped a tape-bomb saying the US-China trade deal was ‘over’. That sent Dow futures from up over 200 to down over 400 in a matter of minutes. Navarro later walked back those remarks, and even the President took to Twitter to say the trade deal was ‘fully intact‘. (Twitter hasn’t put any warnings or labels on that tweet, so we’ll assume that it’s accurate info!)
After all the overnight ups and downs, futures are actually higher now than they were before Navarro made his comments, indicating a 1.25% gain at the open.
Be sure to check out today’s Morning Lineup for a rundown of the latest stock-specific news of note, how Navarro’s comments have impacted the market in the past, the latest batch of June PMI data out of Europe, global and national trends related to the COVID-19 outbreak, and much more.

Crude oil prices are back above $41 per barrel for the first time since March 9th when Russia and Saudi Arabia started their price war. What a trip it’s been over the last three and a half months as prices have seen a round trip of around $80 lower and higher during that span.

While crude oil prices have recovered all of their losses since the gap down on March 9th, the S&P 500 Energy sector isn’t quite back to its levels from prior to March 9th and has some catching up to do. At yesterday’s close, the Energy sector was still down over 6.5% from where it closed on Friday, March 6th.

Daily Sector Snapshot — 6/22/20
Chart of the Day: Apple (AAPL) During the Worldwide Developers Conference (WWDC)
Nasdaq, Tech, Growth Keep Going
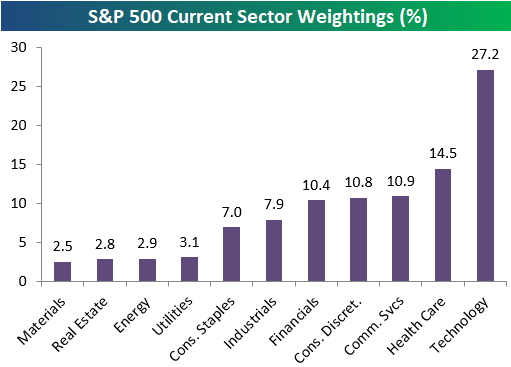
With Technology rallying and once again outperforming to start the new trading week, we wanted to note that the sector’s weighting in the S&P 500 has pushed above 27% recently up to 27.2%. That’s nearly twice as big as the next biggest sector in the S&P — Health Care — at 14.5%. Just three other sectors have weightings above 10%, and they’re all just only slightly above the 10% mark — Communication Services, Consumer Discretionary, and Financials. We’d note that Amazon (AMZN) makes up about a quarter of the Consumer Discretionary sector’s 10.8% weighting in the S&P, and while it is technically a retailer, between its web services division, and strong technology platform, you could argue that its just as much a Technology stock as it is Consumer Discretionary.
Industrials and Consumer Staples have seen their weightings dip below 8%, and the four smallest sectors each have weightings of just 2-3%.
At the moment, Tech’s 27.2% weighting in the S&P is larger than the weightings of the six smallest sectors combined.
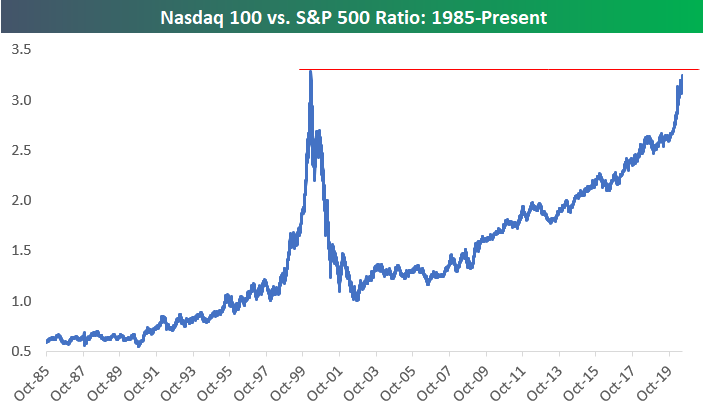
The tech-oriented Nasdaq 100 continues to outperform as well. Below is a chart of the ratio between the index levels of the Nasdaq 100 vs. the S&P 500. The ratio has been on a non-stop march higher since the end of the Dot Com bust in late 2002.
There have only been three trading days in history where the Nasdaq 100 to S&P 500 ratio was higher than the 3.25 level it’s at right now. Those three days came on March 8th, March 9th, and March 10th of the year 2000 — the very peak of the Dot Com Bubble.
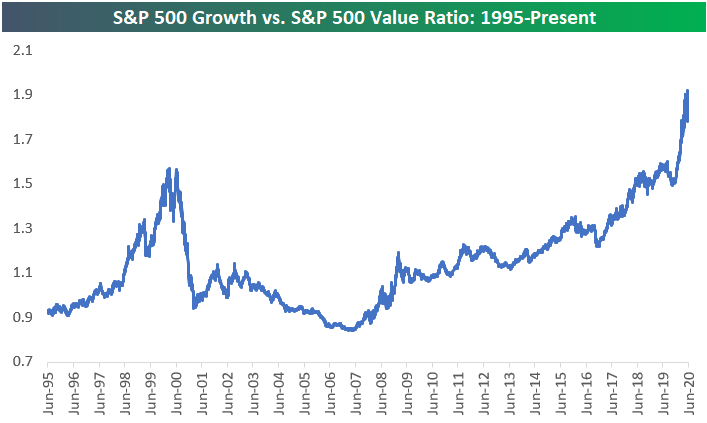
Finally, the Growth vs. Value trade remains lopsided towards growth. Below is a chart of the ratio between the S&P 500 Growth and S&P 500 Value index since 1995. This ratio actually took out its highs from the Dot Com Bubble in mid-2019, and it has exploded even higher over the last year. Value did outperform for a bit in May and early June, but over the last two weeks we’ve seen Growth soar and the ratio has once again made new highs. Click here to view Bespoke’s premium membership options for full access to all of our research.
Metals Coming in Right in Medal Order
Going through the charts of gold, silver, and copper this morning, it’s ironic to see that in terms of both their performance over the last year, and over the longer term, their returns rank in the same order as their medal order in the Olympics. Starting with gold, it has been a strong year for the precious metal with a gain of about 25%. In recent weeks, though, we’ve seen a bit of a sideways pattern. Today, gold is trading up about 1%, and after two prior attempts at a breakout, it is once again testing resistance right below the $1,800 per ounce level.

Even if gold doesn’t break out above recent intraday highs, on a closing basis, it’s pretty much right at its highest levels since October 2012 but still below its closing peak of 1,889.70 back in August 2011.

Silver gets the silver medal with its 17% gain over the last year. Like gold, silver is also dealing with a good amount of resistance over the last year as the high $19/low $19 level has been a barrier to the upside on multiple occasions.

Unlike gold, which is near eight-year highs, silver is well off the extreme highs it saw early in the last decade. Back in 2012, silver was trading above $30 per ounce and traded just shy of $50 back in April 2011. Since 2014, silver has been in a relatively tight range with upside capped at around $20.

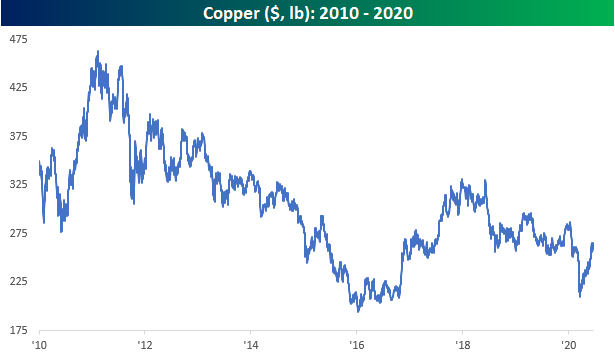
Trailing gold and silver for the bronze medal, copper prices are much further below their highs of the last year. At the current price of $265.2 per pound, copper is down nearly 2% over the last year.

Also, like silver, copper prices were a lot higher earlier in this decade than they are now. Back in 2010, the price per pound was closer to $450 but has been trending lower ever since then. Click here to view Bespoke’s premium membership options for full access to all of our research.
Bespoke’s Morning Lineup – 6/22/20 – Holding Pattern
See what’s driving market performance around the world in today’s Morning Lineup. Bespoke’s Morning Lineup is the best way to start your trading day. Read it now by starting a two-week free trial to Bespoke Premium. CLICK HERE to learn more and start your free trial.
Futures are only indicated slightly lower this morning after trading down significantly more shortly after they opened Sunday night. Investors have shaken off early concerns related to rising COVID case counts, but gold prices are near multi-year highs, and the 10-year yield remains below 0.70%.
Be sure to check out today’s Morning Lineup for a rundown of the latest stock-specific news of note, moves in overseas markets, global and national trends related to the COVID-19 outbreak, and much more.
The S&P 500 is currently on pace for a gain of just under 2% in the month of June which is nothing to sneeze at. However, after a gain of over 12% in April and more than 4% in May, June performance seems relatively meager. That being said, the slowdown in the pace of the rally this month is helping to work off overbought conditions for most sectors. Through Friday’s close, just three sectors (Technology, Communication Services, and Consumer Discretionary) are overbought while the remaining eight sectors finished the week off in neutral territory. Of those eight sectors, the only one below its 50-day moving average is Utilities, which was also down more than any other sector last week (-2.01%). Technology continues to top the leaderboard as it’s up the most of any sector YTD, the most above its 50-DMA, and, behind the Health Care sector, was the second-best performing sector last week.

Bespoke Brunch Reads: 6/21/20
Welcome to Bespoke Brunch Reads — a linkfest of the favorite things we read over the past week. The links are mostly market related, but there are some other interesting subjects covered as well. We hope you enjoy the food for thought as a supplement to the research we provide you during the week.
While you’re here, join Bespoke Premium for 3 months for just $95 with our 2020 Annual Outlook special offer.
Remote Work
When Workers Can Live Anywhere, Many Ask: Why Do I Live Here? by Rachel Feintzeig and Ben Eisen (WSJ)
With COVID work-from-home responses untethering workers from their offices, they’re coming to the realization that they don’t actually need to be where they currently live. [Link; paywall]
Highest Salaries For Software Developer Remote Work (Metro Areas) by Wendell Cox (New Geography)
Adjusted for the cost of living, metros in North Carolina, Texas, Washington, and Colorado stand out as offering the best standard of living per dollar of pay for software developers. [Link]
China
China Is Collecting DNA From Tens of Millions of Men and Boys, Using U.S. Equipment by Sui-Lee Wee (NYT)
Chinese authorities are working to develop a national genetic database that will be used to augment surveillance and control capacity for the state. Massachusetts-based Thermo Fisher is helping in the effort. [Link; soft paywall]
China halts European salmon imports over suspected link to virus outbreak by Nerijus Adomaitis and Kate Kelland (Yahoo!/Reuters)
While salmon itself is unlikely to play host to the coronavirus, China is shutting down imports from northern Europe over concerns it drove an outbreak at a Beijing market. [Link; auto-playing video]
Food
America’s retreat to comfort food during the pandemic isn’t pure nostalgia — it’s a survival tactic by Kate Taylor (Business Insider)
“Junk” food isn’t just being purchased as a feel-good callback to more stable times but is also a strategy to reduce trips to the store and cut costs. [Link]
“One country’s joke is another country’s breakfast”: The story of Spam by Aimee Levitt (The Takeout)
An oral history of the canned meat that fed GIs in World War 2, became a critical lynchpin of a number of national cuisines, and is now being rediscovered as a rich and salty addition to avant-guard cuisine. [Link]
Why Is the McFlurry Machine Down Again? by Julie Jargon (WSJ)
Frustrating cleaning processes, frequent breakdowns, and social media frustration: why you can never get the ice cream cone or McFlurry you crave at McDonald’s. [Link; paywall]
Spending Patterns
Boats, Pools and Home Furnishings: How the Lockdown Transformed Our Spending Habits by Matthew Dalton and Suzanne Kapner (WSJ)
Stimulus payments and unemployment insurance are being pumped into home renovations and upgrades that provide a rare bright spot amidst broader economic decline. [Link; paywall]
The coronavirus pandemic can’t stop Americans from buying pickups by Nathan Bomey (USA Today)
Americans’ love affair with pickups is helping to keep the auto market afloat as the category remains much stronger than the sales of all light autos. [Link]
Parents are dropping $150K on luxury summer camps for their kids by Melkork Licea (New York Post)
Desperate to get their kids out of the house, parents are laying out six figure sums for summer sleepaway camps that will give parents a break from constant childminding. [Link]
COVID & The Elderly
Nobody Knows Exactly How Hard The Coronavirus Is Hitting America’s Assisted Living Facilities by Rosalind Adams and Ken Bensinger (BuzzFeed)
Assisted living facilities around the country have been hit hard by the virus, but New York state’s many care homes have been about as badly hit as it gets. [Link]
“Fire Through Dry Grass”: Andrew Cuomo Saw COVID-19’s Threat to Nursing Homes. Then He Risked Adding to It. by Joaquin Sapien and Joe Sexton (ProPublica)
Policy decisions by Governor Cuomo created a much worse outcome for New York nursing homes than those in other states, with roughly 6% of residents killed by the virus. [Link]
COVID Stories
Coronavirus: Dexamethasone proves first life-saving drug by Michelle Roberts (BBC)
While initial data from studies of dexamethasone is limited, it indicates a substantial positive impact on patients, reducing risk of death by one-third for patients on ventilators. [Link]
Rural Alabama County Fights Virus Outbreak With Just One Doctor by Margaret Newkirk and Danielle Bochove (Bloomberg)
Alabama’s Lowndes County has no hospital and just one doctor, relies on tightly packed mobile homes for housing, and an infection rate similar to New York City during the peak of its pandemic. [Link; soft paywall]
Fauci said US government held off promoting face masks because it knew shortages were so bad that even doctors couldn’t get enough by Mia Jankowicz (Business Insider)
CDC infectious disease head Dr. Anthony Fauci revealed that initial guidance for the public to wear masks was withheld because the government wanted to retain supplies of masks for health care workers, even though homemade masks and non-medical grade masks can still substantially reduce transmission with widespread use. [Link]
Oura
Covid-detecting ‘smart rings’ to be trialled by staff at Las Vegas resort by Patrick McGee (FT)
Casino staff will start using Oura smart rings to detect pre-symptomatic staff members that might be coming down with COVID but are not yet showing visible symptoms. [Link]
Inside the NBA’s plan to use smart technology and big data to keep players safe from coronavirus by Jessica Golden (CNBC)
The NBA will also use the Oura rings to help detect signs of infection among players who are living in Disney World in July as part of the NBA season’s restart. [Link]
Research
US dollar funding: an international perspective (BIS Committee on the Global Financial System)
A detailed review of why the dollar is such a critical piece of the global financial landscape, and how its movements and availability can have complicated effects on markets and economies around the world. [Link; 87 page PDF]
How Did COVID-19 and Stabilization Policies Affect Spending and Employment? A New Real-Time Economic Tracker Based on Private Sector Data by Raj Chetty, John N. Friedman, Nathaniel Hendren, Michael Stepner, and the Opportunity Insights Team (Opportunity Insights)
High frequency data suggests reopenings are not helpful for boosting local employment, while stimulus checks boost lower income household spending. Paycheck Protection Program loans had little effect on employment. The authors conclude that social insurance which protects incomes are more effective than other macroeconomic stabilization tools. [Link; 85 page PDF]
Structuring Federal Aid To States As An Automatic (and Autonomous) Stabilizer by Alex Williams (Employ America)
One social insurance policy option is the introduction of automatic block grants to states that insure lower levels of government against sudden revenue declines during a macroeconomic shock. [Link]
Social Media
TikTok Finally Explains How the ‘For You’ Algorithm Works by Louise Matsakis (Wired)
Algorithmically-driven Tik Tok serves up an endless feed of videos to each user, uniquely tailored to that user. This week the company published a blog post detailing the basics, which are weighted by everything from hashtags to the type of device being used. [Link; soft paywall]
Does Tweeting Improve Citations? One-Year Results From the TSSMN Prospective Randomized Trial by Jessica G Y Luc, Michael A Archer, Rakesh C Arora, Edward M Bender, Arie Blitz, David T Cooke, Tamara Ni Hlci, Biniam Kidane, Maral Ouzounian, Thomas K Varghese Jr, and Mara B Antonoff (PubMed)
Tweeting academic articles leads to a citation rate more than 4 times higher than un-tweeted articles, revealing the critical role Twitter plays in disseminating and highlighting new information. [Link]
Civil Liberties
After Barr Ordered FBI To “Identify Criminal Organizers,” Activists Were Intimidated At Home And At Work by Chris Brooks (The Intercept)
In response to massive protests over recent weeks, the FBI and DoJ more generally have singled out first-time activists for benign organizing activity. [Link]
Music
Top composers used to head to Hollywood. Now they’re into games by Will Bedingfield (Wired)
Hollywood blockbusters used to be a gravy train for composers, but in recent years the expansion of video games as their own category of prestige media have lured composing talent into their arena. [Link; soft paywall]
Investing
Investors Approaching Retirement Face Painful Decisions by Akane Otani (WSJ)
Large numbers of older investors were forced to sell at the worst possible time back in the first quarter as stocks plunged. Please note that this story features a correction at its end. [Link; paywall]
Read Bespoke’s most actionable market research by joining Bespoke Premium today! Get started here.
Have a great weekend!
The Bespoke Report – Case Counts Rising
This week’s Bespoke Report newsletter is now available for members. Below is the opening excerpt.
The areas of the country where Covid case counts are currently rising the most are in Florida, Texas, Arizona, and California. So much for the heat keeping the virus at bay! On a day when Governor Cuomo thankfully ended his daily coronavirus press briefings, the stock market is once again focused on the daily case count numbers in other parts of the country. At least for most of the week, the market managed to shake off increased attention on case numbers. The S&P 500 was up 1.9% this week while the Nasdaq 100 rose 3.5%. Health Care, Materials, Tech, Consumer Staples, and Communication Services all rose more than 2%, while Energy was down 0.6% even though the oil ETF was up 6.8%. Outside of the US, China and India were up the most while Brazil, Spain, and Russia were in the red.
To read the full report and access everything else Bespoke’s research platform has to offer, start a two-week free trial to one of our three membership levels. You won’t be disappointed!

Daily Sector Snapshot — 6/19/20
100 Days
100 days ago today on March 11th, the WHO made it official and declared the COVID-19 outbreak a pandemic. Markets were already under a lot of pressure before the WHO declared the pandemic, but the 100 days since will probably go down as some of the craziest 100 days we’ll ever experience, not only in the market but in general society as well. More than enough ink and pixels have been spent discussing the societal impact at large, so we’ll spare you and just focus on the markets.
While much of the declines were already in the rearview mirror by the time the WHO made its announcement, equities still had a steep decline in the immediate aftermath. The large-cap Russell 1000, for example, fell another 19% to its March 23rd closing low, but after the rebound, the net change since the pandemic was officially declared has been a gain of 14.3%.

As impressive as the Russell 1000’s gain has been in the face of the global pandemic, many stocks have done a lot better than that. The table below lists the 25 stocks in the index that have seen the biggest gains so far during this pandemic. Topping the list is Wayfair (W) which has rallied more than 350%. If there is one thing Americans must have realized while they were stuck at home under lockdown it was that they needed some new furniture! Behind Wayfair, two other stocks have more than tripled and both were beaten down stocks from the Energy sector that were trading at less than $2 per share on March 11th. A number of familiar names standout including Moderna (MRNA), Twilio (TWLO), DocuSign (DOCU), Beyond Meat (BYND), and Etsy (ETSY), but looking through the list, there’s really a diverse group of names ranging from bombed-out stocks from the Energy sector (8 stocks), Consumer names (7 stocks), and the ever-popular software stocks from the Technology sector (6 stocks). It’s definitely been a rocky road for the markets over the last 100 days, but for anyone who had these names in their portfolio, they aren’t complaining. Click here to view Bespoke’s premium membership options for access to our weekly Bespoke Report which includes an update to our Stocks for the COVID economy portfolio that was released on March 11th.
