The Bespoke Report — Can’t Escape COVID
This week’s Bespoke Report newsletter is now available for members.
It was another bout of Friday selling which took stocks to new two week lows this week, led lower by banks in the wake of Federal Reserve stress tests that limited buybacks and dividends. In the background, surging case counts across the US Sunbelt are driving market concern over how the virus can be contained along with the impact on the economy. We take a look at the outlook for the economy and markets in depth, as well as reviewing the US political and policy outlook in this week’s Bespoke Report.
To read the report and access everything else Bespoke’s research platform has to offer, start a two-week free trial to one of our three membership levels. You won’t be disappointed!

Daily Sector Snapshot — 6/24/20
Share Price Performance
The US equity market made its most recent peak on June 8th. From the March 23rd low through June 8th, the average stock in the large-cap Russell 1,000 was up more than 65%! Since June 8th, the average stock in the index is down more than 11%. Below we have broken the index into deciles (10 groups of 100 stocks each) based on simple share price as of June 8th. Decile 1 (marked “Highest” in the chart) contains the 10% of stocks with the highest share prices. Decile 10 (marked “Lowest” in the chart) contains the 10% of stocks with the lowest share prices. As shown, the highest priced decile of stocks are down an average of just 4.8% since June 8th, while the lowest priced decile of stocks are down an average of 21.5%. It’s pretty remarkable how performance gets weaker and weaker the lower the share price gets. Like what you see? Click here to view Bespoke’s premium membership options for our best research available.

Stocks for the COVID Economy
Russell 1,000 Decile Performance Since the 6/8 High
Nasdaq – Russell Spread Pulling the Rubber Band Tight
The Nasdaq has been outperforming every other US-based equity index over the last year, and nowhere has the disparity been wider than with small caps. The chart below compares the performance of the Nasdaq and Russell 2000 over the last 12 months. While the performance disparity is wide now, through last summer, the two indices were tracking each other nearly step for step. Then last fall, the Nasdaq started to steadily pull ahead before really separating itself in the bounce off the March lows. Just to illustrate how wide the gap between the two indices has become, over the last six months, the Nasdaq is up 11.9% compared to a decline of 15.8% for the Russell 2000. That’s wide!

In order to put the recent performance disparity between the two indices into perspective, the chart below shows the rolling six-month performance spread between the two indices going back to 1980. With a current spread of 27.7 percentage points, the gap between the two indices hasn’t been this wide since the days of the dot-com boom. Back in February 2000, the spread between the two indices widened out to more than 50 percentage points. Not only was that period extreme, but ten months before that extreme reading, the spread also widened out to more than 51 percentage points. The current spread is wide, but with two separate periods in 1999 and 2000 where the performance gap between the two indices was nearly double the current level, that was a period where the Nasdaq REALLY outperformed small caps.

To illustrate the magnitude of the Nasdaq’s outperformance over the Russell 2000 from late 1998 through early 2000, the chart below shows the performance of the two indices beginning in October 1998. From that point right on through March of 2000 when the Nasdaq peaked, the Nasdaq rallied more than 200% compared to the Russell 2000 which was up a relatively meager 64%. In any other environment, a 64% gain in less than a year and a half would be excellent, but when it was under the shadow of the surging Nasdaq, it seemed like a pittance. Like what you see? Click here to view Bespoke’s premium membership options for our best research available.

Bespoke’s Morning Lineup – 6/26/20 – Drifting Lower
See what’s driving market performance around the world in today’s Morning Lineup. Bespoke’s Morning Lineup is the best way to start your trading day. Read it now by starting a two-week free trial to Bespoke Premium. CLICK HERE to learn more and start your free trial.
After trading near the flat-line just a short time ago, futures have been drifting lower, but even after these declines, the S&P 500 is only poised to erase less than half of its last hour gain in yesterday’s session. Financials are leading the weakness following the release of last night’s stress test results. Looking ahead to today, the only economic data of note is Personal Income (less bad than expected) and Spending (lower than expected) as well as Michigan Sentiment. While it’s not economic data, per se, daily updates from states on the status of COVID are also likely to move markets heading into the weekend.
Be sure to check out today’s Morning Lineup for a rundown of the latest stock-specific news of note, a discussion of last night’s stress test results, European markets and data, global and national trends related to the COVID-19 outbreak, and much more.

Outside of the Nasdaq 100, every one of the index ETFs in our Trend Analyzer are down YTD with small caps leading the way. While the Nasdaq 100 is up over 15%, the Russell 2000 is down by almost that amount. When it comes to US indices this year, it’s definitely been a tale of two cities.

The Russell 2000 has been a laggard on the year, but it has formed a nice and steady uptrend off the March lows. At the moment, though, it’s testing that level after just testing it two weeks ago. While there have been plenty of tests of that uptrend line over the last three months, every other time we have retested this trend line it came after the Russell made a higher high. This time, though, the test is coming from a lower high. Definitely keep this chart on your radar as the lower high could be signaling a loss of momentum.

The Bespoke 50 Top Growth Stocks — 6/25/20
Every Thursday, Bespoke publishes its “Bespoke 50” list of top growth stocks in the Russell 3,000. Our “Bespoke 50” portfolio is made up of the 50 stocks that fit a proprietary growth screen that we created a number of years ago. Since inception in early 2012, the “Bespoke 50” has beaten the S&P 500 by 134.9 percentage points. Through today, the “Bespoke 50” is up 255.9% since inception versus the S&P 500’s gain of 121.0%. Always remember, though, that past performance is no guarantee of future returns. To view our “Bespoke 50” list of top growth stocks, please start a two-week free trial to either Bespoke Premium or Bespoke Institutional.

Bespoke’s Weekly Sector Snapshot — 6/25/20
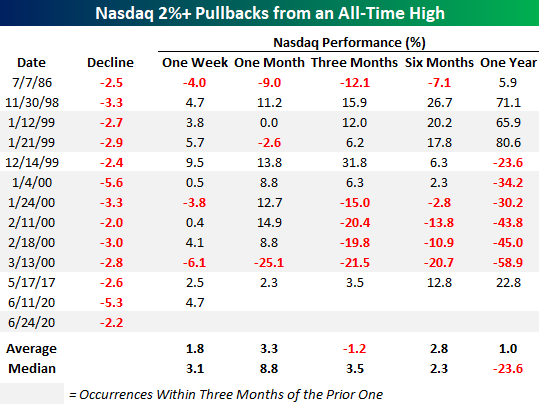
Nasdaq 2% Pullbacks From Record Highs
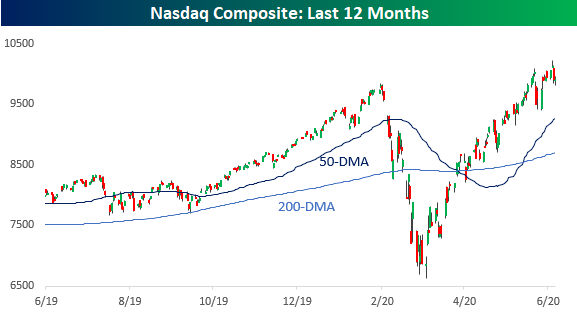
It’s hard to believe that sentiment can change so fast in the market that one day investors and traders are bidding up stocks to record highs, but then the next day sell them so much that it takes the market down over 2%. That’s exactly what happened not only in the last two days but also two weeks ago. While the 5% pullback from a record high back on June 10th took the Nasdaq back below its February high, this time around, the Nasdaq has been able to hold above those February highs.
In the entire history of the Nasdaq, there have only been 12 periods prior to this week where the Nasdaq closed at an all-time high on one day but dropped more than 2% the next day. Those occurrences are highlighted in the table below along with the index’s performance over the following week, month, three months, six months, and one year. We have also highlighted each occurrence that followed a prior one by less than three months in gray. What immediately stands out in the table is how much gray shading there is. In other words, these types of events tend to happen in bunches, and if you count the original occurrence in each of the bunches, the only two occurrences that didn’t come within three months of another occurrence (either before or after) were July 1986 and May 2017.
In terms of market performance following prior occurrences, the Nasdaq’s average and median returns were generally below average, but there is a pretty big caveat. While the average one-year performance was a gain of 1.0% and a decline of 23.6% on a median basis, the six occurrences that came between December 1999 and March 2000 all essentially cover the same period (which was very bad) and skew the results. Likewise, the three occurrences in the two-month stretch from late November 1998 through January 1999 where the Nasdaq saw strong gains also involves a degree of double-counting. As a result of these performances at either end of the extreme, it’s hard to draw any trends from the prior occurrences except to say that they are typically followed by big moves in either direction. The only time the Nasdaq wasn’t either 20% higher or lower one year later was in 1986. Like What you see? Click here to view Bespoke’s premium membership options for our best research available.