Bespoke’s Morning Lineup – 7/13/20 – Earnings Season Starts With a PEP
See what’s driving market performance around the world in today’s Morning Lineup. Bespoke’s Morning Lineup is the best way to start your trading day. Read it now by starting a two-week free trial to Bespoke Premium. CLICK HERE to learn more and start your free trial.
It’s a new week, but more of the same in the early going as the usual suspects are all trading higher. Leading the charge is Tesla (TSLA), which is trading up over 6% which in today’s share price works out to a gain of about $100. The pace of reports is slow today, but earnings season kicked off this morning with Pepsi (PEP) reporting better than expected EPS and rallying more than 2%. Outside of PEP, though, there are no other reports on the calendar for today.
Be sure to check out today’s Morning Lineup for a rundown of the latest stock-specific news of note, global and national trends related to the COVID-19 outbreak, and much more.

As mentioned above, earnings season started off slowly today with Pepsi (PEP). Tuesday, though, we’ll get reports from Citigroup (C), Delta (DAL), Fastenal (FAST), JP Morgan Chase (JPM) and Wells Fargo (WFC), all of whom are scheduled to report in the morning. Wednesday’s major reports include Goldman (GS), Progressive (PGR), and UnitedHealth (UNH) in the morning, while Alcoa (AA) will report in the afternoon. Thursday will be the busiest day of the week with too many stocks to list here, but Netflix (NFLX) will highlight the schedule of afternoon reports. Finally, Friday’s key reports include Blackrock (BLK) and State Street (STT).
For a more detailed rundown of the earnings schedule for the upcoming season, please see our Earnings Explorer Tool (available to all Institutional clients) on the Tools section of our website. The chart below is from that tool and shows the daily number of companies reporting. While large caps dominate the list of companies reporting next week, the volume of reports will not pick up until later July when the pace of reports from smaller and mid-cap companies picks up and more than 400 companies will report in a single day.

Bespoke Brunch Reads: 7/12/20
Welcome to Bespoke Brunch Reads — a linkfest of the favorite things we read over the past week. The links are mostly market related, but there are some other interesting subjects covered as well. We hope you enjoy the food for thought as a supplement to the research we provide you during the week.
While you’re here, join Bespoke Premium for 3 months for just $95 with our 2020 Annual Outlook special offer.
COVID
US bets on untested company to deliver COVID-19 vaccine by Martha Mendoza and Juliet Linderman (AP)
In an effort to secure the material for rapid distribution of COVID vaccine doses, the government has invested more than half a billion dollars in a company that doesn’t have an approved device, doesn’t have a manufacturing facility, and is largely unproven. [Link]
Cause of Wuhan’s mysterious pneumonia cases still unknown, Chinese officials say by Helen Branswell (Stat News)
This article is a throwback to the very start of the COVID-19 outbreak Hubei, when a mysterious outbreak of pneumonia led to almost 60 hospitalizations by the first week of January. [Link]
Costs of COVID
The Toll That Isolation Takes on Kids During the Coronavirus Era by Andrea Patterson (WSJ)
While everyone feels the effects of isolation, they can have an especially extreme effect on children, adding concerns about childhood development to the public health calculation COVID is forcing governments to make. [Link; paywall]
Fearful and Frugal: Coronavirus Wreaks Havoc on America’s Psyche by Tiffany Kary (Bloomberg)
Survey data is suggesting a huge psychic toll on Americans as a result of the virus and the resulting economic impact. Austerity in the form of stockpiling, delayed purchases of durable goods, and less interest in public spaces are all warning signs for the viability of the economic recovery more generally. [Link; soft paywall]
Covid-19 Is Turning San Francisco’s Inequality Gap Into a Chasm by Olivia Rockeman and Gerrit De Vynck (Bloomberg)
COVID is hitting the more vulnerable workers in the service economy in a way that hasn’t had any salience for office workers in tech and other industries. [Link; soft paywall]
Carsyn Leigh Davis (Florida COVID Victims)
The horrifying story of an immunocomprised Florida teen who was exposed to COVID at a large youth event at her church. Her mother tried to treat her for the disease with totally ineffective anti-bacterials and hydroxychloroquine. Carsyn succumbed to the disease 12 days after the event at which she was exposed. [Link]
New York City
I’ve Seen a Future Without Cars, and It’s Amazing by Farhad Manjoo (NYT)
An argument and imagination of what a major city without cars looks like: less crowded, more vibrant, and faster-moving. [Link; soft paywall]
NYC Rental Market Pushed to Breaking Point by Tenant Debts by Prashant Gopal (Bloomberg)
With mass job loss in the hospitality industry, New York renters are completely incapable of covering their rent, and the result is a total inability for landlords to cover the cost of their debts, let alone property taxes and similar costs. [Link; soft paywall]
Heavier Reading
How to Fight Without Rules: On Civilized Violence in “De-Civilized” Spaces by Neil Gong (Social Problems)
This sociology paper is a bit off the wall, but is absolutely fascinating. The author sought to understand how “de-civilized” spaces without rules established new ways of ordering themselves. To do so, he participated in a no-holds-barred underground fight club that included weapons like sticks, chains, and dull knives as well as group battles. [Link; 18 page PDF]
The Dēmos In Dēmokratia by Daniela Cammack (The Classical Quarterly)
A novel reading of classical Greek sources which challenges our notion of democracy: not rule by all the people, but rule by the mass of people outside of the elite. The implications of that early political arrangement and our modern systems of representative government mediated by technocrats are profound: democracy in its original Greek forms was not a process of empowering elites (as it is today, via election of representatives) but was in fact a process of empowering everyone else over elites. [Link; 20 page PDF]
A tale of two wage subsidies: The American and Australian fiscal responses to COVID-19 by Steven Hamilton (National Tax Journal)
A comparative analysis of the different approaches to subsidizing wages taken by the US and Australia, arguing that a lack of infrastructure in the US led to a far less effective Paycheck Protection Program) that underperformed the Australian solution which relied on its tax payment systems instead of private lenders. [Link; 20 page PDF]
Eras Ending
Brooks Brothers files for bankruptcy by Jordan Valinsky (CNN)
The venerable American menswear brand survived the Civil War, two World Wars, and everything else since 1818, but COVID has ended its run. [Link]
Grim Day for Pipelines Shows They’re Almost Impossible to Build by Rachel Adams-Heard and Ellen M. Gilmer (Bloomberg)
Earlier this week a federal judge ordered the shutdown of the Dakota Access pipeline, followed by the cancellation of a planned pipeline by Dominion and Duke Energy. Well-funded and litigious environmental groups have proven incredibly effective at raising the costs of new pipeline projects beyond the point of viability. [Link; soft paywall]
Long Reads
The Hero of Goodall Park: Inside a true-crime drama 50 years in the making by Tom Junod (ESPN)
An incredible yarn focused on cars, baseball, the ephemerality of life, and history in a giant interconnected narrative. [Link; auto-playing video]
Markets
75 Years of American Finance: A Graphic Presentation 1861-1935 (St. Louis Fed FRASER)
A hand-drawn and annotated history of American financial markets and economic activity stretching from the start of the Civil War to the depths of the Great Depression. [Link]
Are Stock Investors ‘Irrationally Exuberant’ Again? by Mark Hulbert (WSJ)
An argument that basically unremarkable performance for IPOs, normal equity issuance, valuations of dividend-paying stocks versus those without a dividend, and closed-end fund discounts are all pointing to an unremarkable market relative to the late-1990s tech bubble. [Link; paywall]
Read Bespoke’s most actionable market research by joining Bespoke Premium today! Get started here.
Have a great weekend!
The Bespoke Report — A Rally with Three Acts
This week’s Bespoke Report newsletter is now available for members.
The S&P 500 was up 3% on the week, while the Nasdaq 100 was up 6.6% (leaving it up 24.6% YTD). Chinese stocks also had a big week with a gain of 15.9%. Within the US, we continue to see huge performance divergence between the largest and smallest stocks. Within the large-cap S&P 500, the cap-weighted index was up 3% on the week, but the equal-weight index was up just 0.3%. YTD, the cap-weighted S&P is down just 0.28%, but the equal-weight index is still down more than 10%.
Here is a stat for you that highlights strength at the top: the five largest stocks in the S&P added $352 billion in market cap this week alone. That would rank as the 10th largest stock in the index. At the bottom of the index, if the 100 smallest stocks in the S&P 500 each doubled from here, it would only add 2.5% to the index. If only Apple (AAPL) were to double from here, it would add 6% to the index.
To read our full Bespoke Report and access everything else Bespoke’s research platform has to offer, start a two-week free trial to one of our three membership levels. You won’t be disappointed!

Daily Sector Snapshot — 7/10/20
Earnings Season Lurks
After a relatively quiet week for economic data and practically no earnings reports to speak of, the Q2 earnings season will kick off next week. Normally, earnings season starts quietly with just a handful of reports outside of the major banks, but next week will be relatively busy with some major players on the calendar. Things start off slowly with Pepsi (PEP) on Monday. Tuesday, we’ll get reports from Citigroup (C), Delta (DAL), Fastenal (FAST), JP Morgan Chase (JPM) and Wells Fargo (WFC), all of whom are scheduled to report in the morning. Wednesday’s major reports include Goldman (GS), Progressive (PGR), and UnitedHealth (UNH) in the morning, while Alcoa (AA) will report in the afternoon. Thursday will be the busiest day of the week with too many stocks to list here, but Netflix (NFLX) will highlight the schedule of afternoon reports. Finally, Friday’s key reports include Blackrock (BLK) and State Street (STT).
As far as analyst sentiment stands heading into the current earnings season, while we wouldn’t go so far as to say that it has made a full 180-degree turn from last quarter’s negative extremes, it has been close. Over the last four weeks, analysts have raised forecasts for 580 companies in the S&P 1500 and lowered forecasts for 419. That works out to a net of 161 or just under 11% of the index. Besides the S&P 1500, six sectors have positive revisions spreads, while just two are negative. Sectors with the most positive revisions spreads include Consumer Staples, Energy, and Technology, while the two sectors with negative spreads are Financials and Real Estate. Financials just can’t find any love these days.
What does this mean for the equity market’s prospects as earnings season begins? Make sure to check our quarterly preview of the upcoming earnings season for a read on what to expect.
Our quarterly preview of earnings season is extremely useful and a must-read. To see the report, sign up for a monthly Bespoke Premium membership now!

Bespoke’s Morning Lineup – 7/10/20 – Socially Distant Stocks
See what’s driving market performance around the world in today’s Morning Lineup. Bespoke’s Morning Lineup is the best way to start your trading day. Read it now by starting a two-week free trial to Bespoke Premium. CLICK HERE to learn more and start your free trial.
It’s going to be a dismal day on Wall Street both literally and figuratively as “Tropical Storm” Fay moves up the east coast, and futures are firmly lower. Earnings news continues to be slow, but that will pick up next week as the big banks start to report. In terms of economic data, PPI is the only release on the calendar, and that came in weaker than expected on both a headline and core basis. That leaves us with the latest state by state COVID updates to contend with heading into the weekend.
Be sure to check out today’s Morning Lineup for a rundown of the latest stock-specific news of note, an update on the Federal Reserve’s balance sheet, credit growth in China, global and national trends related to the COVID-19 outbreak, and much more.
Every weekend it seems we see pictures from all over the country of people failing to follow guidelines on social distancing. While a lot of Americans seem unable to keep a modest distance between each other when they’re out and about, it hasn’t been a problem for equities. In yesterday’s trading, the cap-weighted S&P 500 fell 0.56%, while the equal-weighted index performed much worse, falling more than 1.60%. That’s a pretty wide gap!
We’ve seen a number of days this year where the performance gap between the two indices was as wide as yesterday, and on some days it’s been the equal-weighted index outperforming the cap-weighted index while on other days the performance gap has been flipped around. For the entire year, though, it’s been the cap-weighted index outperforming the equal-weighted index as investors continue to gravitate towards the mega-cap stocks like Apple, Microsoft, Amazon, Alphabet, etc. This has subsequently pushed the performance disparity between the two indices towards extreme levels.
To illustrate, the scatter chart below shows the YTD performance between the S&P 500 equal-weighted index (horizontal axis) and the cap-weighted index (vertical axis) through 7/9 for every year since 1991. Normally, there is a pretty positive correlation between the two indices as the dots tend to hug the trend line. In the case of 2020 (red dot), though, we’ve seen a pretty major disparity as the dot is nowhere near the trendline (Equalweighted index down 13.04% YTD compared to a YTD decline of 2.44% in the cap-weighted index).

Another illustration of the performance disparity between the two indices can be seen in the YTD performance spread between the two indices. The chart below shows the spread between the YTD performance of both indices by year since 1991. When the bars are positive it indicates that the cap-weighted index is outperforming the equal-weighted index and vice versa for negative readings. At a current spread of over ten percentage points, there has never been another year where one of the indices was outperforming the other by a wider margin.

Bespoke’s Weekly Sector Snapshot — 7/9/20
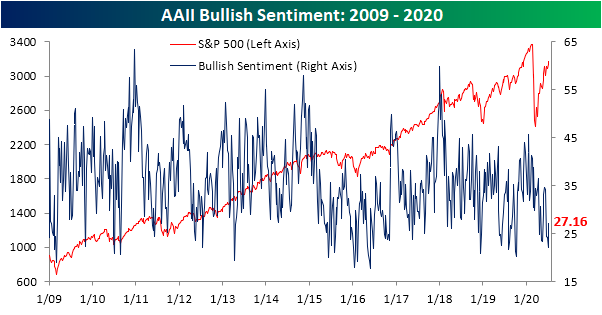
Bullish Sentiment Stops Sliding
While the past week’s gains are mostly being erased today, for the most part, the S&P 500 has been trading firmly higher which has lifted sentiment. AAII’s weekly reading on bullish sentiment was lifted as a result, rising from 22.15% to 27.16%. That is the highest level of bullish sentiment since June 11th, and the 5 percentage point week over week increase was the biggest jump since the end of May. Not only was it the largest single-week increase in over a month, but this week snapped a four-week long streak in which bullish sentiment has declined. With the streak now over, it was the longest streak of consecutive declines in bullish sentiment since April of 2018 when sentiment also fell for four weeks. While higher this week, bullish sentiment is still below its historical average of 38% by at least one standard deviation as it has been for four straight weeks now. That is the first such streak since August of last year.
Meanwhile, bearish sentiment has come back down reaching 42.67%. Mirroring bullish sentiment, that is the lowest reading for bearish sentiment since June 11th, but it remains above its historical average by at least one standard deviation as has been the case for the past four weeks.

Bearish sentiment was not the only one to fall this week. Neutral sentiment also slightly pulled back falling to 30.17% from 31.96%. Although lower this week, neutral sentiment is still at a much more normal reading than the past few months’ extreme lows. In fact, this week marked the first time that neutral sentiment was above 30% for back to back weeks since February. Click here to view Bespoke’s premium membership options for our best research available.

Chart of the Day: Off the Shelf Indicators – Google Search Trends Update
Internationals Benefit From Dollar’s Drop
During the market turmoil in February and March, the US dollar dropped 4.81% from its high on February 20th to its low on March 9th. That was followed up with a massive run up of 8.26% over the next ten days as the dollar index rose to its highest levels since the final days of 2016/first days of 2017. Since peaking on March 19th, however, the dollar has faced constant selling as it now sits at the lower end of the past couple of year’s range. A weaker dollar, all else equal, would make the price point of US products more attractive to foreign buyers and as a result, should theoretically bode well for companies that base a larger share of their revenues from outside the US.
In the chart below, we show the average performance of Russell 1000 stocks since the dollar’s high on March 19th based on deciles of international revenue exposure using data from our International Revenue Database. The 1st decile represents the stocks that have the highest share of total revenues derived from abroad while the 10th decile includes all stocks who’s revenues entirely come from within US borders. As shown, those with the most international exposure—which includes many semiconductors and some travel-related and Consumer Staples names— have generally outperformed most other deciles in that time. Granted, this was not the strongest decile. The 8th and 9th deciles were the strongest performers since March. These deciles are generally stocks with less than a fifth of revenues coming from abroad, and they actually saw even stronger returns on average since March 19th. Meanwhile, those with no international exposure are only up 34.5% on average since March 19th. Click here to view Bespoke’s premium membership options for our best research available.
