Chart of the Day: Surges to Record Highs
Bespoke’s Morning Lineup – 11/9/20 – Happy Days on the Horizon?
See what’s driving market performance around the world in today’s Morning Lineup. Bespoke’s Morning Lineup is the best way to start your trading day. Read it now by starting a two-week free trial to Bespoke Premium. CLICK HERE to learn more and start your free trial.
“The fear, not the disease, threatened to break the society apart.” – John M. Barry, The Great Influenza: The Story of the Deadliest Pandemic in History
Futures were already looking to continue their big rally from last week earlier this morning, but the news that Pfizer’s COVID vaccine showed 90%+ effectiveness against infection has the S&P 500 indicated to open up over 4%! Not everything is rallying on the news, though. While the Nasdaq is also indicated to open up on the day, the biggest beneficiaries of the COVID economy are being sold en masse as investors rotate into the re-opening trades. Just as fear of the pandemic sank markets back in March, hopes for a vaccine are having the reverse effect.
Be sure to check out today’s Morning Lineup for a rundown of the latest stock-specific news of note, discussion of vaccine news, trends related to the COVID-19 outbreak, and much more.

What a wild morning for the market. There’s still a lot of time left in the day, but the S&P 500 is up over 4% in the pre-market while the Nasdaq is barely higher. If this performance gap continues throughout the trading day, it will be the widest margin of outperformance for the S&P 500 relative to the Nasdaq in nearly 20 years (1/2/01). Going back to 1990, there have only been nine other days where the S&P 500 outperformed the Nasdaq in a single day, and they all occurred between March 2000 and January 2001.

The Bespoke Report — Election Week 2020
Daily Sector Snapshot — 11/6/20
Bespoke Consumer Pulse Report — November 2020
Bespoke’s Consumer Pulse Report is an analysis of a huge consumer survey that we run each month. Our goal with this survey is to track trends across the economic and financial landscape in the US. Using the results from our proprietary monthly survey, we dissect and analyze all of the data and publish the Consumer Pulse Report, which we sell access to on a subscription basis. Sign up for a 30-day free trial to our Bespoke Consumer Pulse subscription service. With a trial, you’ll get coverage of consumer electronics, social media, streaming media, retail, autos, and much more. The report also has numerous proprietary US economic data points that are extremely timely and useful for investors.
We’ve just released our most recent monthly report to Pulse subscribers, and it’s definitely worth the read if you’re curious about the health of the consumer in the current market environment. Start a 30-day free trial for a full breakdown of all of our proprietary Pulse economic indicators.

Bespoke’s Morning Lineup – 11/6/20 – Time For a Break
See what’s driving market performance around the world in today’s Morning Lineup. Bespoke’s Morning Lineup is the best way to start your trading day. Read it now by starting a two-week free trial to Bespoke Premium. CLICK HERE to learn more and start your free trial.
“Happiness does not come from a job. It comes from knowing what you truly value, and behaving in a way that’s consistent with those beliefs.” ― Mike Rowe
There wasn’t much dirty about today’s jobs report. Non Farm, Private, and Manufacturing payrolls all topped expectations while the unemployment rate fell to 6.9% compared to forecasts for a level of 7.6%, Even the underemployment rate was less than expected at 12.1% compared to forecasts that were closer to 13%. All in all, a very good report relative to expectations, and that has been reflected in the futures market where rates are higher and equities are rebounding.
Be sure to check out today’s Morning Lineup for a rundown of the latest stock-specific news of note, election analysis, trends related to the COVID-19 outbreak, and much more.
You would think that after the week we’ve had in the market that the market and every sector would be trading at overbought levels, but as shown from page two of our Morning Lineup below, that isn’t quite the case. Three S&P 500 sectors currently remain in neutral territory, while Energy is closer to oversold than overbought! Also surprising is the fact that Technology is still one of the three sectors that aren’t overbought. Normally, after a rally like we’ve seen in the last week, Technology would be leading the charge, but that hasn’t quite been the case this week.

Gold in All Forms Glitters
What a day for gold today – both physically and in its ‘digital’ form. Gold prices are trading up 3% today as just about every asset class is up in price as the value of the dollar declines. After pulling back more than 11% from its August highs, the price of gold has broken its downtrend from that high.

Bitcoin is often referred to as ‘gold’ in a digital form, and it was certainly in rally mode today. With a one-day gain of over 7%, bitcoin is back above $15,000. Today’s move is actually only the largest upside move since 10/21, but it would be the first close above $15,000 since January 2018 and only the 18th time in the digital currency’s history that it closed above that level. Up until recently. there was an uptrend line where bitcoin rallies would run out of steam, but in the last two days, it has found some added fuel to push higher.

One bitcoin will currently buy a holder 7.7 ounces of gold which is the highest ratio since August 2019. The last time bitcoin was at 15,000, though, gold was much cheaper as a bitcoin would buy you more than 12 ounces of gold. Additionally, back in June 2019, the ratio between the two was just under 9. From the peak in late 2017, the ratio of bitcoin to gold made a series of lower highs, but back in July it finally broke above that downtrend range and has been off to the races ever since. Three years ago, the bitcoin mania that would grip markets in the last few weeks of 2017 was just starting to take off and conversations at Thanksgiving tables all over the country included a cousin, aunt, uncle, or even grandmother who was either bragging about getting rich or knew a person who was getting rich buying crypto. With bitcoin prices surging again this year heading into the holiday, we could be in for a repeat of those conversations again this year only instead of around the dinner table, it sounds like many of these conversations will be taking place over Zoom. Click here to view Bespoke’s premium membership options for our best research available.

Bespoke’s Weekly Sector Snapshot — 11/5/20
One Sentiment Survey Soars While Another Sinks
In an earlier post, we discussed how bullish sentiment in the AAII survey has been on the rise, but looking at another weekly sentiment survey from Investors Intelligence, the opposite is true. The percentage of respondents reporting as bullish fell sharply this week, 7 percentage points, down to 53.6%. While a majority are still optimistic and that reading is in the middle of its range, that was the largest weekly decline since a 7.4 percentage point decline to 41.7% in the first week of March.
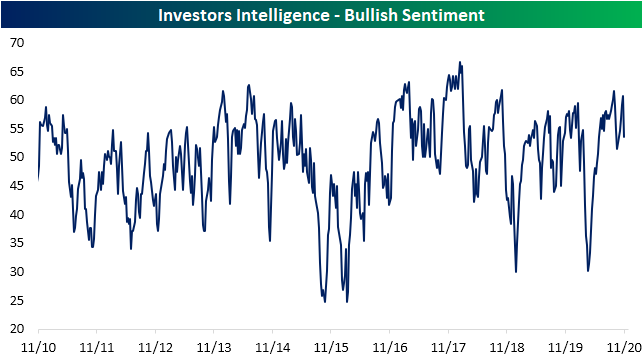
Meanwhile, the percentage of newsletter writers that are “looking for a correction” rose sharply to 25.8% this week following last week’s over 5% decline for the S&P 500.

The Investors Intelligence survey has a long history dating back to 1963, and in all weeks in that time, only 5% (174 weeks) have seen bullish sentiment fall 5 percentage points or more while the percentage of respondents looking for a correction has risen at least 5 percentage points in the same week. In the chart below, we show the average performance of the S&P 500 following these past occurrences when there has not been another in the prior 3 months. The S&P 500 has frequently been higher over the following weeks and months, but there is a slight underperformance relative to all periods since 1963 when the survey begins. Click here to view Bespoke’s premium membership options for our best research available.

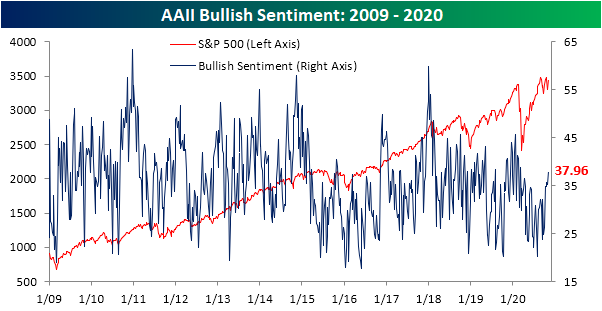
Bullish Sentiment Back Above Average
After remaining depressed for most of the past few months, the past several weeks have marked a rapid turn higher in bullish sentiment as per the American Association of Individual Investors’ weekly survey. As shown in the first chart below, bullish sentiment rose another 2.67 percentage points this week to 37.96%. That is the most optimistic reading on sentiment since the first week of March.
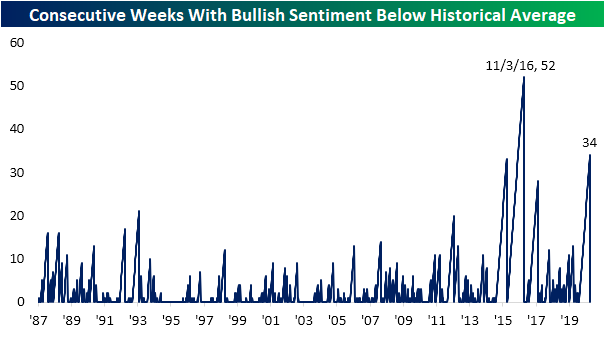
As the percentage of bullish respondents has risen to the high-30% range, it has finally moved just barely above its historical average of 37.91%. That is the first time this has happened in 34 weeks. As shown below, that makes for the second-longest streak of below-average readings on bullish sentiment in the survey’s history. The only one that went on for longer was back in 2016 when the streak lasted for exactly a year.
As bullish sentiment rose, bearish sentiment fell. Only 31.48% of investors reported as bearish which is the lowest level of market pessimism since February 20th; one day after the last bull market peak. Following the stretch of historically elevated readings over the past few months, this week’s decline brings the reading into the middle of its historical range (58th percentile), though unlike bullish sentiment, that is still slightly above the historical average of 30.63% as has been the case for the past 37 weeks. That is also the second-longest streak of above-average readings in bearish sentiment on record behind one that went on for 83 weeks ending in 2009.


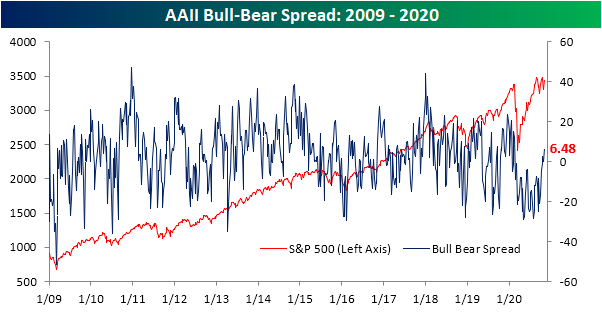
Given the respective moves in bullish and bearish sentiment levels, the bull-bear spread has moved higher into positive territory after a reading of zero last week. With a move higher of 6.48 points this week, the bull-bear spread is at the highest level since February 20th.
Not every investor has a strong opinion on the market though. The percentage of respondents reporting as neutral was also higher this week, rising 1.15 percentage points to 30.56%. That is still off the pandemic high of 31.96% from July. Click here to view Bespoke’s premium membership options for our best research available.
