Bespoke CNBC Appearance (11/24)
Bespoke co-founder Paul Hickey appeared on CNBC’s Squawk Box to discuss the current market backdrop and some of our views on factors that will impact the market going forward. To view the segment, please click on the image below.
Chart of the Day: Home Prices Explode
Seasonally Low Volumes
Due to the Thanksgiving holiday, it is a shortened trading week with no trading occurring Thursday and an early close on Friday. As a result, trading volumes are bound to be light this week. In the table below we show the average volume in SPY volume versus its 50-DMA for each calendar day of the year since SPY began trading in the early 1990s. As shown in the bottom-most row, whereas the months in the first quarter of the year and October have been seen the most above-average volumes (relative to the 50-DMA), the year tends to close out on relatively muted volumes. In November and December, volumes have averaged anywhere between 4.57% and 5.91% below the 50-DMA. In other words, investors historically have been the most active at the start of the year, ramping up activity again in October before taking a step back around the holidays.
As previously mentioned, volumes in November are notably weak and the time surrounding Thanksgiving is no exception. Thanksgiving can be anytime from November 22nd through the 28th, and as highlighted below, these are some of the days with the lowest volumes of the year. Similarly, the days surrounding Christmas and leading up to New Year’s have been the period of weakest volumes of the year.

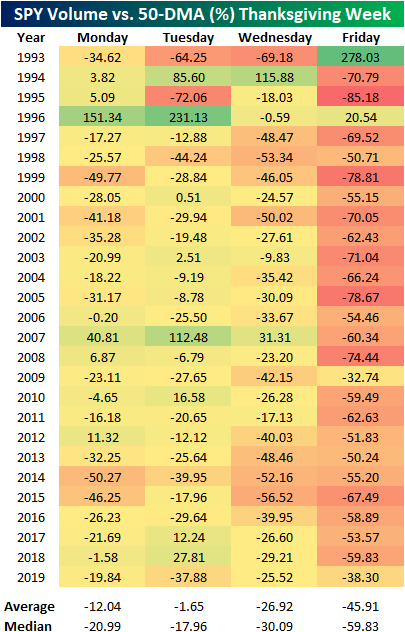
Some of these weak volumes account for simply less time with the market open given the half-days the day after Thanksgiving and on Christmas Eve, but even still, these are both generally quiet times for the market. In the table below, we show a more granular look with volumes versus their 50-DMA during Thanksgiving week. As shown, since 1993 when SPY began trading, less than a fifth of days during the week of Thanksgiving have seen volumes that were above the 50-DMA. While Monday and Wednesday see significantly smaller volumes, Friday’s shortened sessions understandably result in volumes being less than half what is the norm. We’d also note that the much stronger than average volume in SPY on the Friday after Thanksgiving in 1993 was partially a result fo the fact that it was the first year of the ETFs existence and it wasn’t nearly as ubiquitous of a trading tool as it quickly became in subsequent years. Click here to view Bespoke’s premium membership options for our best research available.
Consumer Confidence Falls More Than Expected
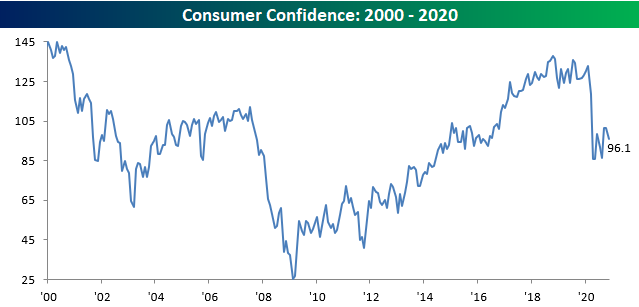
Consumer Confidence for the month of November showed a larger than expected decline falling from October’s upwardly revised reading of 101.4 down to 96.1. Economists had been forecasting a more modest drop to 98.0. Unlike many other indicators which have really seen meaningful bounces off their COVID lows, Consumer Confidence isn’t one of them.
Breaking down confidence levels by both Present Conditions and Expectations, sentiment towards the current state of affairs declined slightly falling from 106.2 down to 105.9. Expectations, on the other hand, saw a more significant decline falling below 90 and less than three points from the low back in August. While the Present Situation index understandably saw a sharp drop at the onset of COVID, the Expectations Index had already started trending lower in late 2018 and has continued that trend right on through the pandemic.

One reason consumer sentiment has been slow to improve is that the employment picture remains uncertain. The Jobs Plentiful index remained unchanged at 26.7 in November. That’s well off the low of 16.3 in March but still far from February’s reading of 46.5 let alone the high of 50.3 in August 2019. Click here to see Bespoke’s premium membership options and start a free trial for instant access to our research and interactive tools.

Bespoke’s Morning Lineup – 11/24/20 – Moving Along
See what’s driving market performance around the world in today’s Morning Lineup. Bespoke’s Morning Lineup is the best way to start your trading day. Read it now by starting a two-week free trial to Bespoke Premium. CLICK HERE to learn more and start your free trial.
“Things are not always what they seem; the first appearance deceives many; the intelligence of a few perceives what has been carefully hidden.” – Phaedrus
In yesterday’s Chart of the Day (“Monday Night is Bull Time“), we noted that when you look at historical market returns based on after-hours and regular hours performance and then further break down those returns by the day of the week, the best time to be long the market has historically been from the close on Monday to the open on Tuesday. There’s still an hour left until the opening bell, but based on where futures are trading this morning, that strategy appears to have worked last night.
The catalyst for this morning’s move in futures is news that while he has yet to concede, the President instructed GSA to allow for the beginning of the transition process. Global equities around the world have also been rallying with a general risk-on sentiment, and in Germany, Q3 GDP showed a stronger than expected bounce from Q2’s plunge. On a side note, Germany’s benchmark DAX index will also be expanded from 30 to 40 companies.
Be sure to check out today’s Morning Lineup for a rundown of the latest stock-specific news of note, the Nikkei’s surge to multi-decade highs, European economic data, trends related to the COVID-19 outbreak, and much more.
Also, we had a segment on CNBC earlier this morning discussing the market’s current backdrop and what to expect going forward. Give it a watch (CNBC Interview – 11/24/20) if you have the time.

With COVID cases surging throughout the country, it has been surprising for traders and investors to see the stocks that originally benefitted the most from COVID basically flatlining after their surge from the March lows through late Summer. The chart below shows the performance of our “Stocks For the COVID Economy” basket since the start of March. The basket’s performance has basically been moving sideways for the last three months after its late Spring/Summer surge.

On a relative strength basis versus the S&P 500, COVID stocks steadily outperformed the S&P 500 right up until October, but just as case counts surged, the COVID stocks fell off a cliff relative to the S&P 500 (chart below). The assumption here was that despite the third wave, investors were looking past the bad news (in the present) and forward to the Spring when case counts would likely decline and vaccines would be rolling out. Ironically, though, Pfizer’s (PFE) vaccine announcement on 11/9 represented what has been a short-term low for the relative strength of the COVID stocks versus the S&P 500. In fact, since the close on 11/9 (a day when the COVID stocks underperformed the S&P 500 by a wide margin), the S&P 500 is up less than 1% while the average return of the COVID stocks is a gain of 4.6%. Just as with a lot of other areas of life, things are not always as they seem.

Daily Sector Snapshot — 11/23/20
Chart of the Day – Monday Night is Bull Time
Breadth Approving
With yet another positive vaccine-related headline pushing the market higher today, Industrials and Materials are both touching new 52 week highs. As for the other sectors, only Consumer Staples and Health Care alongside the broader S&P 500 have made new highs at some point in the month of November. At the moment, those same sectors as well as Tech, Consumer Discretionary, and Communication Services are all within 5 percentage points or less of their respective 52-week highs.
In terms of breadth, though, new highs have been easier to come by. As shown in the charts below, across the eleven sectors as well as the broader S&P 500, breadth has been generally confirming a move higher as only the cumulative A/D lines of Real Estate and Energy have not seen a new high within the past two weeks. Some of those new highs in breadth have also been a contrary story to price. With regards to Consumer Discretionary and Tech, prices have seen some lower highs over the past few months, but their advance-decline lines have been diverging from price and have continued to trend higher. Similarly, breadth in the Communication Services sector has continued to rip higher, unlike price which has stalled within the past couple of weeks.
Lastly, sectors making new highs in terms of price like Industrials and Materials have seen breadth do the same in recent days. Broadly speaking, the direction of breadth has been consistent with recent price moves, and even for the areas where that is not necessarily the case (as with Tech), the strong breadth can be taken as a positive for internals. Click here to view Bespoke’s premium membership options for our best research available.

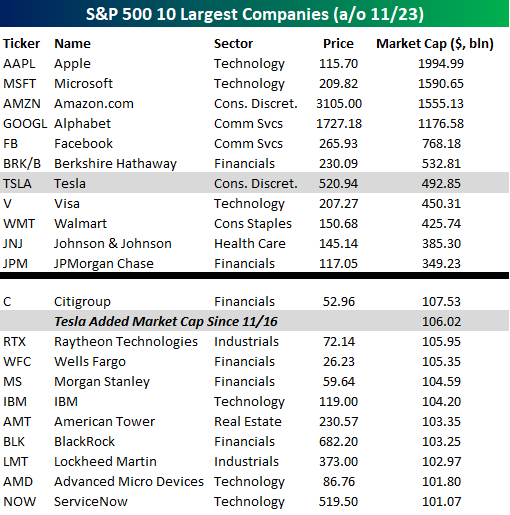
Tesla (TSLA) Keeps Charging Ahead
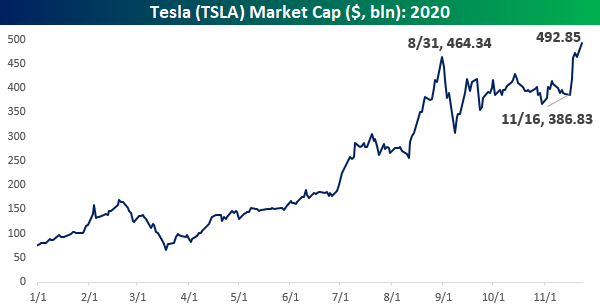
It’s been a week now since the announcement was made that Tesla (TSLA) would be added to the S&P 500. What a week it has been! Since the close last Monday, TSLA has seen its market cap swell by more than $100 billion from $386.8 bln up to $492.9 bln. In a week! When the keepers of the S&P 500 made the announcement that TSLA would be added to the S&P 500, they noted that they were giving the investment community ample advance notice and would also seek the investment community’s feedback to determine the best way to handle it “due to the large size of the addition.” Well, it’s only been a week, but the complications of adding such a large component to the index have only gotten bigger over the last week. $106 billion bigger to be exact!
The table below lists the ten largest companies in the S&P 500 by market cap and where Tesla ranks among them. At a market cap of $492.85 billion, TSLA’s market cap ranks as the sixth-highest of any US company- over $40 billion more than Visa (V), and $40 billion below Berkshire Hathaway (BRK/B). While TSLA has the 6th largest market cap, it wouldn’t have the sixth-highest weighting, though. Because S&P 500 weightings are determined by the market caps of a company’s free-floating shares and not all of its shares are free-floating, TSLA’s weighting will be a few more notches down the list of the top ten companies.
Just as incredible about TSLA’s size going into the S&P 500, is the amount of market cap it has added since the announcement was made. With an increase in market cap of just over $106 billion in the last week, TSLA’s market cap has risen by almost as much as the entire market cap of Citigroup (C) and more than other large-cap stocks like Raytheon (RTX), Wells Fargo (WFC), Morgan Stanley (MS), and IBM. Click here to view Bespoke’s premium membership options for our best research available.
Bespoke’s Morning Lineup – 11/23/20 – More Positive Vaccine News
See what’s driving market performance around the world in today’s Morning Lineup. Bespoke’s Morning Lineup is the best way to start your trading day. Read it now by starting a two-week free trial to Bespoke Premium. CLICK HERE to learn more and start your free trial.
“You live and you learn. At any rate, you live.” – Douglas Adams
It looks like the market has another case of the Mondays. Unlike ‘typical’ Mondays, this Monday represents the third straight week that Americans are waking up to positive news related to vaccines. As one might expect given the headlines, futures are higher with reopening stocks leading the way. Stay at home stocks, on the other hand, are predictably trading lower. In both cases, though, the headlines seem to have a diminishing impact as the magnitude of the moves in all of these asset classes are smaller than the initial vaccine news from earlier this month on November 9th.
Be sure to check out today’s Morning Lineup for a rundown of the latest stock-specific news of note, Markit PMI data, trends related to the COVID-19 outbreak, and much more.
The CDC may be recommending that Americans stay at home rather than travel this Thanksgiving, but if recent air travel statistics are any indication, the advice isn’t necessarily being followed. The chart below shows the seven-day average y/y change in the number of passengers traveling through TSA checkpoints since the crisis began. On the one hand, passenger traffic is down an average of 61.2% relative to the same time last year. While that’s a big drop, it’s actually the least negative reading we have seen since March when the crisis began. Furthermore, yesterday’s passenger throughput was 1.048 million which was the highest single-day reading since March 16th and just the third day since then that there were more than 1,000,000 air passengers in a single day (Friday and 10/18 were the two others).
