Daily Sector Snapshot — 12/18/20
An Overbought World
The majority of global equity markets tracked in our Global Macro Dashboard found a short-term bottom at some point in late October including the US. As shown below, of the 23 ETFs tracking each of these countries’ equity markets, nearly all are up double digits since the end of October. A dozen have risen over 20% and Brazil (EWZ) has risen more than any other country, gaining over 40%. China (MCHI), on the other hand, is the only hold out as it has risen just 3.44% over the past month and a half. Given these moves, most of these ETFs are overbought as defined as trading at least one standard deviation above their 50-DMAs. Only Hong Kong (EWH) and China (MCHI) are not overbought by this measure while India (INDA) is currently the most overbought ETF trading 1.92 standard deviations from its 50-DMA. That is even though it is at the low end of the performance range of these country ETFs listed. Top-performing Brazil, on the other hand, is the second most overbought ETF trading 1.85 standard deviations above its 50-day. In percentage terms, Brazil is also the ETF trading the furthest above its 50-DMA.
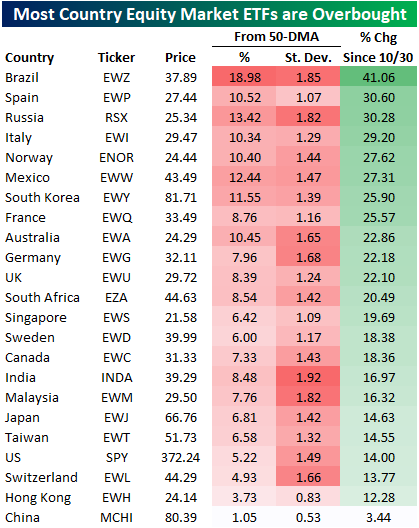
In the charts below, we show the trading range charts of each of these ETFs over the past six months. As shown, most are fairly elevated at or near some of the highest levels of the past six months. With that being said, there are some country ETFs that have seen a bit of a drift lower in recent days and weeks. For example, France (EWQ), Hong Kong (EWH), and Singapore (EWS) have all made a move lower within their respective trading ranges recently even though they are still overbought. Similarly, Sweden (EWD) has been more or less trading sideways since late November. The same had been true for Switzerland (EWL) and Norway (ENOR) until they began to break out to the upside in recent days. Click here to view Bespoke’s premium membership options for our best research available.

Leading Indicators Positive
Leading Economic Indicators for the month of November came in higher than expected this morning, rising 0.6% versus estimates for an increase of 0.5%. One way we like to track the index of Leading Economic Indicators is to compare its ratio vs the index of Coincident Economic Indicators. The chart below shows the monthly ratio going back to 1959 with recessions highlighted in gray.
If you aren’t familiar with this ratio, it tends to rise during economic expansions and then roll over in advance of recessions. Then, towards the end of the recession, the ratio bottoms out and starts to improve. Even ahead of the current recession, the LEI/CEI ratio peaked in September 2018. While the pace of the decline wasn’t nearly as steep as it was heading into prior recessions, the weakness in the ratio suggests that the economy was already at risk of a slowdown before the COVID outbreak. Who knows? If COVID never happened, maybe the US economy would have experienced a recession at some point in 2020 anyway.
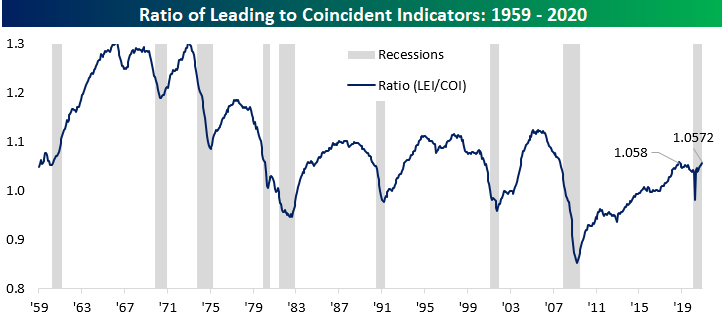
While it’s a bit hard to see in the chart above, as the shorter-term chart of the LEI/CEI ratio below shows, November’s reading isn’t far from the pre-recession highs reached 26 months ago. Why is this important? For starters, at 26 months, the current streak without a new high isn’t even the longest we have seen since the end of the financial crisis. The longest streak without a new high was 27 months from mid-2011 through mid-2013. Therefore, if the ratio rises again next month and makes a new high, it will be tied with that prior streak, one which didn’t even result in a recession. More importantly, though, in every prior recession since 1960, the LEI/CEI ratio has never been this close to a new high and still in a recession. This means one of two things – either the LEI/CEI ratio has become flawed or the recession that began in February has been over for months. Click here to view Bespoke’s premium membership options for our best research available.

Bespoke’s Morning Lineup – 12/18/20 – Stuck in Neutral
See what’s driving market performance around the world in today’s Morning Lineup. Bespoke’s Morning Lineup is the best way to start your trading day. Read it now by starting a two-week free trial to Bespoke Premium. CLICK HERE to learn more and start your free trial.
“When you see only problems, you’re not seeing clearly.” – Phil Knight, Shoe Dog
US equities are set up to close out the week on a down note with S&P 500 futures slightly lower but well off their overnight lows. The economic calendar is light today. On the earnings front, we’ve already had reports from Darden (DRI) and Winnebago (WGO), and the only remaining report of any consequence is Nike (NKE) which will be reporting after the close today. Friday afternoon earnings reports are very uncommon, so it will be interesting to see if the company has any notable news to announce when they report.
Be sure to check out today’s Morning Lineup for updates on the latest market news and events, a recap of economic data out of Asia and Europe, policy actions by the PBoC, an update on the latest national and international COVID trends, and much more.

Heading into the weekend, equities have had a positive run over the last five days. Small caps have been leading the way with gains of close to 3%, while large caps are up to a smaller degree. A case in point is the Dow ETF (DIA), which is the only major US index ETF that is not up over 1% over the last five trading days. At these levels, all of the index ETFs in our screen are trading at overbought levels with neutral timing scores.

Bespoke’s Weekly Sector Snapshot — 12/17/20
Neutral Sentiment Back on the Rise
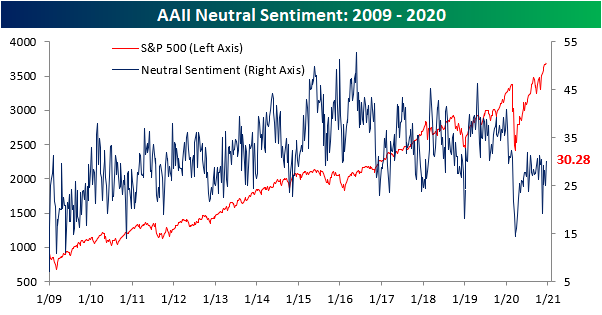
The S&P 500 has been edging its way higher back towards all time highs in the past week, and in spite of that move, sentiment has continued to moderate. The AAII weekly reading on bullish sentiment fell for a second week in a row coming in at 43.43%. That is the lowest level of bullish sentiment since the first week of November, though, that is also still elevated relative to where sentiment has frequently been over the past several years.

Despite the move lower in bullish sentiment, bearish sentiment also took as small turn lower. Just over a quarter of respondents to this week’s survey reported as bearish, down slightly from 26.86% last week. Inverse to bullish sentiment, without much of a large change, bearish sentiment remains at the low end of its range.

Given both bearish and bullish sentiment fell, neutral sentiment picked up the difference. Over 30% of respondents reported as neutral this week which was the most since the first week of November. While that is not a high reading relative to where neutral sentiment has normally come in over the past few years, it is at the upper end of the lower range since the pandemic began.
Even though neutral sentiment picked up, bulls continue to heavily outweigh bears. Given this, the bull-bear spread remains elevated. This week it fell down to 17.14% from 21.2%. That is the lowest level of the spread since the first week of November and is the seventh week in a row that more respondents reported as bullish than bearish. That is the longest streak of consecutive positive readings in the bull bear spread since one lasting 15 weeks ended in late January of this year. Click here to view Bespoke’s premium membership options for our best research available.

Philadelphia Manufacturing Hitting the Breaks
This morning, the Philadelphia Fed released its monthly reading on the region’s manufacturing sector. The headline index fell to 11.1, which was the second monthly decline in a row and larger than consensus expectations for a drop to 20. While the still positive number indicates further growth in the region’s manufacturing sector, it is also the slowest pace of growth in the last six months.

On Tuesday, the New York Fed’s monthly manufacturing report showed some slowing down in the manufacturing sector as the headline number dropped, though under the hood not all was lost as most sub-indices managed to rise month over month. The same cannot be said for the neighboring Philadelphia Fed region. Breadth in the report was very weak as only two indices (Delivery Times and Inventories) managed to move higher in December. The moves higher for those indices are also not necessarily good developments as they indicate higher inventories with longer lead times. Most other indices fell double digits with the declines of some in the bottom 1% of all monthly moves. On the bright side, every index did remain in expansionary territory (readings above zero) meaning growth has continued, but there was a significant slowdown.
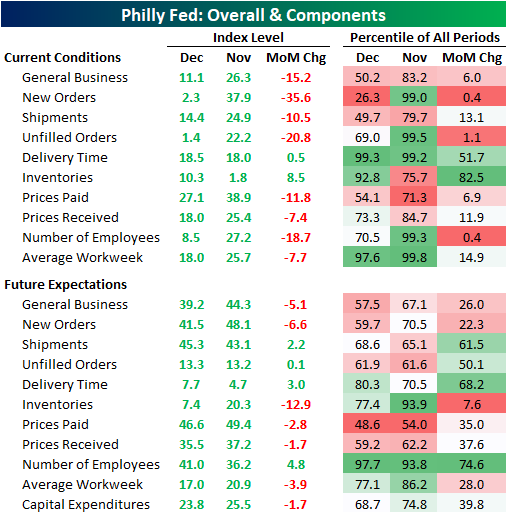
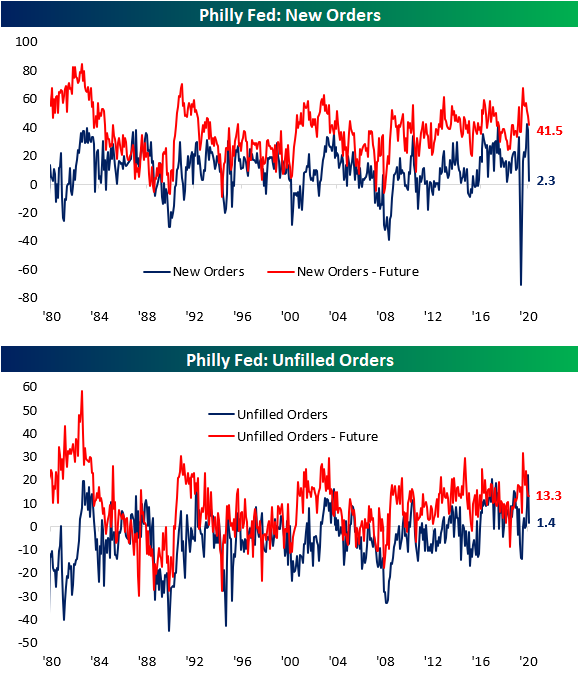
One of the areas to have seen the sharpest drop was New Orders. Whereas last month the index for New Orders came in at a near-record 37.9, December saw a huge drop down to a barely expansionary reading of 2.3. That 35.6 point drop was the largest decline since the 49.1 point and 55.4 point declines in March and April, respectively. It also ranks in the bottom 1% of all monthly moves going back to the start of the index in 1980. The same applies to the index of Unfilled Orders. Last month’s reading was the strongest since March of 1973, but the over 20 point decline in December resulted in a reading that points to much less rapid growth in unfilled orders than the previous month. That decline also ranks around the bottom 1% of all monthly moves.
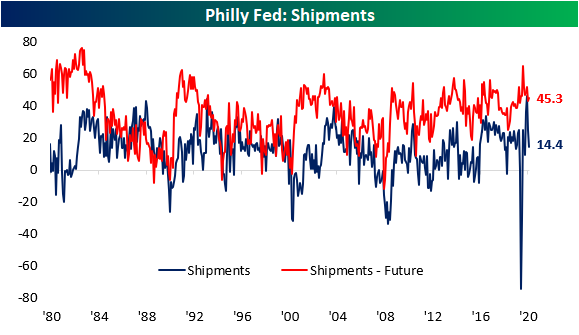
Given that slowdown in demand, Shipment growth also slowed in December although not to anywhere near the same degree as New and Unfilled Orders. The index for Shipments peaked back in October at 42.6. The past two months now have seen the number nearly cut in half falling to 24.9 last month and 14.4 this month. Again, the reading is still indicative of growth, but at a much more modest pace. In fact, December’s reading of 14.4 is essentially in the dead middle of the historical range.
Again, the only two indices that managed to move higher in December were those for Delivery Times and Inventories. Lead times remain historically high as the index for Delivery Times rose slightly to 18.5. That is in the top 1% of all readings. Elsewhere in the supply chain, inventories rose at a faster pace in December as that index rose from 1.8 to 10.3. That is the second month in a row of inventory expansion.


Finally, the employment metrics this month saw similar moves to those of orders. The index for number of employees was in the top 1% of all readings last month, but a historically large decline resulted in a much lower reading of 8.3 this month. That still indicates net hiring, but at a slowed pace. Additionally, the average workweek grew more slowly as that index fell from 25.7 to 18. Click here to view Bespoke’s premium membership options for our best research available.

Chart of the Day: One For The Watch List: AppHarvest (APPH / NOVS)
Bitcoin Goes Bonkers
Whether you want to call it a textbook breakout or a blow-off top, the move in bitcoin over the last two days has been something to behold. Think about it this way. In the last two days, bitcoin’s price has risen by $3,926 or roughly 20%. That’s a pretty incredible move even for bitcoin, but it’s even crazier when you consider the fact that at its intraday low in March, bitcoin’s price ($3,914.7) was lower than the gain in the last two trading days!

With bitcoin’s surge in the last two days, the ratio between bitcoin and gold is also making a run for its record high back in late 2017. At current prices, one bitcoin will buy you 12.3 ounces of gold. That’s still 2.5 ounces below the record high, but as recently as last Friday (12/11), the ratio was less than 10. Click here to view Bespoke’s premium membership options for our best research available.

Another Disappointment From Jobless Claims
After last week’s larger than expected 146K increase in jobless claims, economists were expecting to see an improvement this week with claims falling back down to 818K. Instead, claims unexpectedly moved even higher rising to 885K. That is the highest print for initial claims since the first week of September’s reading of 893K. Claims are now up around 169K in the past two weeks, the largest increase since the start of the pandemic.
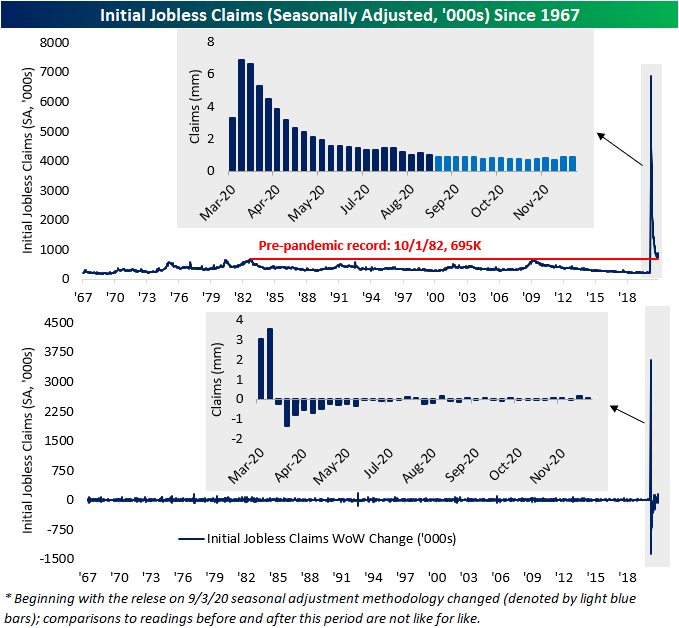
On a non-seasonally adjusted basis, the picture was slightly better. Unadjusted claims were actually slightly lower week over week falling down to 935.1K from 956.5K. Granted, that reading is still elevated at one of the highest levels since late July. Additionally, the current week of the year has typically seen a move lower; in all years since 1967, the 50th week of the year has seen a week over week decline 89% of the time averaging a 40K drop. That means the improvement in the unadjusted number could, to a degree, be chalked up to seasonality.

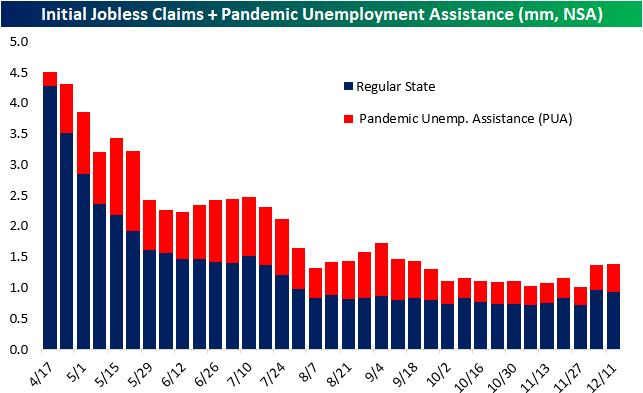
While unadjusted regular state claims fell, the inclusion of other programs like Pandemic Unemployment Assistance (PUA) worsens the overall picture. Total claims between the two programs rose to 1.390 million from 1.371 million last week which is the highest level of claims since the week of September 18th. Obviously, PUA claims drove that increase as they rose to 40K WoW to 455K. Like total claims, that is the highest print for PUA claims since September.
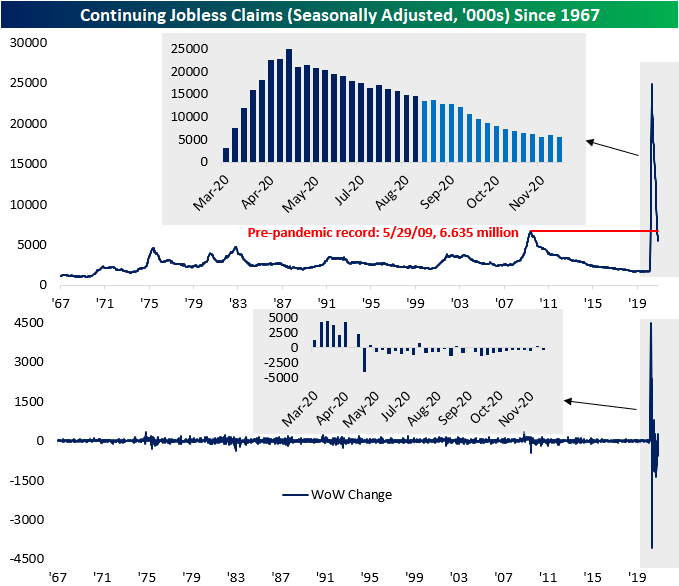
Despite last week’s massive increase in initial claims, continuing claims for the week of December 4th (lagged one week to the initial claims data) resumed its move lower falling to 5.508 million. That reversed the prior week’s (November 27th) uptick to 5.781 million, surpassing the pandemic low of 5.527 million from the week of November 20th in the process.
Including all programs adds yet another week of lag meaning the most recent data for all programs is for the last week of November; the same week as the previously mentioned uptick. During that week, not only did regular state programs see a significant increase, but so too did PUA claims which rose back above 9 million. That was as extension programs like Pandemic Emergency Compensation (PEUC) and Extended Benefits also rose to new respective pandemic highs. These programs also continue to account for more than a quarter of total claims. In other words, the uptick in the final week of November was broad across programs resulting in the sum of all programs to rise back above 20 million after just a week below that level. Click here to view Bespoke’s premium membership options for our best research available.
