Chart of the Day: Triple Play Weakness
Bespoke Stock Scores — 10/20/20
Tesla (TSLA) Driving Into Earnings
Electric vehicle behemoth Tesla (TSLA) reports earnings Wednesday (10/21) after the closing bell. Headed into earnings, the stock has been consolidating since the end of August with highs roughly around $460 and some higher lows near the stock’s 50-DMA.

On Wednesday afternoon, the company is expected to report a fifth consecutive quarter of profit with EPS of $0.59. Frankly, that is lower earnings than those past four quarters but would mark another quarter in the black nonetheless. Fortunately for TSLA, Q3 earnings by multiple measures have tended to be the strongest quarter of the year for the stock. As shown in the screenshot of our Earnings Explorer below, Q3 for TSLA has seen its strongest EPS beat rate of 80%. Sales beat rates are a bit weaker at 60%. Despite this, Q3 earnings have been by far the best for TSLA in terms of share-price reaction to the news. Not only has TSLA traded higher 80% of the time on Q3 earnings days (compared to 53% for all earnings days), but its average gap up, open to close, and full-day performance are stronger than any other quarter. Throughout its history as a public company, TSLA has averaged a one-day gain of 6.32% in reaction to its Q3 earnings report. No other quarter has seen the stock even average a gain of 1%+.
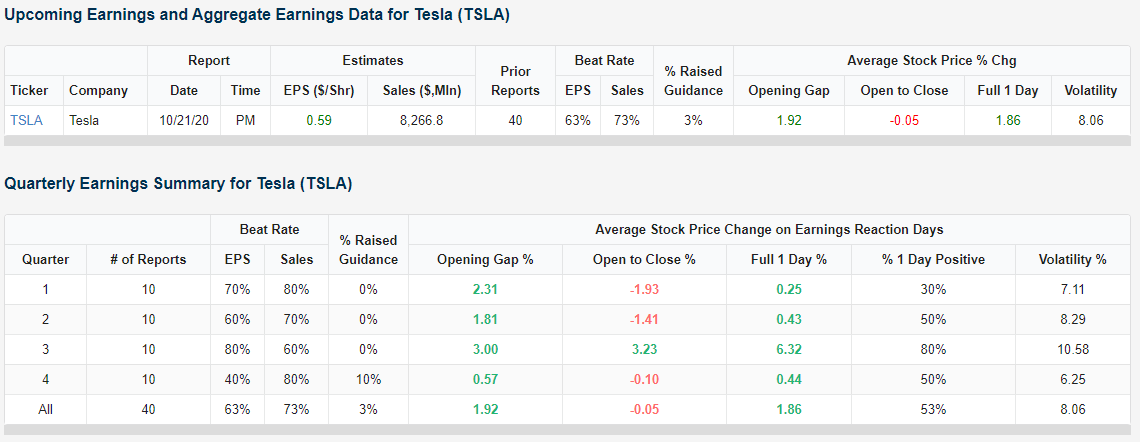
While TSLA has the tailwind of seasonal strength with recent quarters having seen strong results, the past year’s reaction to earnings have been pretty mixed. On its past two earnings reports, TSLA gapped up more than 5% at the open each time only to erase all of those gains intraday to close lower. In the two quarters prior to that, the stock rallied double digits on earnings. Last October when TSLA reported after the close on 10/23/19, the stock gained 17.67% in reaction to the news the following day. Start a two-week free trial to Bespoke Institutional to use our extremely useful Earnings Explorer tool today!

It’s Singles Month!
Today’s release of September data on Housing Starts and Building Permits was mixed at the headline level as Housing Starts missed expectations while Building Permits topped consensus forecasts. In each case, the magnitude of the beat or miss was similar, so in the end, it was basically a wash from a top-level perspective.
Within the details of the report, two trends stood out. First, in terms of both starts and permits, single-family units were the star of the show. Single-family Housing Starts rose 8.5% m/m and more than 22% on a y/y basis, while single-family Building Permits also saw similar levels of increases. In both cases, September’s levels for single-family units were the strongest since mid-to-early 2007. The second notable trend evident in this month’s report was a very strong environment in the Northeast. On a m/m basis, Housing Starts in the Northeast surged 66.7% while Permits increased over 25% m/m. There’s been no shortage of stories out there highlighting the exodus out of big cities like New York, and these trends suggest former residents of the Big Apple are moving out to the greener pastures of the suburbs.
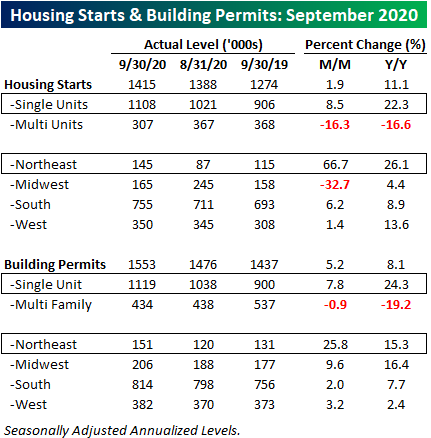
From a longer-term perspective, the quickly improved residential housing market bodes well for the broad economy. Housing Starts and Building Permits typically roll over leading up to and then plunge during recessions. This time around, the nature of the pandemic and the shutdowns were so instantaneous that economic data didn’t have time to roll over, and the massive amounts of subsequent stimulus and liquidity made the pullback short-lived. What’s most amazing about where things stand now is that even as the NBER hasn’t even announced the official end of the recession, Housing Starts on a 12-month average basis are already near their pre-recession highs! Normally, once a recession ends, it takes years before Housing Starts get back to their prior highs.

Taking a closer look at more recent data, the chart below shows the 12-month average of both Housing Starts and Building Permits over the last ten years. Incredibly, from their late 2018 highs through mid-2019 lows, both saw larger declines than they did during the pandemic.

While the 12-month average of Housing Starts and Building Permits are knocking on the door of new multi-year highs, the strength in single-family units has already pushed those readings to new post-financial crisis highs. Whether or not the economy rolls over again as economic momentum stalls out is up for debate, but looking at this data and the homebuilder sentiment data from Monday, it’s hard to look at it and say that the recession is not over. Click here to view Bespoke’s premium membership options for our best research available.

Bespoke’s Morning Lineup – 10/20/20 – Selling the News
See what’s driving market performance around the world in today’s Morning Lineup. Bespoke’s Morning Lineup is the best way to start your trading day. Read it now by starting a two-week free trial to Bespoke Premium. CLICK HERE to learn more and start your free trial.
“You never really know a stock until you own it.” – Walter J. Schloss
The half-life effect of headlines suggesting better odds of a stimulus deal has been shrinking. Yesterday, the positive impact was already erased by midday, and headlines overnight provided another lift to futures this morning, but most of the gains have already been given back. Providing another boost, though, is the latest data on Housing Starts and Building Permits.
Be sure to check out today’s Morning Lineup for a rundown of the latest stock-specific news of note, market performance in the US and Europe, key earnings data from the US and Europe, economic data out of Japan and China, trends related to the COVID-19 outbreak, and much more.

For the last four months, the trend of stock price reactions to earnings has been steadily positive but drifting lower on a three-month rolling basis. Through yesterday, the median one-day reaction to earnings for stocks reporting over the last three months has been a gain of 0.06%, which is 0.07% above the long-term average of a 0.01% decline. This earnings season is less than two weeks old, but unless things change quickly, it won’t be long before the median one-day reaction flips negative.

Not including earnings reports after the close yesterday or so far this morning, we have seen a total of 45 companies report earnings since the start of last week. Of those companies, 80% have topped EPS forecasts, 73% have exceeded revenues estimates, and 11% have raised guidance. Overall, those are pretty healthy numbers. Don’t tell the stocks of the companies reporting that, though. In response to the better than expected results, companies reporting have declined an average of 1.06% on their earnings reaction day, and only 14 have finished the day in the black. It’s still early in earnings season, but if this trend continues, it’s going to be a long earnings season.

Daily Sector Snapshot — 10/19/20
Chart of the Day: Worst Day Ever
October Optimism For Homebuilders
Given housing inventories remain historically low thanks to still strong demand, homebuilders have plenty to be optimistic about. The National Association of Home Builders (NAHB) has continued to show this strength as its monthly sentiment survey set a record high for the month of October. Back in August, the index tied the previous record level of 78 from December of 1998. Over the past two months, it has only raised that bar, coming in at 85 this month; 2 points above forecasts and last month’s reading of 83.

The rise in the index comes on broad strength across each of the sub-indices. Present Sales, Future Sales, and Traffic all matched or made record highs in October. The only sub-index that was not higher was for Traffic, though, it was unchanged at a record high.

As for the look across each of the four US regions, the West and Northeast both saw sizeable upticks to new records, but sentiment in the Midwest and South were actually slightly lower. For the Northeast, this is the third record in a row. Meanwhile, the West’s record high in October finally surpassed the prior high of 91 from October of 2005. Finally, even though sentiment fell in the Midwest and South, both remain at higher levels now than any month other than September’s record highs. Click here to view Bespoke’s premium membership options for our best research available.

Rocketing Restaurants
In Friday’s Bespoke Report sent to members, we noted two groups that have been surprisingly strong performers over the past several months: brick and mortar retailers and restaurants. Focusing on the latter, in the chart below we show the S&P 1500 Restaurants index over the past five years. As shown, up until last week the index’s last high prior to the pandemic actually came well before the rest of the market’s peak in February. The S&P 1500 Restaurants peaked in August of last year and only made a lower high on February 20th before falling over 40% during the course of the COVID Crash in late February and early March. Since the low on March 18th, the index has now risen over 77% and just broke out to a new all-time high.

COVID lockdowns and restrictions on in-door dining have impacted the restaurant industry like nothing ever seen before. Based on the monthly Retail Sales report, the Bars & Restaurants category has seen its share of total retail sales fall more than any other group since COVID began, while the Food & Beverage Store (grocery stores) category has been one of the biggest gainers. This is what makes the recovery for the S&P 1500 Restaurants group so noteworthy. While single-location restaurants run by individuals may be having a tough time with capacity limits depending on their geographic location, the publicly-traded restaurant companies with locations throughout the US have seemingly adapted much better in the post-COVID world. That’s what their share prices are telling us at least.

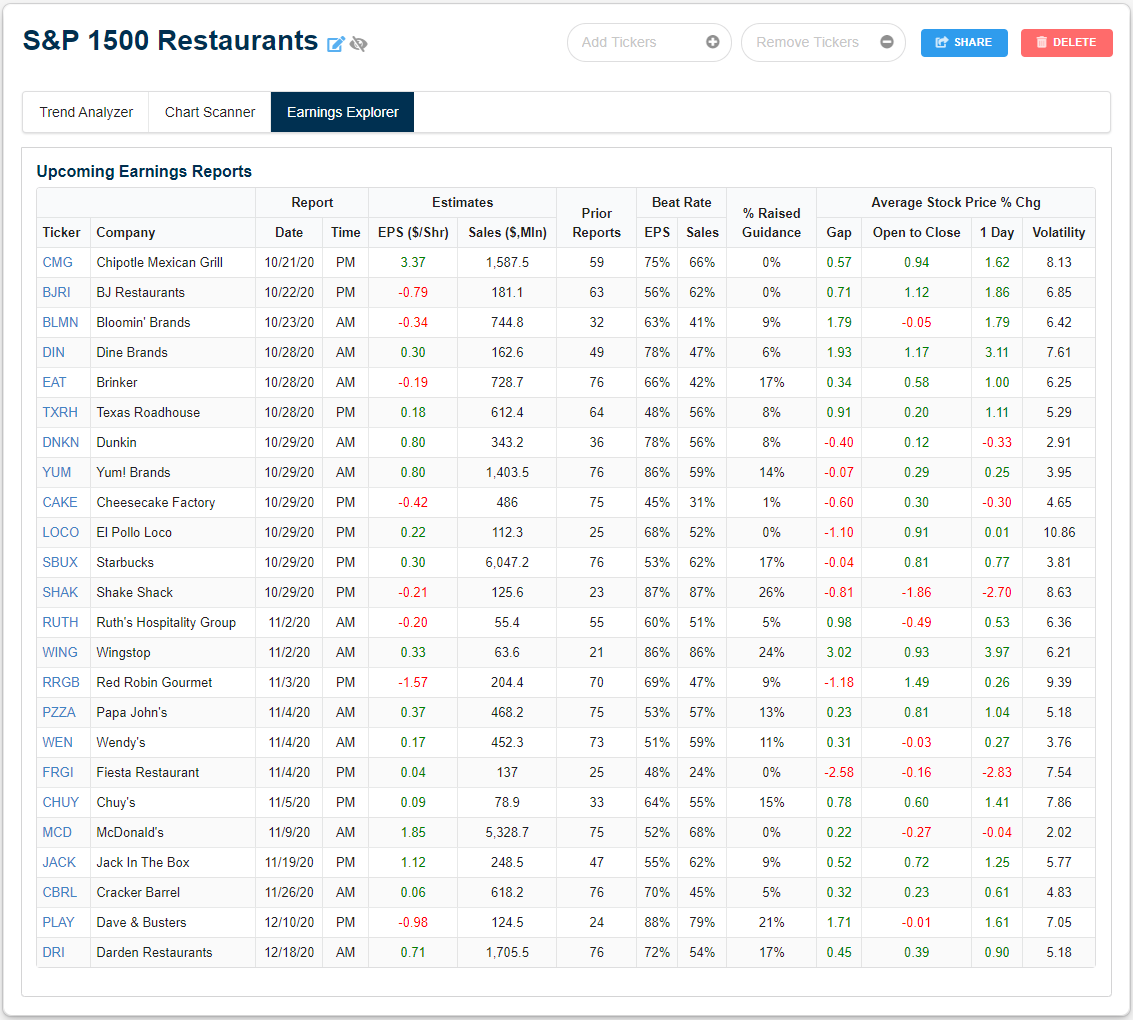
As shown in the table below, nearly all of the stocks in the S&P 1500 Restaurant group made 52-week lows around the time of the broader market bear market low in mid-March. All but four have since seen their stock price double. Brinker (EAT), the parent company of Chili’s, has risen the most since its low having gained well over 500%. Even after those massive rallies, there are still eleven that are down over the past five years and eleven that are down on a year-to-date basis. Dave & Busters (PLAY) and Red Robin (RRGB) are both down by more than 50% in 2020.

Of this group, Domino’s Pizza (DPZ) is the only one that has reported third-quarter earnings so far this earnings season with overall decent results beating on both the top and bottom line. As shown in the screenshot below, we created a Custom Portfolio of these stocks so members can track these names as earnings season carries on. From our Earnings Explorer data, the rest of the stocks in the group are scheduled to release earnings over the next several weeks. Click here to access our Earnings Explorer and Custom Portfolios tool free for the next two weeks.
Bespoke’s Morning Lineup – 10/19/20 – Back to a Million
See what’s driving market performance around the world in today’s Morning Lineup. Bespoke’s Morning Lineup is the best way to start your trading day. Read it now by starting a two-week free trial to Bespoke Premium. CLICK HERE to learn more and start your free trial.
“You can’t have a mid-life crisis in the airline industry because every day is a crisis.” – Herb Kelleher
We hope you enjoyed your weekend because while the economic calendar is relatively light this week, the flow of earnings will pick up in pace as earnings season kicks into high gear. Today, however, is on the quiet side with Homebuilder sentiment the only report scheduled and just a handful of companies reporting earnings.
Be sure to check out today’s Morning Lineup for a rundown of the latest stock-specific news of note, market performance in the US and Europe, key earnings data from the US and Europe, Chinese economic data released over the weekend, trends related to the COVID-19 outbreak, and much more.
The airline industry may always be in crisis but yesterday marked a big milestone for the industry as US total passenger throughput crossed back above the one million level for the first time since March 16th.

Yesterday’s increase in passenger traffic wasn’t just a one-day blip either. On a seven-day average basis, daily passenger traffic has also been steadily rising. Ten days ago, the seven-day average jumped back above the prior post-COVID high of ~780K from early September. Since then, we have seen a steady increase to the current level of ~872K which is nearly 100K above the prior high.

While airline passenger traffic has seen a steady increase off its lows, why aren’t the airline stocks doing better? The reason is that while passenger traffic has been steadily rising, we still have a LONG way to go before things get anywhere near back to normal. The chart below compares the performance of the airline ETF (JETS) to the y/y change in passenger traffic on a seven-day average basis (blue line). The trend is higher but still down by a lot. Yesterday’s million total, for example, was still down over 60% from the same day last year.
