B.I.G Tips – Caterpillar Sales Level Out
Chart of the Day: Rails On Skates
Bespoke Stock Scores — 10/27/20
Fifth District Flies High
The fifth and final regional Fed manufacturing survey for the month of October was released this morning from the Fifth District (Richmond), and like the saying goes, we saved the best for last. The Richmond Fed’s composite reading on the manufacturing sector rose 8 points to a record high of 29.
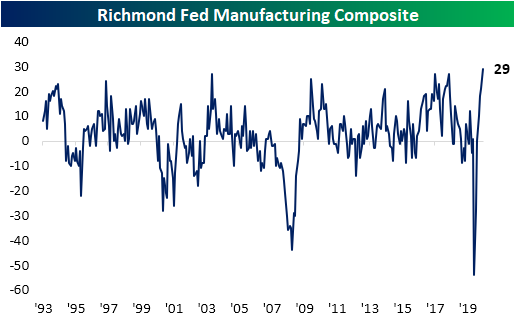
With the headline number at a new record high, several of the sub-indices of the report including the three main inputs to the composite index—shipments, new orders, and number of employees—are also around some of the highest levels on record. Only the indices concerning expenditures, inventories, and availability of skills remain at the lower end of their historical ranges.

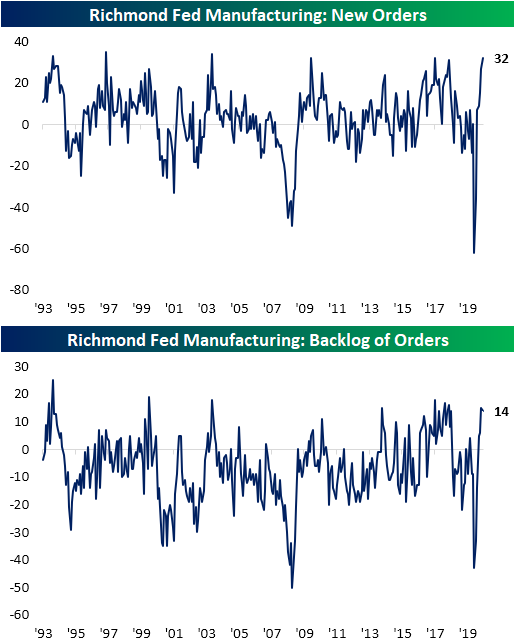
Demand continues to strengthen as the index for New Orders rose for a sixth straight month, gaining another 5 points in October. Now at 32, the most recent reading is tied with November of 2017 and April of 2010 for the fourth-highest reading on record. The only higher readings came in September of 1997 (35), March of 2004 (34), and June of 1994 (33). Meanwhile, the index for Backlog of Orders is still in the upper 5% of all readings, but that is lower this month after falling slightly from 15 to 14. That means as new orders also continue to come in at a historically high rate, existing orders continue to rise but at a slightly slower pace than September. Part of that reason is likely because businesses have continued to ramp up shipments. That index rose significantly this month jumping 17 points to the joint second-highest level on record.
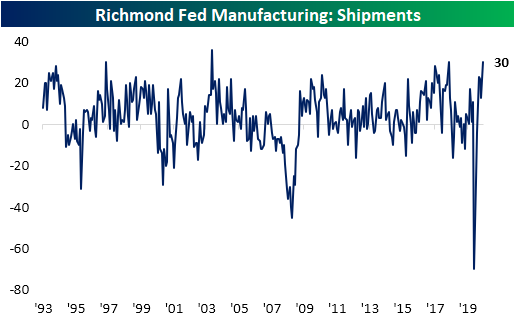
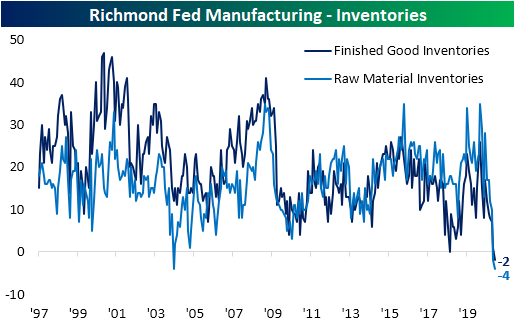
While historically high orders are being met with near-record production (Capacity Utilization is in the 99th percentile), it is still not enough to meet demand. As shown below, businesses are reporting lower levels of inventories for both finished goods and raw materials. Both indices fell to record lows in October.
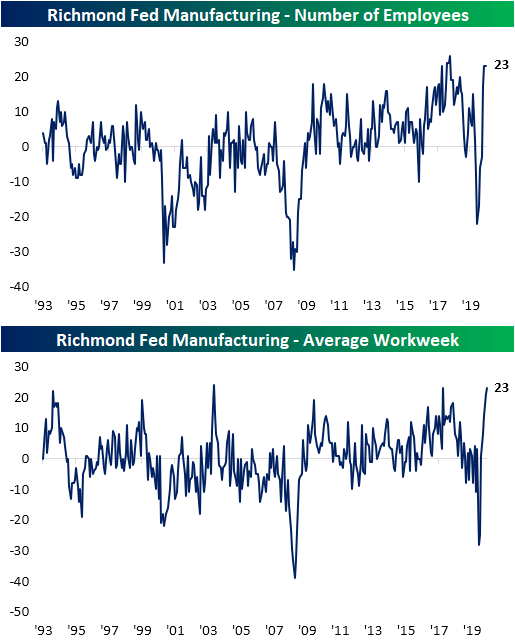
As for employment, the index for Number of Employees was unchanged at 23 in October. While there was not any improvement or deterioration, that is in the upper 2% of all readings. Even though businesses did not raise hiring, they appear to be making do with what workforce they have. Average workweek rose this month to 23 from 21 in September. Once again, this is in the top 1% of all readings in the history of the index. The only negative concerning employment showing up in the data is Availability of Skills which once again came in the bottom decile of its historical range. In other words, business hiring appears to be throttled by a lack of appropriately skilled labor.
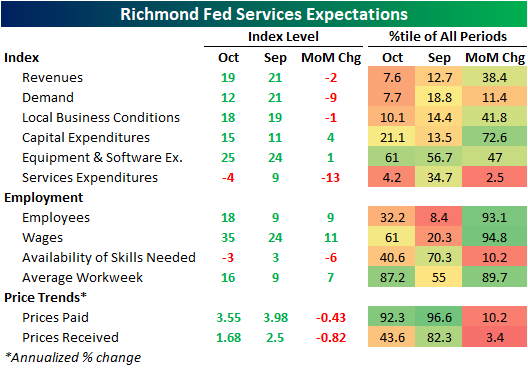
While the indices for current conditions were generally strong this month, expectations were another story. Businesses continue to generally be optimistic for the next six months, but sentiment saw a significant moderation as most indices experienced declines that were in the bottom 5% of all month over month changes. In the case of Number of Employees, the 24 point decline from a record of 47 last month was the biggest MoM decline on record.

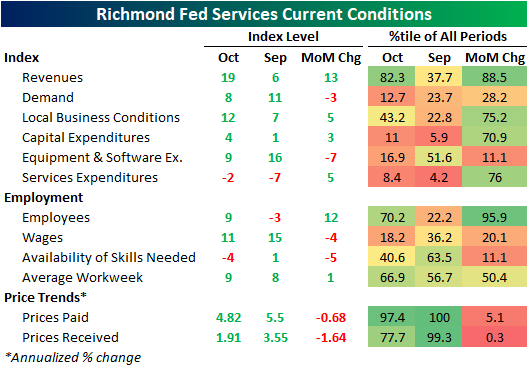
In addition to manufacturing data, the Richmond Fed also includes indices of the service sector. Whereas demand continues to surge for the region’s manufacturers, service sector demand has continued to improve but decelerated in October. Despite this, revenues have continued to rise sharply. Similarly, the index for Employees saw a significant uptick in October rising 12 points. The October reading is now indicative of rising levels of employment for the first time since March. Additionally, while the manufacturing survey indicated modest increases in prices, the services data indicates prices are running a bit hotter, particularly for prices paid. Click here to view Bespoke’s premium membership options for our best research available.
Slight Dip In Consumer Confidence
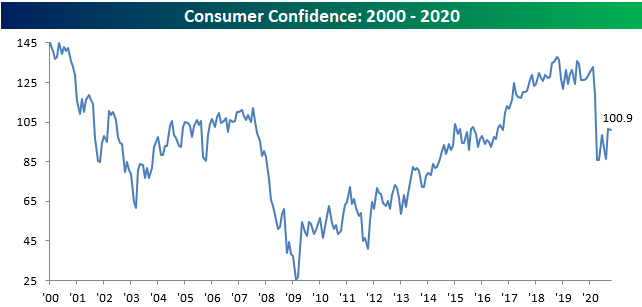
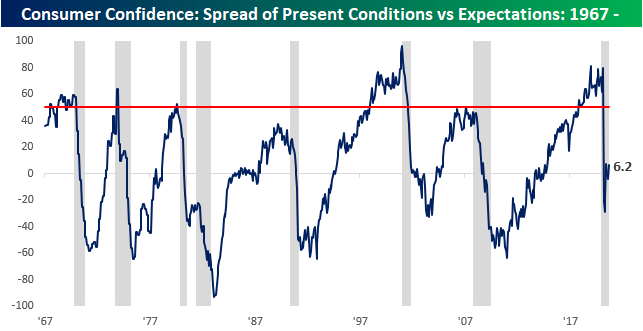
Consumer Confidence for the month of October was released earlier today and showed a slight dip relative to September. The headline index dropped from 101.3 down to 100.9 compared to expectations for a reading of 102.0. Given the rising number of cases and the upcoming election, it’s not too surprising to see confidence come in a bit, so a decline of this magnitude isn’t all that concerning. What is notable, though, is that even though Consumer Confidence remains right near post-COVID highs, it hasn’t bounced all that much off its lows.
Breaking out this month’s report by the sentiment of consumers towards both how they feel now and what they expect in the future, the Present Situation Index rose from 98.9 up to 104.6 while the Expectations component dropped from 102.9 down to 98.4. The drop in the Expectations component of this month’s report looks like it’s a partial reflection of growing uncertainty regarding COVID and the election as we head into the colder months of November and December.

In looking at the spread between Present Conditions and Expectations, it moved back into positive territory this month after dropping deeply into negative territory earlier this year. What’s interesting to note about current levels is that in every prior recession since the late 1960s, by the time the spread moved back into positive territory after turning negative, the recession was already well in the rearview mirror.
Sentiment towards jobs also suggests a relatively positive trend. At the current level of 26.5, the Jobs Plentiful index is still far from its 40+ reading before COVID, but it did increase again in October as it has now done in four of the last five months. While it’s by no means a strong reading at current levels, it hasn’t been getting worse either. Looking at past recessions, it wasn’t until well after the recession ended that the Jobs Plentiful index started to rebound. Click here for instant access to all of our research and interactive tools.

Relative Reversals
Over the past week, despite boasting massive outperformance on a year-to-date basis, the Technology Sector (XLK) has been the worst performer of the eleven sectors as it has fallen over 2.5% as shown in the snapshot of our Trend Analyzer below. That move has brought it below its 50-DMA. Conversely, the more defensive Utilities sector has risen the most with a 2% gain. That makes Utilities the only overbought sector at the moment. Right on the heels of Utilities is Communication Services which has risen over 1.75% in the past five days. That move has brought the sector back above its 50-DMA. Of the other sectors, only Health Care and Financials are in the green over the past few days.

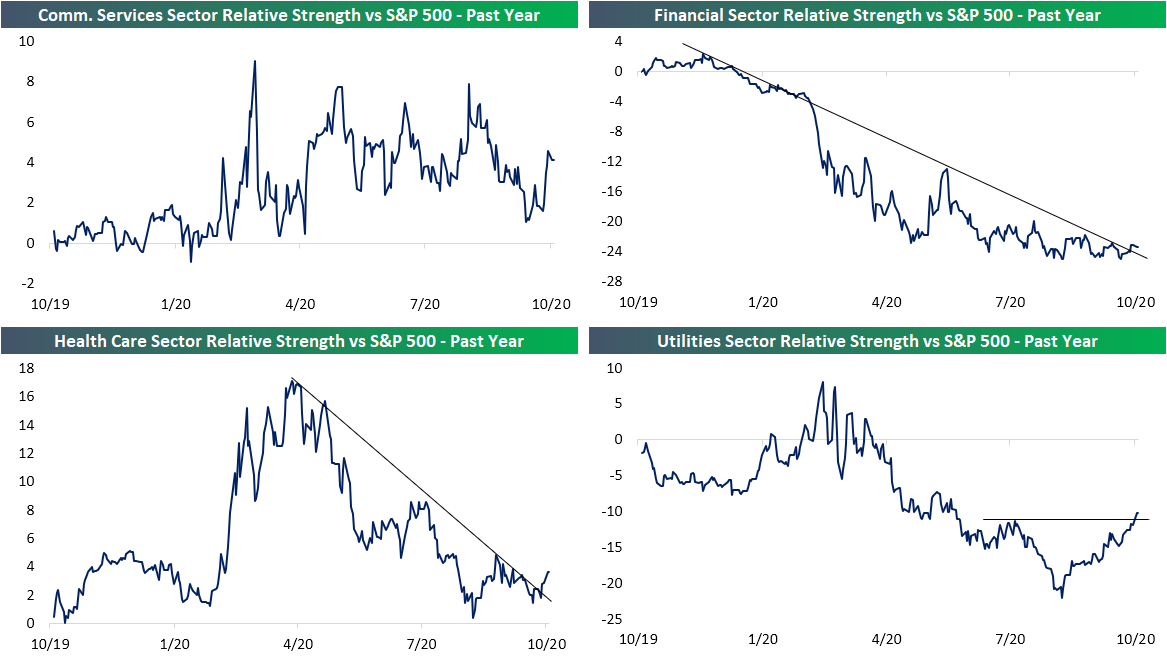
In terms of relative strength, these recent trends of out/underperformance across the different sectors has resulted in a few significant reversals. In the charts below, we show the relative strength lines of the four sectors that have risen over the past week versus the S&P 500. As shown, each of these sectors’ relative strength lines have turned higher recently. For Communication Services, the reversal higher has been sharp and broke a shorter-term downtrend that has been in place only since the end of the summer. Meanwhile, the trend reversal for the relative strength line for Utilities has been more gradual over the past two months and has broken a longer term downtrend. The line is now reaching new highs. As for Financials and Health Care, the outperformance has been more modest, but nonetheless is resulting in these two sectors beginning to break out of their multi-month downtrends that have been in place for most of the past year. At the moment, that breakout has been much more defined for Health Care.
As tumultuous of a year as it has been, one seeming constant has been the outperformance of the Tech sector. As shown below, the relative strength line of the Tech sector has been in a textbook uptrend essentially all year, but that has been put to the test over the past month. Earlier this month, the line put in a lower high, and in the past few days, it has broken that uptrend. Click here to see our sector relative strength charts on a daily basis with a two-week free trial to Bespoke Premium.

Bespoke’s Morning Lineup – 10/27/20 – The Little Things That Count
See what’s driving market performance around the world in today’s Morning Lineup. Bespoke’s Morning Lineup is the best way to start your trading day. Read it now by starting a two-week free trial to Bespoke Premium. CLICK HERE to learn more and start your free trial.
“Life is not about waiting for the storm to pass, it is about learning to dance in the rain.” – Unknown
With futures trading higher, technically you can call it a turn-around Tuesday, but based on current levels, US markets are set to only erase a fraction of their declines from Monday. There’s been a ton of earnings reports to contend with this morning (mostly positive) as the pace nears its peak for the reporting period.
Much of the weakness over the last several days has been attributed to rising COVID case counts and the lack of a stimulus bill, but we wouldn’t dismiss the impact of earnings. With expectations so high heading into the reporting period, the expectations bar was set so high that even with the great results we have seen so far, it’s been hard for investors to get too excited. The fact that the most recent peak for the S&P 500 was on October 12th- the day before the major banks started to kick off earnings season- is probably not a coincidence.
Be sure to check out today’s Morning Lineup for a rundown of the latest stock-specific news of note, market performance in the US and Europe, key earnings data from the US and Europe, Korean GDP, trends related to the COVID-19 outbreak, and much more.

With Monday’s shellacking in the equity market, just about every well-known US index ETF has seen a negative return over the last five trading days. The one exception is the S&P Small-Cap ETF (IJR) which is up a paltry 0.12%. As shown in the snapshot from our Trend Analyzer screen, unlike most recent pullbacks where large-cap stocks held up the best while small and mid-caps lagged, in the recent sell-off it has been the complete opposite. This time around, it’s the large-cap ETFs of the DJIA (DIA), S&P 100 (OEF), Nasdaq 100 (QQQ), and S&P 500 (SPY) that are down the most and have broken below their 50-DMAs, while most mid and small caps ETFs have outperformed and are still well over 2% above their respective 50-DMAs.
While all of the ETFs have all seen recent pullbacks of varying degrees, one common characteristic among them all is that they’re “Timing” scores all rank as Good.

Daily Sector Snapshot — 10/26/20
B.I.G. Tips – Monday Drops of 2%+
Texas Manufacturers Continue to Improve
Just like last week’s preliminary Markit PMIs and the first three regional Fed indices of October, this morning’s release from the Dallas Fed on the region’s manufacturing sector similarly showed a positive backdrop. The headline number was expected to come in at 13.3, which would have been a slight decline from September’s reading of 13.6. Instead, the index smashed those expectations rising to 19.8. As the index did the opposite of what was expected, it has now risen for each of the past six months with each reading since August indicative of expansionary (and accelerating) activity. At its current levels, the index for General Business Activity is now at its highest level in two years.

Breadth across the various components of the index also remains strong with only one index sitting in contraction: inventories. While every other index continues to show expansionary readings, October numbers for Unfilled Orders, Delivery Times, Employment, Hours Works, and Cap. Ex. were all lower month over month.

New Orders continue to rise at a strong clip. Even though outlook pulled back from a multiyear higher, the index for current conditions of new orders rose to its highest level (19.9) since August of 2018 (23.3). The growth rate also ticked slightly higher to 14.3 from 13.2. Again this was the strongest reading since August of 2018. Shipments on the other hand experienced a more modest increase of just 0.4 points which still leaves it below its August highs. Meanwhile, growth of Unfilled Orders showed a sizable deceleraion this month as that index fell 1.9 points to 4.1. That leaves that index at its lowest level since it exited contractionary territory back in June. Meanwhile, expectations for unfilled orders fell much more dramatically, with its 11.4 point decline in the bottom 5% of all month over month changes.

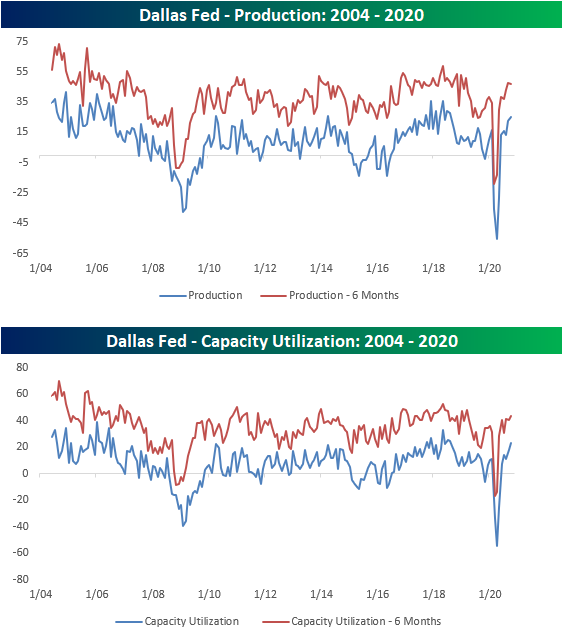
Given demand continues to strengthen, production has continued to rise. The current indices for Production and Capacity Utilization are right around the upper decile of historical readings and at their highest levels since August of 2018. While expectations for Production fell slightly this month, these indices also have relatively rosy outlooks with both indices around multiyear highs.
One notably weaker area of this month’s report concerns employment. Both the index for Employment and Hours Worked declined from September. For Employment, this month was the first decline since April. As for Hours Worked, October marked a back to back decline. These readings continue to indicate that the region’s businesses are on net hiring more people while also lengthening the hours worked, but it does mark a decelaration from the past few months. Click here to view Bespoke’s premium membership options for our best research available.
