The Bespoke Report – 1/15/21 – Can You See The Light?
Global equity markets took a breather this week as a quick debate played out amongst the FOMC over whether asset purchases might be “tapered” this year. Bond markets got a peak of the big fiscal support they priced in last fall and after Democrats retook the Senate on January 6th via Georgia runoffs. COVID prevalence looks to be peaking in the US as vaccine distribution starts to scale up despite an uneven run. And the galaxy of aggressive retail investors continue to press their favorite plays despite a hiccup for renewables stocks this week.
Put together, it feels like investors are starting to see the light, even if that light doesn’t necessarily mean good things for the market as a whole. Earnings season covering calendar Q4 will provide more insight as companies have started to report in earnest.
We discuss all the data and details that mattered this week, including a US earnings preview, reversals in renewable stocks, big gains for highly shorted names, a possible bottom in the dollar, the policy backdrop in China, commodity price action, and more in this week’s Bespoke Report.
This week’s Bespoke Report newsletter is now available for members.

To read the report and access everything else Bespoke’s research platform has to offer, start a two-week free trial to one of our three membership levels. You won’t be disappointed!

Prices on the Rise in New York
The New York Fed’s reading on the manufacturing sector released this morning showed the region’s manufacturing sector still grew in January but at a slower pace. Rather than the expected uptick to a reading of 6.0, the index fell to 3.5 from 4.9. That is the lowest reading since the last contractionary reading (those below 0) in June.

While the headline number is still consistent with growth it stands at the low end of the historic range. Similarly, demand related readings like New Orders and Shipments remain historically low, albeit still indicative of growth. Of each component in the report, only the indices for Unfilled Orders and Inventories remain in contraction. Meanwhile, in addition to the headline index, the indices for Shipments, Unfilled Orders, and Number of Employees all showed deterioration in January.
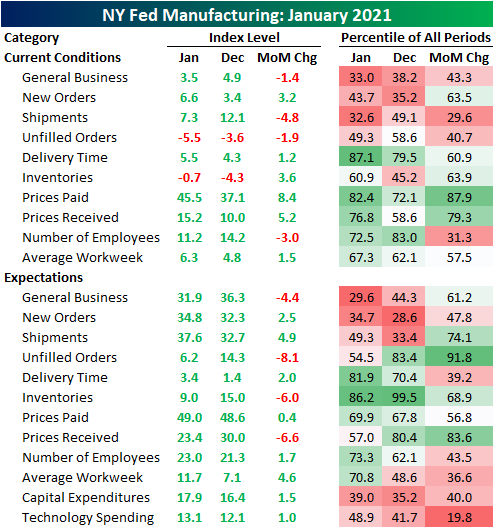
Whereas indices like New Orders and Shipments sit at lower ends of their historical ranges, those concerning employment are stronger. The index for Number of Employees showed slowing in hiring in January, though, firms were in fact continuing to take on more workers. Additionally, Average Workweek saw a bit of a bounce after declining in the final months of 2020.

The only indices to see dramatic moves higher in January concern prices. Prices Paid rose from 37.1 up to 45.5 which is the highest level since September of 2018. That 8.4 point increase was in the 87th percentile of all monthly moves for the index. Higher prices are also being passed on to customers as Prices Received was higher rising to 15.2. For that index, the level and move higher were not as dramatic. though. as it is only at the highest level since February of last year. That acceleration in rising prices is consistent with what we saw in the ISM report on the manufacturing sector last week. Click here to view Bespoke’s premium membership options for our best research available.

Bespoke’s Morning Lineup – 1/15/21 – Big Banks Beat, But…
See what’s driving market performance around the world in today’s Morning Lineup. Bespoke’s Morning Lineup is the best way to start your trading day. Read it now by starting a two-week free trial to Bespoke Premium. CLICK HERE to learn more and start your free trial.
We may have all come on different ships, but we’re in the same boat now.” – Martin Luther King Jr.
Even after an ambitious $1.9 trillion stimulus plan unveiled by President-Elect Biden last night and promises for more in the future, US futures are lower this morning while US treasury yields are lower. There’s a ton of economic data coming up this morning beginning with producer prices, Empire Manufacturing, and retail sales at 8:30. Later, we’ll get reports on industrial production, and University of Michigan consumer sentiment.
It’s a three-day weekend as US financial markets will be closed on Monday in observance of the birthday of Martin Luther King Jr (his actual birthday would have been today). Enjoy the three-day weekend, because earnings season will kick into a higher gear starting next week.
Be sure to check out today’s Morning Lineup for updates on the latest market news and events, a discussion of Biden’s stimulus plan, an update on the latest national and international COVID trends (which were all positive), and much more.

Between this morning and Tuesday morning, seven of the largest US banks and brokerage firms will be reporting results. As of this writing, the four reports to cross the wires have been Citigroup (C), JPMorgan (JPM), PNC, and Wells Fargo (WFC). Of these four, all of them beat EPS forecasts while both C and WFC missed revenue estimates. In reaction, all four stocks are currently trading lower with declines of up to 3%. On Tuesday (Monday is a holiday), we’ll get reports from Bank of America (BAC), Charles Schwab (SCHW), and Goldman Sachs (GS).
Below we have provided a snapshot from our Trend Analyzer of each of the large banks reporting today and Tuesday morning showing where they are trading relative to their trading ranges. While we’re just barely halfway into the first month of the year, all seven of these stocks have posted gains that many would have been happy with for an entire year. With the exception of PNC, every other stock in the snapshot is already up over 10% YTD with GS and WFC both up over 15%!
With these strong gains in such a short period of time, though, all of these stocks are trading at short-term overbought levels, while BAC, GS, and JPM are all more than two standard deviations above their 50-day moving average heading into today’s trading. This could be one reason all four of the banks reporting this morning are trading lower even though they all topped EPS forecasts. With high stock prices also comes high expectations, so that’s something to watch in these companies as they report.

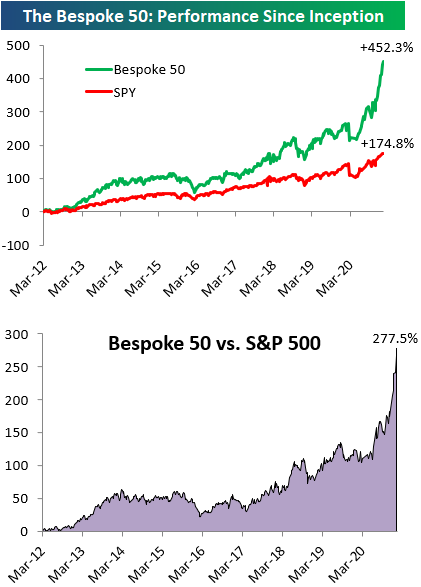
The Bespoke 50 Top Growth Stocks — 1/14/21
Every Thursday, Bespoke publishes its “Bespoke 50” list of top growth stocks in the Russell 3,000. Our “Bespoke 50” portfolio is made up of the 50 stocks that fit a proprietary growth screen that we created a number of years ago. Since inception in early 2012, the “Bespoke 50” is up 452.3% excluding dividends, commissions, or fees. Over the same period, the S&P 500 is up in price by 174.8%. Always remember, though, that past performance is no guarantee of future returns. To view our “Bespoke 50” list of top growth stocks, please start a two-week free trial to either Bespoke Premium or Bespoke Institutional.
B.I.G. Tips – Semis Off to the Races
Bespoke’s Weekly Sector Snapshot — 1/14/21
Heavily Shorted Stocks Stand Tall in 2021
By far one of the biggest movers of the past few days has been video game retailer GameStop (GME). Since last Friday, GME has risen over 96% with a 57.4% rally in Wednesday’s session alone. Today, the stock is up another 30.61% as of this writing and has reached one of the highest levels since November 2015. One likely factor behind the stock’s move has been a short squeeze of the company’s massive short base. For more than a year now, short interest as a percent of equity float has been around or well above 100%. The most recent reading as of the end of 2020 was 144.33%. In other words, there have been far more shares sold short than are available to trade. In a screen of all active stocks trading on US exchanges, we found only 18 that have more than 100% of their freely floating shares sold short, and they are all penny stocks with very small market caps.

While you would be hard-pressed to find a stock with as high of short interest as a percentage of the float as GameStop, generally speaking, stocks with high short interest have been some of the top performers this year. In the chart below, we show the average YTD performance of Russell 3000 stocks broken into deciles based on their short interest. The decile of stocks with the highest short interest as a percentage of float have by far been the best performers YTD, up for an average of 14.16%. Even excluding GME, the decile’s average YTD performance is a 13.93% gain. As you move across the deciles with lower short interest levels, performance gets worse. The tenth decile of stocks which consists of stocks with average short interest levels below 1% of float has only risen 3.6% on average.
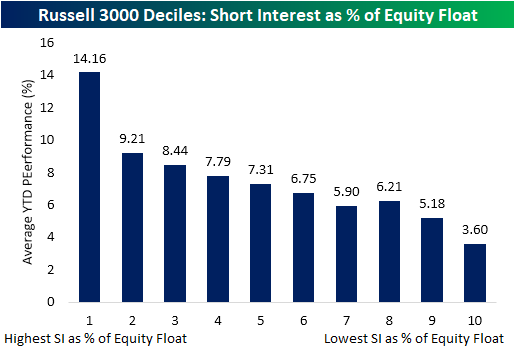
In the table below, we show the 30 Russell 3000 stocks with the highest short interest as a percentage of equity float. Across these names, they are up for an average of 15.76% in 2021, with only three not in the green: National Beverage (FIZZ), Acutus Medical (AFIB), and B&G Foods (BGS). Including GME, the largest number (7) of these most heavily shorted stocks are retailers. In fact, Dillards (DDS) and Bed, Bath, & Beyond (BBBY) both find themselves in the top 5 alongside GME. The former has over 90% of its float shorted while nearly two-thirds of BBBY’s float is sold short. Click here to view Bespoke’s premium membership options for our best research available.

Chart of The Day: This Is Ludicrous
Claims Make A Big Swing Higher
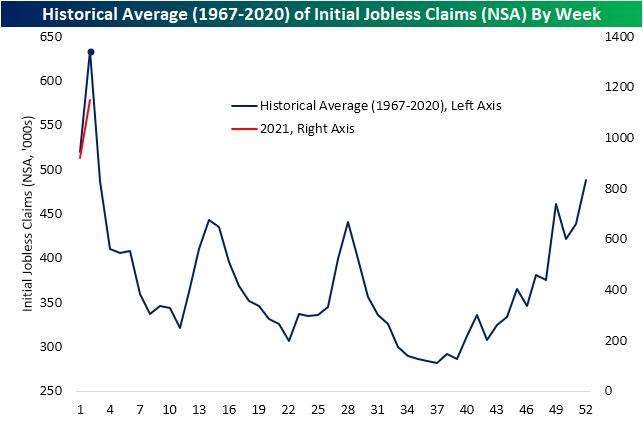
Overall, it was a bad week for jobless claims with both initial and continuing claims missing expectations. Initial jobless claims came in at the worst level since the week of August 21st rising to 965K versus forecasts for a jump to just 789K. That 183K increase versus last week was the largest move higher since April when claims were rising in the millions per week. Additionally, of the states that offered comments on the changes in jobless claims, many noted layoffs in industries like retail, accommodations and food services, and transportation. Despite the acceleration in the vaccine rollout, due to the fact that case counts remain near record highs and COVID restrictions remain in place, businesses and workers in the customer-facing services sectors are still feeling the pain.

While the seasonally adjusted number managed to stay below a million, before seasonal adjustments that wasn’t the case. Initial claims by this measure came in at 1.151 million this week, the highest reading and first time above 1 million since July 30th.
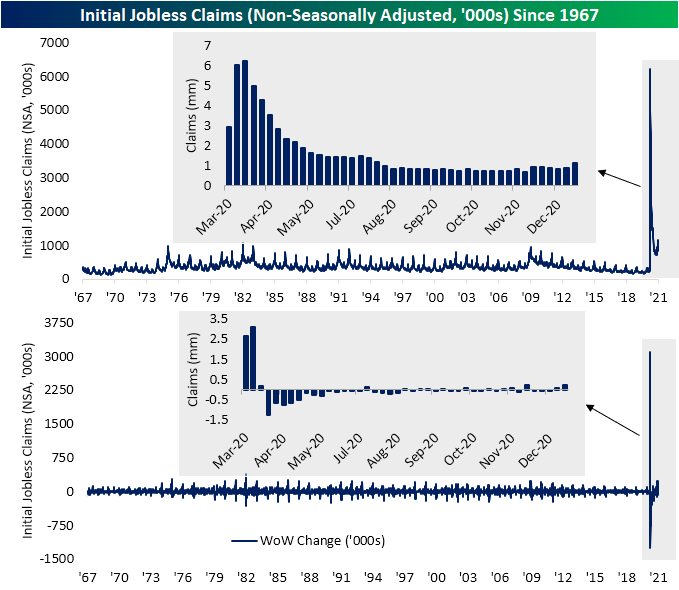
While the most recent week’s uptick is likely not all due to seasonality, as shown in the second chart below, the second week of the year usually does see a fairly large uptick in claims.
Last week we noted how PUA claims experienced a significant drop potentially due to the timing of the signing of the spending bill and the holidays. While there were yet again a handful of states unusually reporting zero PUA claims this week, total PUA claims across the nation were higher by 123.3K up to 284.47K this week. In other words, both regular state claims and auxiliary programs contributed to this week’s uptick.
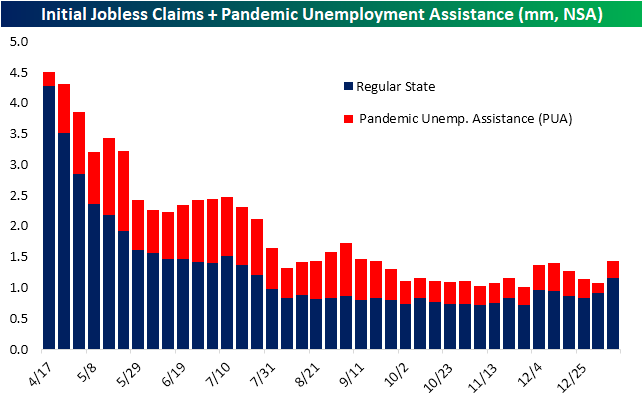
Continuing claims are lagged one week to initial claims meaning this week’s increase in the initial number was not factored into the continuing claims number, but nonetheless, it was also higher rising to 5.271 million from 5.072 million. That brings claims back to around where they were in mid-December.

Adding in all other programs to regular state claims adds another week’s lag. As of the last week of 2020, total continuing claims across all programs fell to 18.422 million from 19.183 million the prior week. That number is likely to move higher given the significant uptick in initial claims this week, but another problematic aspect of total claims is the growing number of unemployed who have been out of work for a long period of time. The share of claims from extension programs like PEUC and Extended Benefits accounted for nearly 30% of the most recent week’s total claims. Click here to view Bespoke’s premium membership options for our best research available.


Bespoke’s Morning Lineup – 1/14/21 – Earnings Season Begins
See what’s driving market performance around the world in today’s Morning Lineup. Bespoke’s Morning Lineup is the best way to start your trading day. Read it now by starting a two-week free trial to Bespoke Premium. CLICK HERE to learn more and start your free trial.
“The ability to recognize that the winds have shifted and to take appropriate action before you wreck your boat is crucial to the future of an enterprise” – Andrew Grove
The President was impeached by the House for the second time in just over a year yesterday, and like the first time, financial markets were unfazed. While the President’s first impeachment in the House in December 2019 was completely on a partisan basis and dead on arrival in the Senate, this time around, the fate of the impeachment in the Senate is more uncertain. What seems certain at this point, though, is that the completion (or maybe even the start of a trial) would not take place until after the inauguration, so from a market perspective, it really doesn’t matter much.
The only economic data of note today was Jobless Claims, and both initial and continuing claims came in much higher than expected. Initial Claims spiked up to 965K versus forecasts of 786K, and Continuing Claims rose to 5.271 million compared to forecasts for 5.0 million. In terms of the market reaction to these much weaker than expected reports, there really hasn’t been any.
In terms of individual companies, although earnings season kicks off today with reports from BlackRock (BLK) and Delta (DAL), the pace of reports will remain slow today and tomorrow. Regarding today’s reports, both BLK and DAL are trading modestly higher in reaction to their reports. Also notable, although not a US company, Taiwan Semi (TSM) also reported strong results and is trading up over 2.5%.
Be sure to check out today’s Morning Lineup for updates on the latest market news and events, a discussion of the latest import and export orders from China, an update on the latest national and international COVID trends, and much more.
With yesterday’s big move in Intel (INTC), the stock is now over three standard deviations above its 50-DMA. In the last nearly 40 years, there have only been 22 other days in which the stock was as overbought or more overbought than it is today.
