Daily Sector Snapshot — 11/3/20
Winners and Losers During Trump’s Presidency
With Election Day upon us, below we take a look at the biggest winners and losers across financial markets during the Trump Presidency from Election Day 2016 through today. First off, below is a chart of the market cap of the Russell 3,000 since Election Day 2000 which George W. Bush eventually won. The Russell 3,000 makes up more than 98% of the total US equity market cap, so it’s a good gauge to use for measuring the overall change in market cap levels. The current market cap of the Russell 1000 is just north of $35 trillion, which is up $11.5 trillion since Election Day 2016. President Obama oversaw US market cap growth of $12.3 trillion over his two terms, while President Bush actually saw market cap decline by $4.1 trillion after his two terms.

Below is a look at the total return of various asset classes since Election Day 2016 using key ETFs listed on US exchanges. The S&P 500 (SPY) is up 70.6% since Trump was elected, while the Nasdaq 100 (QQQ) more than doubled that at +144.3%. Of the broad index ETFs in the matrix, the Smallcap Value ETF (IJS) is up the least since Election Day 2016 at just +17.2%.
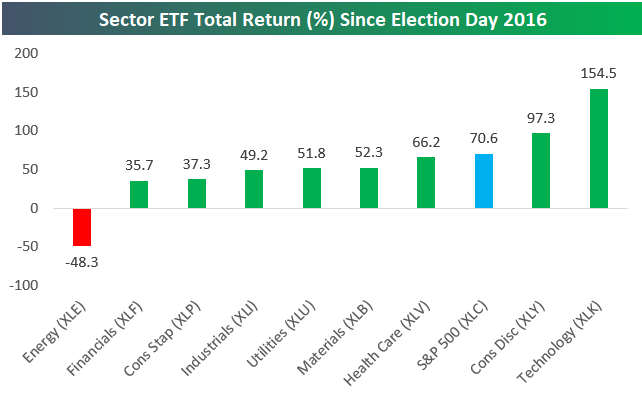
Looking at US sector ETFs, the Energy sector (XLE) is a huge outlier with a decline of 48.3% since Trump was elected. Technology (XLK) and Consumer Discretionary (XLY) are up the most with gains of 154% and 97%, respectively.
Along with Energy stocks, the oil (USO) and natural gas (UNG) ETFs have been more than cut in half since 11/8/16, while gold (GLD) is up 47% and silver is up 29.5%.

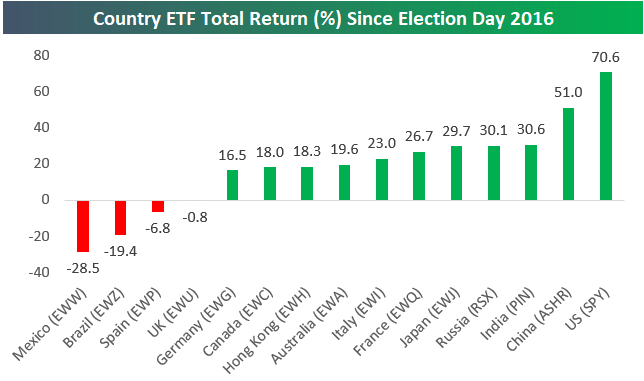
Not every country has seen stock market gains since Trump was elected. As shown below, Mexico (EWW) is down 28.5%, Brazil (EWZ) is down 19.4%, Spain (EWP) is down 6.8%, and the UK (EWU) is just slightly in the red.
The US (SPY) is up more than any other country with a gain of 70.6%, while China (ASHR) is up the second most at +51%. Whatever happened with the trade war certainly didn’t hurt the US and China versus the rest of the world on a relative basis.
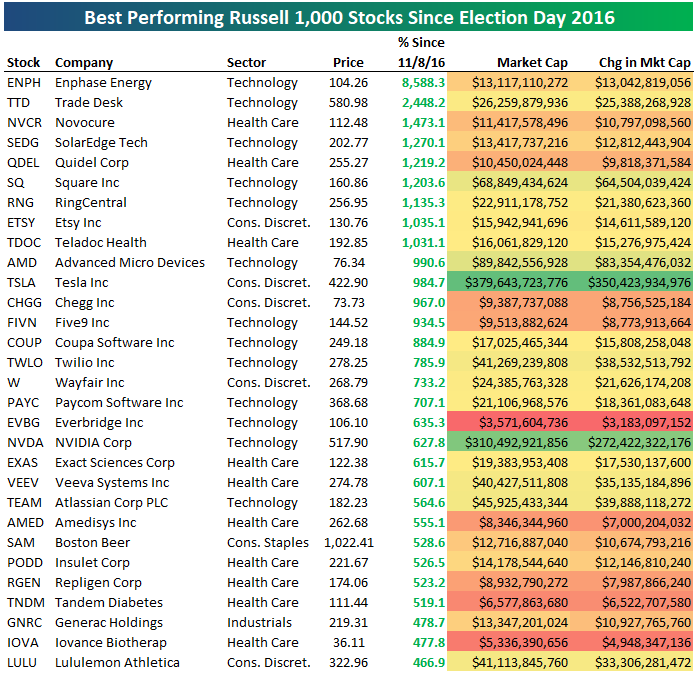
Within the Russell 1,000 in its current form, there are nine stocks that are up 1,000% or more since Election Day 2016, with Enphase Energy (ENPH) at the top with a gain of 8,590%. Trade Desk (TTD) is up the second most at +2,448%, followed by Novocure (NVCR), SolarEdge Tech (SEDG), and Quidel (QDEL). Square (SQ) ranks sixth with a gain of 1,203%. Other notables on the list of big winners since Trump was elected include Etsy (ETSY), Teladoc (TDOC), Tesla (TSLA), NVIDIA (NVDA), Atlassian (TEAM), Boston Beer (SAM), and Lululemon (LULU).
In terms of market cap gains for individual stocks, the numbers below are quite eye-popping. Apple (AAPL) has gained the most in market cap since Trump was elected with an increase of $1.257 trillion! Amazingly, both Amazon (AMZN) and Microsoft (MSFT) have added more than $1 trillion in market cap as well. Prior to the last few years, no company was even close to having a $1 trillion market cap, but at this point, AAPL, AMZN, and MSFT have gained that much in the last four years. Click here to view Bespoke’s premium membership options for our best research available.

World Market Caps Since the 2016 Election
In the table below, we show the standings of 35 global stock markets as a percentage of total world stock market cap. The US is still by far the largest stock market, and it is not even close, accounting for over 40% of total world market cap. China is the only other country to make up a double-digit share of world market cap. For the US, its share of global market cap has grown 1.55 percentage points since the start of the year. Only China has gained a larger share in 2020, rising 2.78 percentage points.
With the election underway, we also wanted to take a look at how this has changed during President Trump’s tenure. As shown, just like this year, since the last election, world market cap has consolidated into the US and China. Back in November of 2016, the US and China accounted for 36.53% and 10.21%, respectively, compared to 41.07% and 11.22% today. For the US, that 4.5 percentage point gain in share of world market cap is by far the largest, and China’s gain was actually not the runner up. Saudi Arabia holds that spot with a share that has risen over 2 percentage points. That outsized gain is thanks to the IPO of Saudi Aramco, one of the world’s largest companies, just under one year ago. On the other hand, the UK and Japan have lost disproportionately large shares in the same time frame. Click here to view Bespoke’s premium membership options for our best research available.
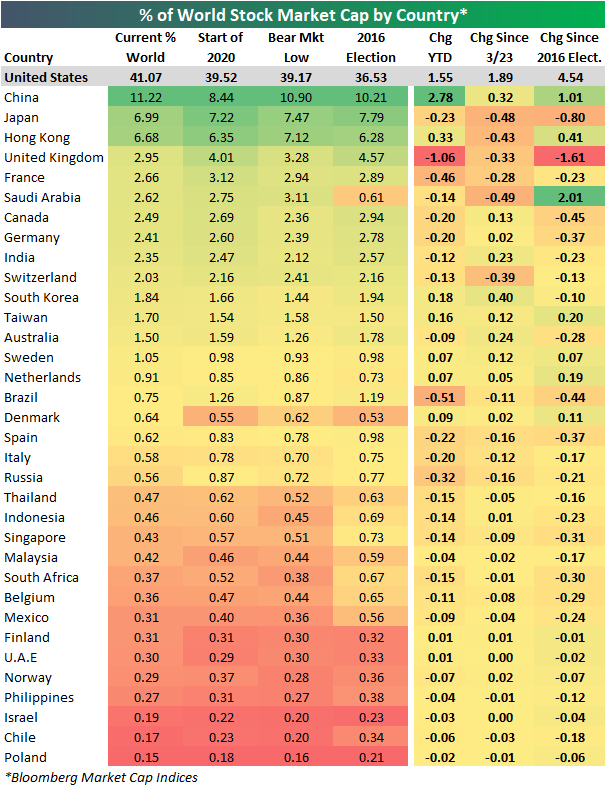

Chart of the Day – Years Like 2020 – The Final Stretch
Eurozone’s Late October Surprise
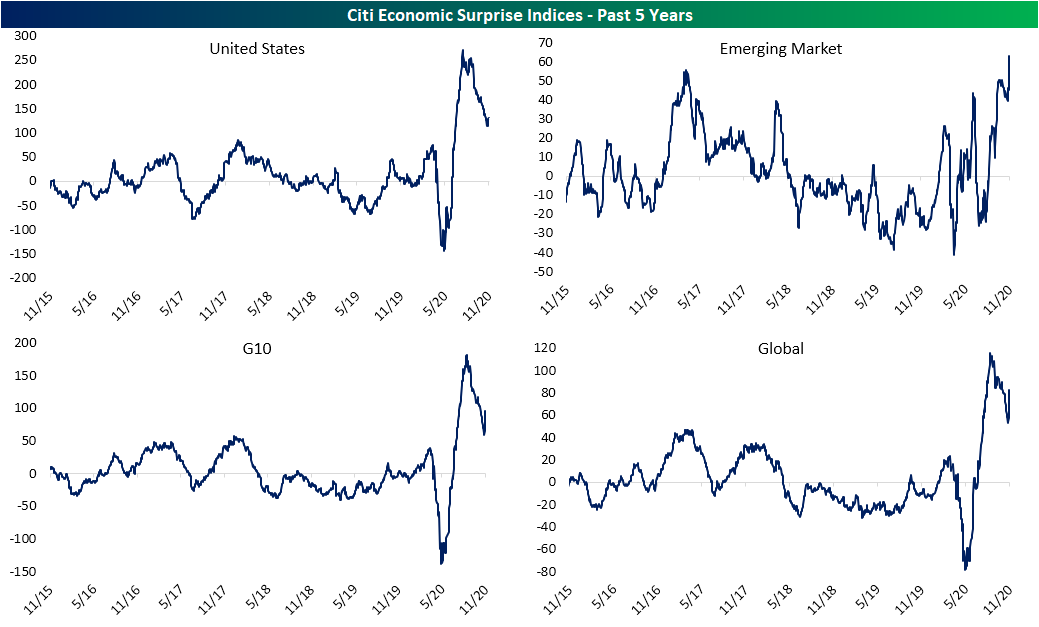
As we noted last week, while earnings beat rates are historically high, economic data is still consistently coming in better than forecasts, but the beats are not as dramatic as they were in the spring/early summer. In the charts below, we show the Citi Economic Surprise Indices for the US and some other regions of the world. Higher readings point to data being better than forecasts and vice versa. At current levels, the US index is down significantly from its July highs and continues to head lower, but it is still well above any readings seen prior to the pandemic. Meanwhile, Emerging Markets data never spiked in the same way the US did, but it has been on the rise recently reaching its highest level in over a decade in the past few days. Of all daily readings, there have only been five other days that the index was higher than Friday’s reading of 63.1. For G10 countries and the global index, trends more closely resemble the US with one caveat. Late last week the indices saw another big turn higher.

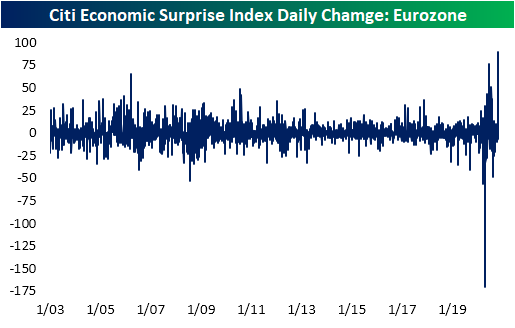
The reason for that jump was the Eurozone. As shown in the charts below, over the past few months the index was headed lower approaching zero, meaning the region’s economic data was not beating forecasts in the same way that the rest of the world has. But that is not so much the case now thanks to a big beat for GDP last Friday which likely holds a massive weight on the index. That resulted in the index to jump by the most ever in a single day. The index rose 89.9 points compared to the historical absolute median daily change of just 3.8 points. That single day move was even larger than any of the readings from the rebound in the more immediate aftermath of the worst days of the pandemic.

Despite deteriorating COVID conditions, new lockdowns, and plenty of other worrisome factors, European equities have seemed to have received a bit of a boost coincident with the turnaround in the economic surprise index. Last week the Stoxx 600 fell below support and out of the past several months’ range, but after reaching extremely oversold levels, the index began to turn higher on Friday. Click here to view Bespoke’s premium membership options for our best research available.

Bespoke Stock Scores — 11/3/20
Bespoke’s Morning Lineup – 11/3/20 – Two Markets
See what’s driving market performance around the world in today’s Morning Lineup. Bespoke’s Morning Lineup is the best way to start your trading day. Read it now by starting a two-week free trial to Bespoke Premium. CLICK HERE to learn more and start your free trial.
I have an idea about voting, how about on every ballot we include “None of the above”. Imagine if you won the election but lost to ‘None of the Above’. Wouldn’t that make you re-think your positions?” – Jesse Ventura
Futures markets are indicating a continuation of the 2016 market script we discussed yesterday, and polls have shown some signs of tightening up in some battleground states. Will there be another Election night surprise this Election Cycle? Stay tuned. Economic data is on the light side today, but there’s a steady pace of earnings after the close.
Be sure to check out today’s Morning Lineup for a rundown of the latest stock-specific news of note, market performance in the US and Europe, key earnings data from the US and Europe, trends related to the COVID-19 outbreak, and much more.

Former North Carolina senator and presidential candidate John Edwards made the theme of ‘Two Americas’ popular in 2004 and 2008 in terms of the United States increasingly becoming a country of haves and have nots. Within the equity market as well, we also see the theme of ‘two markets’ playing out. Starting with the S&P 500, the index bounced off support yesterday after its worst full-week performance leading up to a Presidential election in its history. The S&P 500 already made a lower high in October, so any bounce here that fails to take out the high from October will result in a second lower high.

For the Russell 2000 – an index which heretofore had been underperforming the S&P 500 by a wide margin – the technical picture looks more positive. When the broader market rallied in September and early October, rather than make a lower high, it actually made its second higher high. Then, in the subsequent pullback, it found support at its uptrend off the March lows, making what could turn out to be a higher low. The seemingly constant underperforming Russell 2000 now looks like more of a leader than the S&P 500.

B.I.G. Tips – Top Earnings Season Triple Plays (So Far)
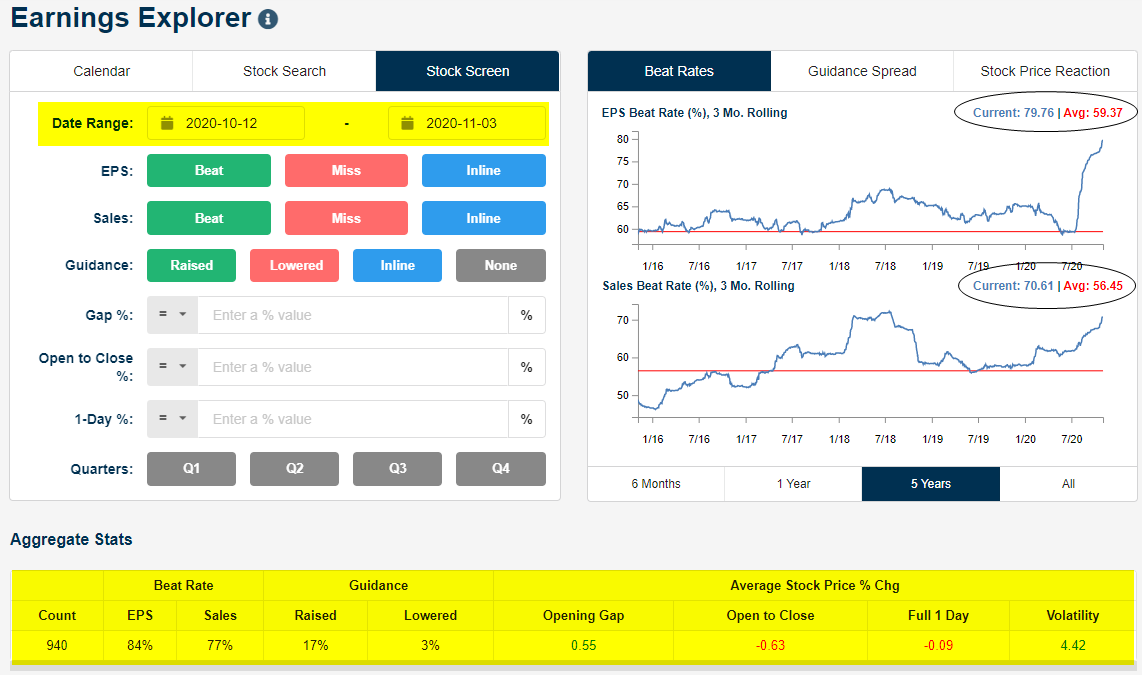
We’ve been banging the drum loudly over the last few weeks highlighting the extremely high earnings beat rates and upside guidance numbers so far this season. Using our Earnings Explorer tool, through yesterday, 940 companies had reported Q3 numbers since the reporting period began on October 12th. Of these, 84% beat consensus analyst EPS estimates while 77% beat consensus revenue estimates. At the same time, 17% of companies have raised forward guidance while just 3% have lowered guidance.
Long-term Bespoke subscribers know how much we like earnings triple plays, but for those that haven’t heard of the term, we came up with it back in the mid-2000s. An earnings triple play is a company that beats EPS estimates, beats revenue estimates, and raises forward guidance all in the same quarterly earnings report. Investopedia.com is one of the best online resources for financial markets education, and they’ve actually given us credit for coining the “triple play” term on their website. We consider triple play stocks to be the cream of the crop of earnings season, and we are constantly finding new long-term buy opportunities from this basket of names each quarter.
This earnings season there have already been a massive number of earnings triple plays. We went through the list of this season’s triple plays to find the ones that currently have the most attractive set-ups. Today we have identified 37 stocks that made the cut. To see these names, simply start a two-week free trial to Bespoke Premium today. Upon sign-up, you’ll unlock our Top Triple Plays report!
Daily Sector Snapshot — 11/2/20
ISM Manufacturing Report and Elections
With the ISM Manufacturing report coming in at the highest level in two years today we wondered whether a strong manufacturing sector ahead of an election has any impact on the results. One would think that surging activity in the Manufacturing sector would be good for a President’s re-election chances. To shed some light on this, the table below shows the election results of each election since 1952 based on which party was in the White House and which party won the election. For each Presidential Election, we also show the level of the October ISM Manufacturing report, its three-month change as well as the distance of the most reading relative to its 52-week range.
Looking at the overall results, we were surprised to find that there’s not that much of a connection between levels of the ISM Manufacturing report before an election and the actual results of the election. Overall, when the party of the President in the Oval in the Oval office stays the same, the median level of the ISM Manufacturing report ahead of the election is 54.1. When the party flips, the median level is modestly lower at 52.0. October’s ISM Manufacturing report was also the third-highest level heading into a Presidential election on record. The only two that were higher were the election of 1972 (67.0) when Nixon defeated McGovern and 1964 (60.7) when Johnson defeated Goldwater, and in both of those elections, the party of the President stayed the same.
Additionally, when the party in control stays the same, the ISM Manufacturing report has been slightly closer to a 52-week high (-4.2) than it has when the parties flip (-5.4). However, the only two times that the ISM Manufacturing report was at a 52-week high leading up to the election were in 1972 and 1980. In 1972, Nixon was re-elected, but in 1980 President Carter lost his re-election bid despite the ISM Manufacturing report being at a 52-week high, and the three-month change was the strongest of any other election since 1952.
While those two metrics would suggest a slight case for a strong ISM Manufacturing report helping the party in power, the median three-month change has actually been worse when the party of the President stays the same (-0.7) versus when there is a change (-0.5). Click here to view Bespoke’s premium membership options for instant access to our research and interactive tools.
