Bespoke’s Weekly Sector Snapshot — 11/12/20
Chart of the Day: Spectacular Sentiment
Claims Keep Grinding Lower
Initial claims have continued to fall with this week marking yet another low of the pandemic. Seasonally adjusted initial jobless claims came in at 709K this week, 21K below expectations. Although that reading is still well above levels from the start of the year, this new post-pandemic low is also now only 14K above the previous pre-pandemic record high of 695K in October of 1982. In other words, claims are still clearly elevated from a historical perspective but are at least closing in on re-entering what has historically been a more normal range.
In spite of this week’s improvement, last week’s reading was revised higher from 751K to 757K, but given that revised number the week over week decline of 48K was the largest since the first week of October. That decline also means claims have also declined in six of the past eight weeks.

On a non-seasonally adjusted basis, claims were likewise lower falling to 723.1K from 743.9K last week. While not as consistent as the seasonally adjusted number, non-seasonally adjusted claims have declined in all but three of the past eight weeks. Those declines are bucking seasonal trends as claims have had a tendency to drift higher at this time of year.

Not only have regular state claims continued to fall but so too have claims for Pandemic Unemployment Assistance (PUA). PUA claims saw the largest week over week drop (-63.8K) since the first week of October (-129.8K) as total PUA claims came in at the lowest level since the first week they were reported on April 17th. Combined with the regular state number, claims sit just above 1 million which is again the lowest of the pandemic.

Continuing claims, which are lagged one week to initial claims, are at the lowest level since the week of March 20th as they came in below 7 million. Continuing claims totaled 6.786 million which was down 436K from last week. With another week over week decline, claims by this measure have now declined in all but four weeks since the peak on May 8th. The current streak of weekly declines has grown to seven weeks long though this week’s drop was the smallest of these past nearly two months.

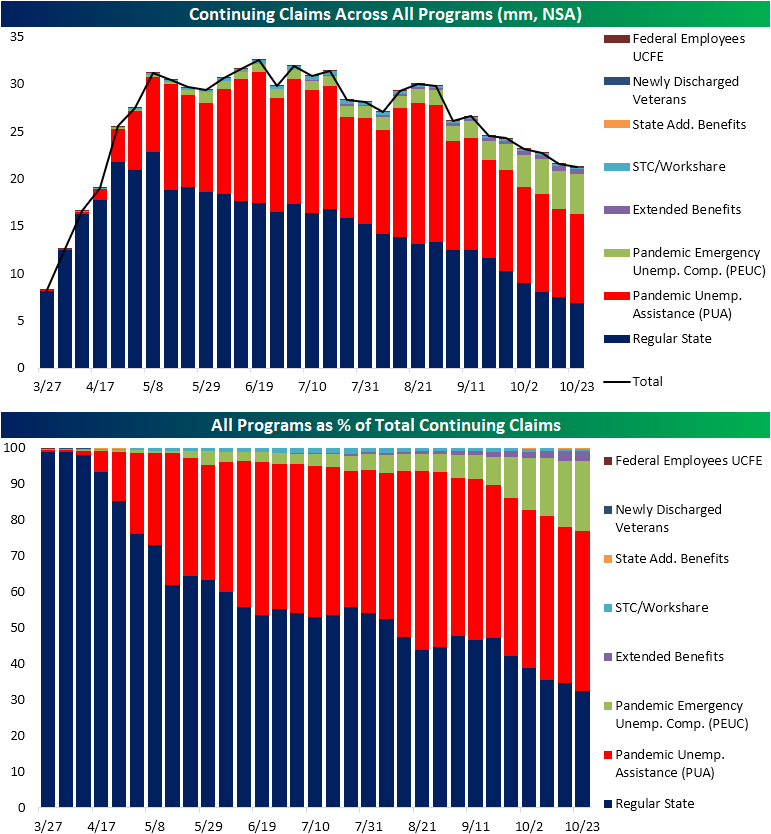
As with initial claims, regular state claims don’t tell the full picture given the several other programs in the unemployment insurance system. In the charts below, we show a breakdown of continuing claims by each program. This is lagged yet another week to regular claims. For the most recent week (October 23rd), total claims across all programs were lower at 21.2 million versus 21.6 million the prior week.
Regular state claims—the largest component—led those declines as PUA—the second largest—claims actually rose 0.1 million. Additionally, the recent trend of growth in extension programs has to an extent continued. PEUC claims, which provides several weeks of additional benefits after the expiration of regular unemployment insurance, rose from 3.98 million to 4.14 million; a new high for the pandemic. Given this, PEUC claims also make up the largest share of total claims yet at 19.5%, up 1 percentage point from the previous week. On the bright side, the extended benefits program—another program for additional weeks of UI once benefits run out—was slightly lower at 0.55 million (2.6% of all claims) compared to 0.57 million the previous week (2.7% of all claims). Overall, claims continue to improve and are broadly around some of the least bad levels of the pandemic, but there is evidence through the growth of PEUC claims that some people have yet to return to works and have now been unemployed for extended periods of time. Click here to view Bespoke’s premium membership options for our best research available.
Bespoke’s Morning Lineup – 11/12/20 – Retrenchment
See what’s driving market performance around the world in today’s Morning Lineup. Bespoke’s Morning Lineup is the best way to start your trading day. Read it now by starting a two-week free trial to Bespoke Premium. CLICK HERE to learn more and start your free trial.
“I was reading in the paper today that Congress wants to replace the dollar bill with a coin. They’ve already done it. It’s called a nickel.” ― Jay Leno
Equity futures are getting hit relatively hard this morning following continued surges in COVID case counts as hospitalizations have now exceeded their peaks from the Summer. In response, states are instituting more restrictions on movement. While the broader market is lower, Nasdaq futures are bucking the trend and still indicated to open in positive territory as investors rotate back into the stay at home stocks.
Against a backdrop of rising COVID cases, economic data today was generally positive. CPI came in weaker than expected, so maybe instead of a nickel, the coin referenced in the quote above should be a dime instead. In terms of jobless claims, both initial and continuing claims came in lower than expected and fell to their lowest levels since the pandemic.
Be sure to check out today’s Morning Lineup for a rundown of the latest stock-specific news of note, economic data out of Europe, trends related to the COVID-19 outbreak, and much more.

The chart below is from the second page of our Morning Lineup and shows where the S&P 500 is trading on a daily basis relative to its 50-day moving average. Yesterday, the S&P 500 closed just shy of levels we consider to be extreme (>2 standard deviations from 50-DMA). This is the same level that the S&P 500’s rally ran out of steam back in early September. While extreme overbought levels hardly mean that a pullback is guaranteed, when the S&P 500 gets to these levels, it’s not uncommon for the market to take at least a short-term pause in order to catch its breath.

Daily Sector Snapshot — 11/11/20
Bitcoin Going for the Gold
Topping the big gains in US equities since the election may sound like a tough task, but bitcoin has been up to the challenge. Since Election Day, bitcoin has now rallied more than 14% taking its price further outside of the upwardly trending range it has traded in for most of the last year. Outside of the last week, the only other time that bitcoin has deviated from its one-year range was at the depths of the COVID crisis back in the spring. The break of the trend back then proved to be short-lived, so we’ll see if this most recent breakout has staying power or ultimately loses steam. For reference, a retracement back into its prior range would take prices back down to $13,000 from the current level of $15,700.

One chart we like to keep tabs on is the ratio of bitcoin to physical gold. Both assets are essentially considered stores of value, so it’s interesting to see how accepting investors become of ‘digital gold’ over time. Obviously, there are a lot of other factors at play that impacts both assets, but the chart below provides a rough approximation. At current levels, one bitcoin will buy about 8.5 ounces of gold. That’s not far from the most recent peak of just under 9.0 back in July 2019. If and when the ratio breaks above that level, the next level to watch would be the record high of 14.8 in December 2017. Based on gold’s price now, that would translate to a price of about $27,500.
While there are plenty of arguments to be made in favor of the long-term prospects for bitcoin, we would note that even for a volatile asset like bitcoin, the rally of the last week or so has been on the extreme side. Just last week the ratio between bitcoin and gold was around 7.5, but in the span of a week, one bitcoin will buy once ounce more gold than it did just last week. Click here to view Bespoke’s premium membership options and sign up for a free trial.

Mortgage Purchases Decline Barely Making a Dent
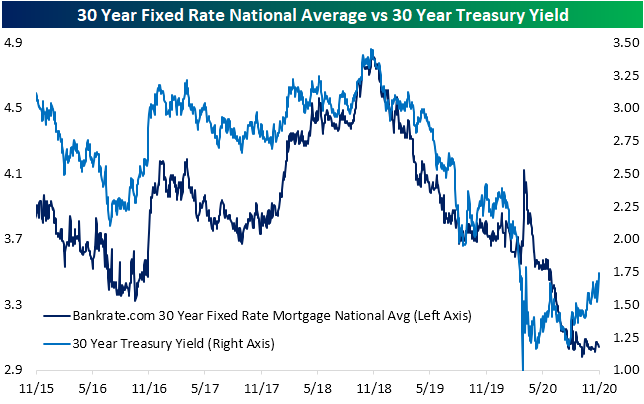
Rates have been on the rise over the past few months with the 30 year Treasury yield now hovering around its highest levels since March. Despite that general rise in rates, the 30-year national average for a fixed-rate mortgage has remained fairly stable without any significant uptick. The national average is currently at 3.04% which is basically in line with the average over the past three months.
Despite mortgage rates remaining relatively stable, there has been a downward move in purchase applications in recent weeks. Released this morning, the MBA’s weekly reading on purchases fell 2.56% week over week to the lowest level since May. This week also marked the sixth time in the past seven weeks that the seasonally adjusted purchase index has fallen. Despite this, that move lower since the peak in September has barely made a dent on a longer time horizon.

Those declines in the seasonally adjusted index come during what is typically one of the weaker times of the year for purchase activity. As shown in the charts below, the second half of the year typically sees purchases fall into year’s end. Those seasonal patterns are still very much holding true this year, though, purchases are still running well above the levels of the comparable weeks of the past decade and the annual peak (blue dot) came several weeks after what has typically been the norm.

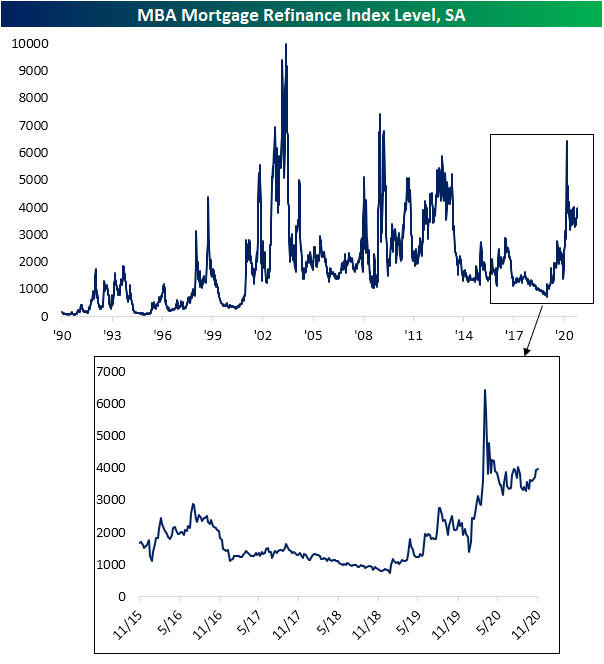
Although purchases have been on the decline from what were very strong levels, refinancing activity has held up well. The Refinance Index rose for a fourth week in a row this week as it reached its highest level since early August. Click here to view Bespoke’s premium membership options for our best research available.
Foreclosures and Delinquencies Down
In an earlier post, we noted how data from the Mortgage Banker’s Association has shown that although purchase activity has been on the decline in recent weeks, activity remains at strong levels. Elsewhere in MBA data released this week, yesterday the group put out delinquency and foreclosure figures for the third quarter. Delinquencies improved in the third quarter with the rate falling from a nearly decade high of 8.22% to 7.65%. That decline is consistent with the delinquency rate from Black Knight which showed delinquencies fall from 6.88% in August to 6.66% in September. The MBA also released their quarterly reading on foreclosures. As we have noted in the past with the equivalent Black Knight data, moratoriums and other freezes have led the foreclosure rate to continue to fall to fresh lows. The MBA’s reading, which goes further back, fell to 0.59% in the third quarter; the lowest reading since 1982.
Additionally, the MBA breaks down their data by region. The Northeast and the South face the highest share of delinquencies at 8.61% and 8.59%, respectively. The rates for the North Central and West are a couple of percentage points lower at 6.82% and 6.1%, respectively. Regardless of these differences across regions, the picture is generally the same as the national rate: delinquencies have ticked lower but remain at some of the highest levels of the past several years. Click here to view Bespoke’s premium membership options for our best research available.
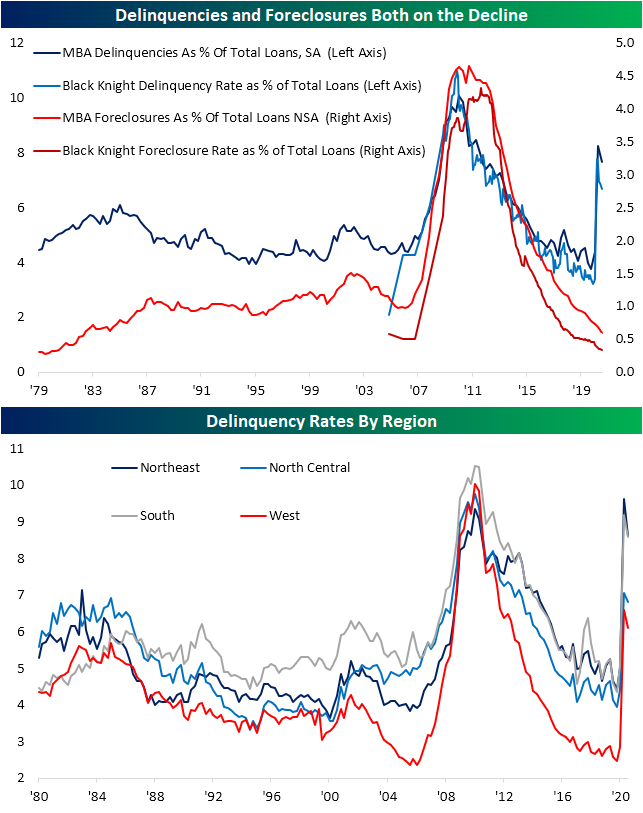
Chart of the Day: Smokestacks, Stuff, and Piggy Banks Lead the Way
Bespoke’s Morning Lineup – 11/11/20 – Making Another Run For Highs
See what’s driving market performance around the world in today’s Morning Lineup. Bespoke’s Morning Lineup is the best way to start your trading day. Read it now by starting a two-week free trial to Bespoke Premium. CLICK HERE to learn more and start your free trial.
“Honor to the soldier and sailor everywhere, who bravely bears his country’s cause. Honor, also, to the citizen who cares for his brother in the field and serves, as he best can, the same cause.” – Abraham Lincoln
Happy Veterans Day. The bond market is closed today, but equity markets are open. With the holiday, though, there is no economic data on the calendar and the earnings schedule is on the light side. Futures are trading higher and for the first time this week, the Nasdaq is actually leading the gains.
Be sure to check out today’s Morning Lineup for a rundown of the latest stock-specific news of note, economic data out of Japan, trends related to the COVID-19 outbreak, and much more.
On Monday, the S&P 500 spent much of the day in record territory, but a late-day decline pushed the index back below its early September high. Yesterday, the index hung in right below those highs setting the stage today for another run at a new closing high. As far as a record intraday high is concerned, those levels won’t be coming into play at the open.
