DJIA 1,000 Point Thresholds
What a wild year 2020 has been! With the DJIA closing above 30,000 today, it was the second first-time upside break of a 1,000 point threshold this year. While there have only been two new upside crosses of 1,000 point thresholds, due to the sharp pullback in March from the pandemic that briefly took the DJIA below 19,000 on a closing basis, there have actually been 12 different upside 1,000 point thresholds at some point in the year.
The table below lists the first time that the DJIA closed above each 1,000 point threshold in its history along with the total number of times the index has crossed that level on a closing basis throughout history. The thousand point level that has seen the most crosses on a closing basis was 11,000 (87 crosses) while 10,000 ranks second at 67.
Obviously, the higher the DJIA goes, the less impactful a move of 1,000 points becomes. At current levels, 1,000 points represents just 3.3%, which is really nothing more than a very bad day in the market. Given the diminishing impact of 1,000 points in the DJIA these days, their significance declines. Even still, the twelve new 1,000-point crosses since the 2016 election has given the President (who has publicly discussed the stock market more than any other President in history) plenty of ammunition to tweet about. Click here to see Bespoke’s premium membership options and start a free trial for instant access to our research and interactive tools.

Bespoke Stock Scores — 11/24/20
Richmond Manufacturing Taking a Rest
After a record high of 29 last month, the Richmond Fed’s monthly reading on the manufacturing sector was expected to decline. Rather than the drop to 20 that was forecasted, this month’s decline left the index even lower at 15. The 14-point month-over-month decline is the largest since the spring and tied January of 1999 and April of 2004 for the sixth-largest monthly decline in the index’s history. Considering that historically large decline is coming off the record high, though, the November reading is still consistent with further improvements in the district’s manufacturing sector just at a decelerated rate from October.

Given the large decline in the headline index experienced, breadth in this month’s report was notably weak. Across the 17 different sub-indices, all but four turned lower this month. As shown in the table below, similar to the composite reading, some of those declines were in the bottom 5% of all month over month changes on record for those respective indices. Granted, for several indices, those large declines come from historically elevated levels. As for those indices that managed to avoid a decline, Service Expenditures went unchanged, Raw Material Inventory declines decelerated, and prices paid and received both rose. Again though, the bulk of these readings were still indicative of expansionary activity but at a slower rate than the prior month.

While current conditions broadly showed deceleration, expectations were more optimistic. There were still a handful of indices for future expectations that declined this month—with those for Finished Good Inventories, Wages, and Availability of Skills the most significant decliners—but generally speaking outlook has continued to improve.

While still consistent with gains in new orders, the growth rate moderated significantly in November as the index dropped 20 points from a near-record high of 32 down to 12. Whereas the decline in November resulted in most other indices staying at the high end of their historical ranges, new orders is less elevated from a historical perspective only in the 73rd percentile. Similarly, the backlog of orders continues to grow but at a slower rate. Granted, the deceleration of order backlogs was much smaller than new orders in November as the index only dropped 3 points down to 11 which is still in the upper decile of all readings.

Given orders are still growing, inventories continue to be drawn upon at a rapid rate. In terms of raw material inventories, this month saw a contraction for just a fourth time in the history of the survey. Three of those contractionary readings have come from the past three months with last month’s reading a record low. Finished good inventories on the other hand are being drawn upon at a more rapid rate. That index fell 5 points this month to a record low of -7.

Other than the indices for inventories, those covering expenditures are the other indices that remain at historically low levels. This month saw sizable declines for Capital Expenditures and Equipment and Software Expenditures with the reading of the former consistent with more firms reducing spending rather than increasing. In other words, broadly speaking companies are not increasing spending on capital like they were a few months ago.

While that side of the production function has weakened, employment metrics are a bit healthier. As with the rest of the survey this month, these readings were consistent with decelerations, but overall manufacturing firms continue to increase hiring, wages, and workweek while they also report a lack of workers with in-demand skills.

Not only are wages rising but so too are Prices Paid and Prices Received with the former outpacing the latter. Click here to view Bespoke’s premium membership options for our best research available.

Bespoke CNBC Appearance (11/24)
Bespoke co-founder Paul Hickey appeared on CNBC’s Squawk Box to discuss the current market backdrop and some of our views on factors that will impact the market going forward. To view the segment, please click on the image below.
Chart of the Day: Home Prices Explode
Seasonally Low Volumes
Due to the Thanksgiving holiday, it is a shortened trading week with no trading occurring Thursday and an early close on Friday. As a result, trading volumes are bound to be light this week. In the table below we show the average volume in SPY volume versus its 50-DMA for each calendar day of the year since SPY began trading in the early 1990s. As shown in the bottom-most row, whereas the months in the first quarter of the year and October have been seen the most above-average volumes (relative to the 50-DMA), the year tends to close out on relatively muted volumes. In November and December, volumes have averaged anywhere between 4.57% and 5.91% below the 50-DMA. In other words, investors historically have been the most active at the start of the year, ramping up activity again in October before taking a step back around the holidays.
As previously mentioned, volumes in November are notably weak and the time surrounding Thanksgiving is no exception. Thanksgiving can be anytime from November 22nd through the 28th, and as highlighted below, these are some of the days with the lowest volumes of the year. Similarly, the days surrounding Christmas and leading up to New Year’s have been the period of weakest volumes of the year.

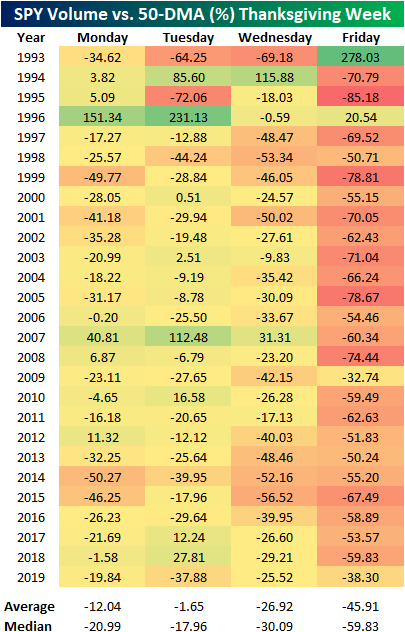
Some of these weak volumes account for simply less time with the market open given the half-days the day after Thanksgiving and on Christmas Eve, but even still, these are both generally quiet times for the market. In the table below, we show a more granular look with volumes versus their 50-DMA during Thanksgiving week. As shown, since 1993 when SPY began trading, less than a fifth of days during the week of Thanksgiving have seen volumes that were above the 50-DMA. While Monday and Wednesday see significantly smaller volumes, Friday’s shortened sessions understandably result in volumes being less than half what is the norm. We’d also note that the much stronger than average volume in SPY on the Friday after Thanksgiving in 1993 was partially a result fo the fact that it was the first year of the ETFs existence and it wasn’t nearly as ubiquitous of a trading tool as it quickly became in subsequent years. Click here to view Bespoke’s premium membership options for our best research available.
Consumer Confidence Falls More Than Expected
Consumer Confidence for the month of November showed a larger than expected decline falling from October’s upwardly revised reading of 101.4 down to 96.1. Economists had been forecasting a more modest drop to 98.0. Unlike many other indicators which have really seen meaningful bounces off their COVID lows, Consumer Confidence isn’t one of them.
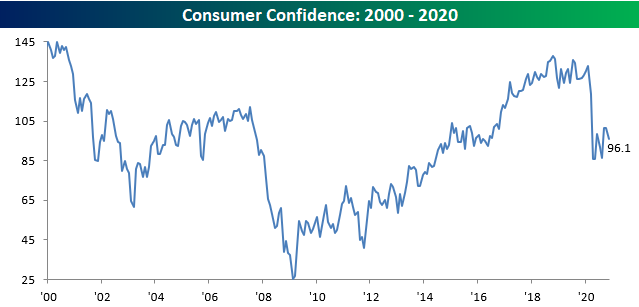
Breaking down confidence levels by both Present Conditions and Expectations, sentiment towards the current state of affairs declined slightly falling from 106.2 down to 105.9. Expectations, on the other hand, saw a more significant decline falling below 90 and less than three points from the low back in August. While the Present Situation index understandably saw a sharp drop at the onset of COVID, the Expectations Index had already started trending lower in late 2018 and has continued that trend right on through the pandemic.

One reason consumer sentiment has been slow to improve is that the employment picture remains uncertain. The Jobs Plentiful index remained unchanged at 26.7 in November. That’s well off the low of 16.3 in March but still far from February’s reading of 46.5 let alone the high of 50.3 in August 2019. Click here to see Bespoke’s premium membership options and start a free trial for instant access to our research and interactive tools.

Bespoke’s Morning Lineup – 11/24/20 – Moving Along
See what’s driving market performance around the world in today’s Morning Lineup. Bespoke’s Morning Lineup is the best way to start your trading day. Read it now by starting a two-week free trial to Bespoke Premium. CLICK HERE to learn more and start your free trial.
“Things are not always what they seem; the first appearance deceives many; the intelligence of a few perceives what has been carefully hidden.” – Phaedrus
In yesterday’s Chart of the Day (“Monday Night is Bull Time“), we noted that when you look at historical market returns based on after-hours and regular hours performance and then further break down those returns by the day of the week, the best time to be long the market has historically been from the close on Monday to the open on Tuesday. There’s still an hour left until the opening bell, but based on where futures are trading this morning, that strategy appears to have worked last night.
The catalyst for this morning’s move in futures is news that while he has yet to concede, the President instructed GSA to allow for the beginning of the transition process. Global equities around the world have also been rallying with a general risk-on sentiment, and in Germany, Q3 GDP showed a stronger than expected bounce from Q2’s plunge. On a side note, Germany’s benchmark DAX index will also be expanded from 30 to 40 companies.
Be sure to check out today’s Morning Lineup for a rundown of the latest stock-specific news of note, the Nikkei’s surge to multi-decade highs, European economic data, trends related to the COVID-19 outbreak, and much more.
Also, we had a segment on CNBC earlier this morning discussing the market’s current backdrop and what to expect going forward. Give it a watch (CNBC Interview – 11/24/20) if you have the time.

With COVID cases surging throughout the country, it has been surprising for traders and investors to see the stocks that originally benefitted the most from COVID basically flatlining after their surge from the March lows through late Summer. The chart below shows the performance of our “Stocks For the COVID Economy” basket since the start of March. The basket’s performance has basically been moving sideways for the last three months after its late Spring/Summer surge.

On a relative strength basis versus the S&P 500, COVID stocks steadily outperformed the S&P 500 right up until October, but just as case counts surged, the COVID stocks fell off a cliff relative to the S&P 500 (chart below). The assumption here was that despite the third wave, investors were looking past the bad news (in the present) and forward to the Spring when case counts would likely decline and vaccines would be rolling out. Ironically, though, Pfizer’s (PFE) vaccine announcement on 11/9 represented what has been a short-term low for the relative strength of the COVID stocks versus the S&P 500. In fact, since the close on 11/9 (a day when the COVID stocks underperformed the S&P 500 by a wide margin), the S&P 500 is up less than 1% while the average return of the COVID stocks is a gain of 4.6%. Just as with a lot of other areas of life, things are not always as they seem.
