Bespoke’s Weekly Sector Snapshot — 11/27/20
Home Prices Surge Across the Country
The S&P/Case-Shiller home price indices were updated (through September) recently, and below we provide a number of tables and charts breaking down the data. As shown in the table below, we’ve seen a huge surge in home prices pretty much across the country on both a month-over-month and year-over-year basis. Phoenix, San Diego, Boston, and New York saw the biggest month-over-month jump in prices, while Phoenix, Seattle, and San Diego are up the most year-over-year. At the national level, home prices are now up just under 7% year-over-year.

The chart below shows where home prices are now versus their low points at the depth of the housing bust during the mid to late 2000s. Nationally, prices are now up ~70% from their lows, while five cities are up more than 100% — San Francisco, Las Vegas, Phoenix, Seattle, and Portland. San Diego, Atlanta, and Denver are just a slight uptick away from the 100%+ level as well. At the bottom end of the chart is New York which is up just 34% from its lows.

Along with looking at where home prices are now relative to their prior lows, below we show where prices are versus their highs at the peak of the housing boom of the mid-2000s. Of the 19 cities shown, 13 have now seen home prices eclipse their prior highs. Denver and Dallas are the farthest above their prior highs at 60%+. The six cities that have yet to get back to prior highs are Washington DC, New York, Phoenix, Miami, Chicago, and Las Vegas. Las Vegas is the farthest from its prior highs at -13%.

Below we show home price levels by city using S&P/Case-Shiller’s data. Cities highlighted in green are at new highs. The Tampa area is the most recent to make a new high above its prior peak in 2006. Click here to see Bespoke’s premium membership options and start a free trial for instant access to our research and interactive tools.
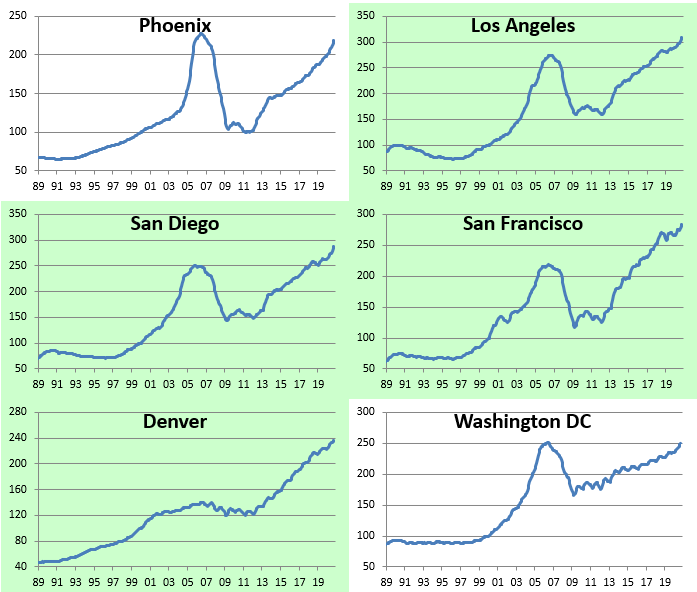
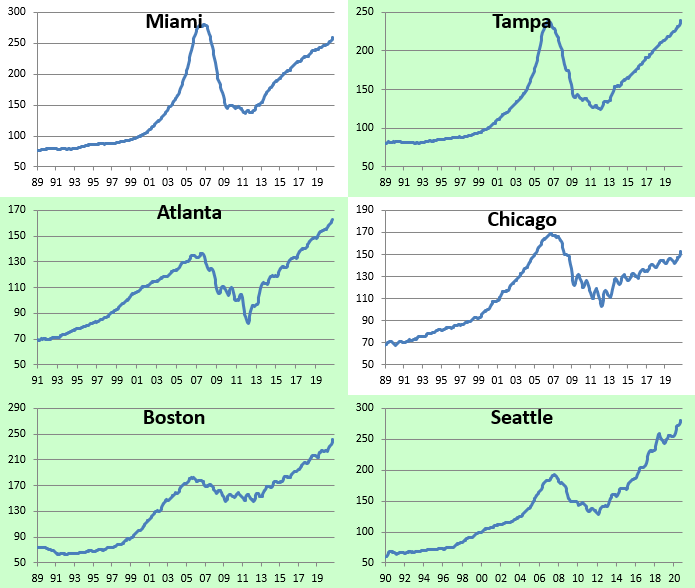
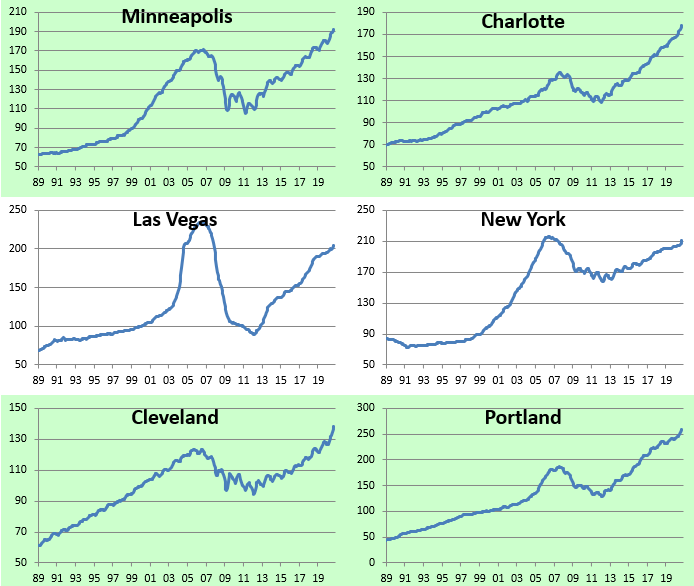

Chart of the Day: APAC Breaks Out
Bespoke’s Morning Lineup – 11/27/20 – Tap Tap Tap
See what’s driving market performance around the world in today’s Morning Lineup. Bespoke’s Morning Lineup is the best way to start your trading day. Read it now by starting a two-week free trial to Bespoke Premium. CLICK HERE to learn more and start your free trial.
“I love to talk about nothing. It’s the only thing I know anything about.” – Oscar Wilde
Is this thing on? Just in case there’s anyone out there this morning, US equity futures are trading modestly higher this morning as trading resumes for three and a half hours before the weekend. Newsflow in US markets is incredibly quiet this morning with nothing in the way of economic data or earnings reports and very little in the way of analyst actions or corporate headlines to speak of.
Be sure to check out today’s Morning Lineup for updates on the latest market news and events, economic data out of Europe, an update on the latest national and international COVID trends, and much more.

Of all the financial assets in the world, one that never sleeps is bitcoin. And while you were enjoying your turkey yesterday, bitcoin was getting pummeled with prices declining just under 10%. Even after that large of a drop, though, bitcoin currently trades where it was in mid-November and still remains well above its 200-DMA and above the up-trending channel it broke out of at the start of November. Would you believe that even after yesterday’s takedown, bitcoin prices are still up over 20% MTD?

Declines of yesterday’s magnitude aren’t particularly out of the ordinary throughout bitcoin’s history. This year alone, there have been two other one-day declines of a larger magnitude, and since the start of 2017, there have been 24 larger one-day drops.

Daily Sector Snapshot — 11/25/20
Most and Least Heavily Shorted Stocks in the S&P 500
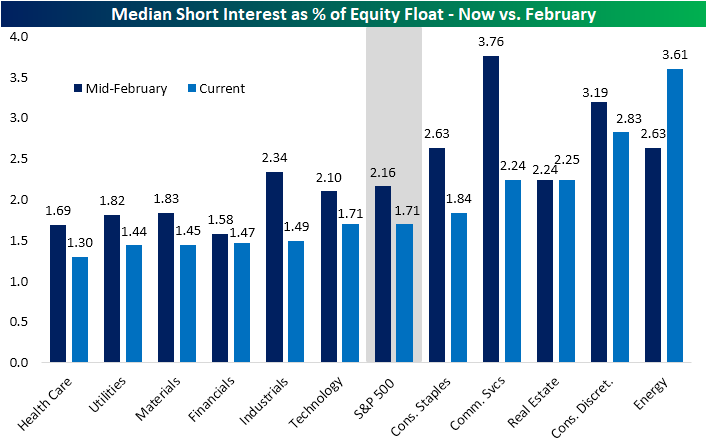
Over the past several months, short interest has gradually headed lower. On a median basis, short interest as a percentage of float for stocks in the S&P 500 is just 1.71%. That compares to 2.16% in mid-February, just a few days below the equity market’s peak prior to the bear market. On a sector basis, short interest as a percentage of the float is generally lower for almost every sector now than it was back in February. For some sectors like Industrials and Communication Services, the differences between now and then are dramatic. But short interest has not declined for every sector. Both the Real Estate and Energy sectors currently have higher median short interest readings than they did earlier this year, and in the Energy sector, the median short interest has increased nearly a full percentage point.
Despite the Energy sector boasting the highest median reading, on an individual stock basis, not a single Energy name finds itself on the list of the 25 S&P 500 stocks with the highest short interest. In fact, the Energy stock with the most elevated reading is Marathon Oil (MRO) at just 6.7%; which ranks 42nd in the S&P 500. While the beaten-down sector does not have any representation in the top 25 list, the list is mostly comprised of companies that have similarly been battered by COVID-19. Stocks related to the reopening trade like travel, airlines, and retail dominate this list. While these high readings of short interest indicate a large number of investors betting against these names, from a contrarian perspective, they are names that could be susceptible to a short squeeze.
Looking at the inverse, most of the 25 stocks in the S&P 500 with the lowest short interest as a percentage of float are made up of stocks that have held up better this year. There are some big large-cap names like Apple (AAPL) and Microsoft (MSFT) as well as some names that have seen their business boom since the pandemic began such as Home Depot (HD) and Costco (COST). The sector with the lowest median short interest as a percent of float, Health Care, is also well represented with 8 of the 25 stocks finding their way onto the list. Click here to view Bespoke’s premium membership options for our best research available.

Chart of the Day – First Impressions. Do They Matter?
A Month to Be Thankful For
Heading into today with just three trading days left in November, the average Russell 1,000 stock was up 17.44% month to date. As shown below, not one of the five largest stocks is up even close to 17% on the month. For a market that had recently been driven higher in large part because of the five mega-cap Tech names, November has seen the mega-caps stall a bit while the rest of the market has seen broad participation. This is the type of breadth that market bulls have been waiting and hoping for.
Of the 35 largest stocks in the Russell 1,000, Tesla (TSLA) is up the most so far this month with a gain of 43%. The other big winners include Chevron (CVX), JP Morgan (JPM), Bank of America (BAC), Disney (DIS), and Comcast (CMCSA). Not one stock in the top 35 is down on the month, but the ones that are up the least are Netflix (NFLX), Procter & Gamble (PG), Amazon (AMZN), and Home Depot (HD).

Looking at sectors, the average Energy stock in the Russell 1,000 is up 46% month-to-date but still down 27% year-to-date. Three other sectors have seen their stocks average MTD gains of more than 20%: Financials, Industrials, and Real Estate. Stocks in the Health Care and Utilities sectors are up the least on an average basis this month, but even these underperformers are still up more than 5%.

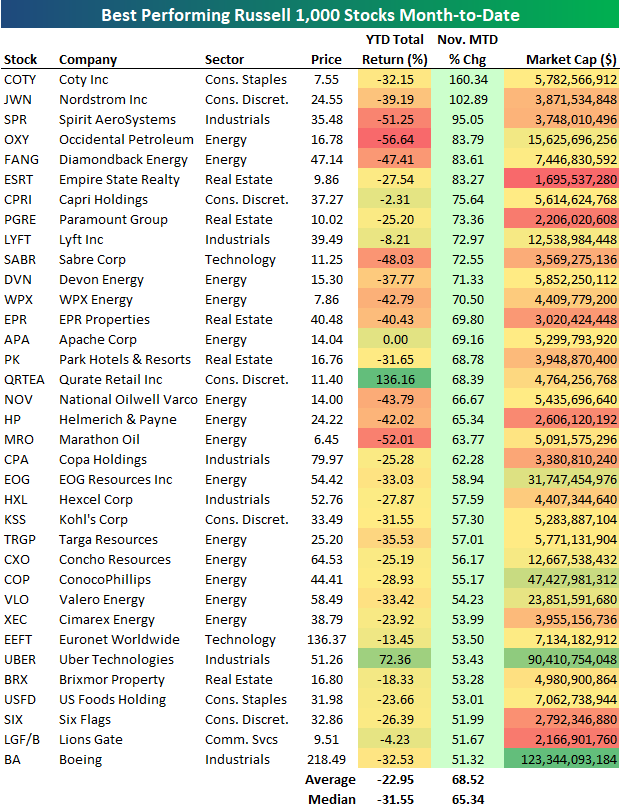
There are 37 stocks in the Russell 1,000 up more than 50% so far in November. Below is a list of this month’s biggest winners. Coty (COTY) and Nordstrom (JWN) stand out the most with gains of more than 100%, followed by Spirit AeroSystems (SPR), Occidental Petroleum (OXY), Diamondback Energy (FANG), and Empire State Realty (ESRT). The list of biggest winners this month is full of names that got hit hardest by COVID in areas like energy, travel, retail, and real estate. Notably, while these stocks are up an average of 68.5% in November, they’re still down an average of 23% on the year. On a median basis, they’re down even more year-to-date at -31.55%. Click here to see Bespoke’s premium membership options and start a free trial for instant access to our research and interactive tools.
Disappointing Claims But Seasonality a Factor
Initial jobless claims were expected to improve this week, falling from an upwardly revised 748K last week down to 730K. Instead, claims came in worse than expected, rising for a second week in a row totaling 778K. That is the highest level in claims since the week of October 16th. On the bright side, this week’s 30K increase was smaller than last week’s 37K uptick.

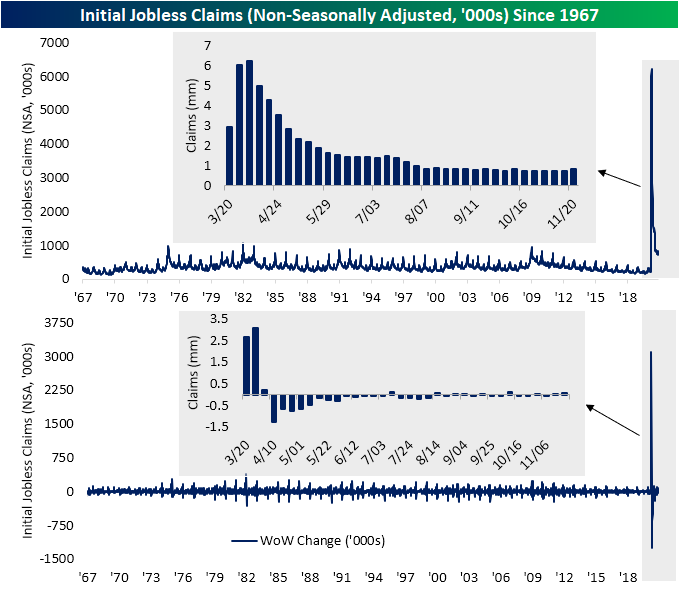
On a non-seasonally adjusted basis, initial jobless claims likewise rose this week, increasing by 78.4K to 827.7K. That is the highest level and the first time claims have come in above 800K since the week of October 9th when claims stood slightly higher at 829.7K. While claims have moved higher over the past couple of weeks, we would note that claims moving higher is the normal seasonal trend for this time of year. In fact, up until the past two weeks claims data has been mostly bucking seasonal norms as they have continued to grind lower. But this week’s 10.46% increase is actually just about inline with the WoW increase that has been historically observed for the same week of the year (47th week) of 10.68%. In other words, the impact of rising COVID cases may have played a role, but seasonality is certainly another factor.
Taking a look at both regular state claims and Pandemic Unemployment Assistance (PUA) claims supports the impact of seasonality. While total claims rose to 1.139 million, the most since October 9th, the bulk of the increase came from regular state claims. PUA claims were actually lower this week, falling down to 311.7K from 319.7K. That is the third-lowest reading of the pandemic, only behind two weeks ago (296.4K) and the first week they were recorded back in April (218.8K).

As for continuing claims which are lagged an additional week to initial jobless claims, despite last week’s uptick in initial claims, there was a net outflow from the unemployment insurance system. Continuing claims fell for a ninth week in a row with this week’s reading of 6.071 million- the lowest reading since March 20th. That is also the second week in a row that claims have come in below the pre-pandemic record of 6.635 million from around the time of the Great Recession.

While regular state claims have improved, taking all programs into account the picture is a bit less rosy. The addition of other programs lags the data yet another week meaning the most recent data is for the week of November 6th. As of then, total continuing claims across all programs rose slightly from 20.494 million to 20.363 million. While higher, that is still below where total claims were two weeks prior. Additionally, the uptick that week mostly came from PUA and PEUC claims as every other program saw declines. With regards to the latter of the two, as we have frequently mentioned in recent weeks, PEUC claims’ share of total claims has continued to rise alongside claims from the Extended Benefits program. That means a growing share of existing continuing claims are extensions. Click here to view Bespoke’s premium membership options for our best research available.

Bespoke’s Morning Lineup – 11/25/20 – Thankful For…
See what’s driving market performance around the world in today’s Morning Lineup. Bespoke’s Morning Lineup is the best way to start your trading day. Read it now by starting a two-week free trial to Bespoke Premium. CLICK HERE to learn more and start your free trial.
“I am grateful for what I am and have. My thanksgiving is perpetual.” – Henry David Thoreau
The market isn’t in much of a good or bad mood this morning as futures are indicated modestly lower. The earnings news we did get overnight was generally positive, and there’s an avalanche of economic data jammed into today ahead of what will be a long holiday weekend for many.
This Thanksgiving isn’t going to be a typical one for most people, but there’s still a lot to be thankful for, so we hope you have a good day regardless. Happy Thanksgiving!
Be sure to check out today’s Morning Lineup for updates on the latest market news and events, economic data out of Asia, an update on the latest national and international COVID trends, and much more.
The holiday season is generally considered a great time of year for equities, but very short-term returns for the market based on seasonality haven’t been particularly strong. As shown in the snapshot from our Seasonality Tool, the S&P 500’s median historical return over the last ten years in the upcoming one-week period has been a gain of 0.24% which is right in the middle of the road compared to all other one-week periods throughout the year. One month later, median returns improve considerably to 1.99% which ranks in the 75th percentile relative to prior periods. Three month returns, however, have been very strong. The S&P 500’s median return of 6.30% in the three month period from today’s close ranks in the 98th percentile of all three-month periods throughout the year.
