The Bespoke Report Newsletter — 3/26/21
This week’s Bespoke Report newsletter is now available for members.

To read the report and access everything else Bespoke’s research platform has to offer, start a two-week free trial to one of our three membership levels. You won’t be disappointed!

Daily Sector Snapshot — 3/26/21
Media & Chinese Education Tech Carried Out On A Stretcher
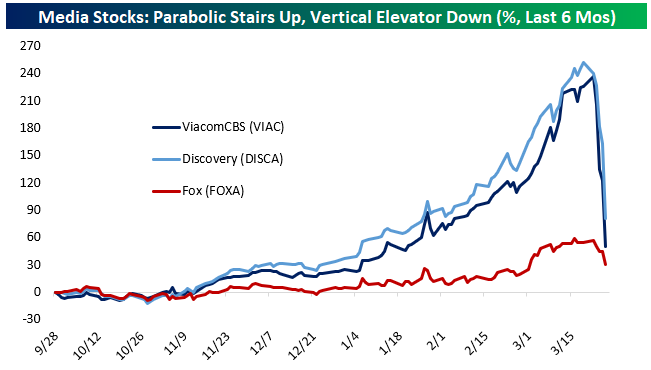
This week we’ve seen a popular long blow up in a way that recalls the mess in GameStop (GME) earlier this year. As shown below, legacy media stocks like ViacomCBS (VIAC) and Discovery (DISCA) went parabolic since November. Fox (FOXA) also benefited, though to a much smaller degree. VIAC and DISCA both tripled in just a few months as hopes of a robust economic recovery boosting ad revenue and, more importantly, the potential for streaming riches similar to Disney (DIS) and its Disney+ platform helped fuel gains. But over the last four days, most of those gains have been incinerated. The catalyst appears to have been a secondary offering from VIAC a few days ago, with $1.7bn of shares sold into the $50bn market cap that existed at the time.
Since that secondary, the stock has been more than cut in half. There have also been rumors of a big, leveraged position by an unnamed fund having its portfolio seized and liquidated by its prime brokers. There have also been huge blocks of stock reported at dealers, with Goldman Sachs (GS) reportedly getting tapped to sell a block equivalent to more than 6% of VIAC’s free float and a second block equivalent to more than 12% of DISCA’s free float. In a reversal of the GME mess, VIAC has 18.5% of its float sold short, while DISCA’s short base is 29.7% of float. This particular blow-up is a win for shorts. Start a two-week free trial to Bespoke Institutional to access all of our analysis and market commentary.
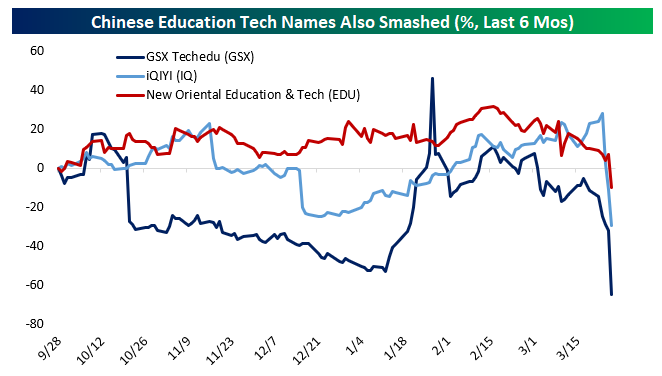
Another similar collapse has been playing out in Chinese education technology stocks listed in the US as ADRs. GSX Techedu (GSX) is down over 50% today, with a block offered by a dealer equivalent to almost 9% of the float. A similarly-sized block relative to float is also reportedly on offer in IQ. These names haven’t seen the same sort of parabolic gains as the media stocks above, but they’re a similar clustered theme that’s getting carried out to end the week.
ETFs Become Increasingly Active
In addition to providing a more liquid alternative to mutual funds, one of the big selling points of ETFs over the years has been the fact that since active management has been so bad on a collective basis, investors are better off settling for ‘market’ returns. This chart using data from Standard and Poors illustrates the point. Going back to 2001, there have only been six years where more than half of all domestic equity mutual funds outperformed the S&P 1500, and there has never been a year where even 60% of them outperformed. At the other extreme, you have years like 2011 and 2014 where less than 20% of funds outperformed.

Given the underperformance of active management over the years, it only makes sense that the vast majority of ETFs on the market have been passive in nature. There are also other factors like there being less of an ability to arbitrage that makes actively managed ETFs less feasible, but in any event, investor demand for passive index-tracking vehicles has been the main driver behind the explosive growth of ETFs.
In more recent years, though, actively managed ETFs have seen a surge in popularity. The chart below summarizes the year that each of the current ~400 actively managed ETFs that trade on US exchanges were launched. What clearly stands out is the fact that more than 30% of all actively managed ETFs were launched in 2020. Using data from ETF.com, we calculated that those 120 ETFs represent more than a third of all ETFs launched in the year.
For an investment vehicle that gained popularity because of its passive nature, the fact that actively managed ETFs have become so popular is noteworthy. Two factors behind their increased popularity stem from the success of the ARK funds, which have seen their assets under management swell to around $50 billion, and fees. Wall Street loves fees and because they offer more analysis behind security selection, actively managed ETFs can justify charging higher fees. For example, weighted based on Assets Under Management, ETFs have an average expense ratio of 0.19% per year. Within the actively managed ETF space, though, the weighted average expense ratio is nearly triple that at 0.54%. This new wave of actively managed ETFs can charge whatever fees they want, but ultimately, performance matters, and depending on how they perform over time will likely play a large role in how popular this area of the ETF space becomes. Start a two-week free trial to Bespoke Institutional to access all of our analysis and market commentary.

Bespoke’s Morning Lineup – 3/26/21 – Rates Remain Temperamental
See what’s driving market performance around the world in today’s Morning Lineup. Bespoke’s Morning Lineup is the best way to start your trading day. Read it now by starting a two-week free trial to Bespoke Premium. CLICK HERE to learn more and start your free trial.
“‘Experience’ is what you got when you didn’t get what you wanted.” – Howard Marks
Futures are indicated mostly higher this morning, although Nasdaq futures have been under pressure as yields on the 10-year rise. It’s been a busy morning of economic data, but so far there have been no major outliers relative to expectations.
Be sure to check out today’s Morning Lineup for updates on the latest market news and events from the US and around the world, including a discussion of Chinese Current Account, Japanese Inflation, German sentiment, the latest US and international COVID trends including our series of charts tracking vaccinations, and much more.

Within some of the major US indices, it’s a mixed picture with respect to their charts heading into the weekend.
The Russell 2000 broke below its 50-DMA moving average for the first time in over four months earlier this week, and while it bounced at support yesterday, it remains in a bit of limbo heading into today as it sits right between support below and its 50-DMA above.
The Nasdaq 100 has been having a much rougher go of it lately. With yields remaining temperamental, QQQ has been bouncing around in a range below its 50-DMA. Yesterday, it made a lower low relative to earlier in the week, so for now it remains in a tenuous position if you’re a bull on the index.
Lastly, while a number of other indices have been under pressure, the S&P 500 continues to chug along. Yesterday, SPY bounced right at support coinciding with its 50-DMA and uptrend. Bulls will want to see some follow-through after yesterday’s bounce, but if the weakness in the QQQ continues, it will be hard for SPY to maintain its immunity.

Bespoke’s Weekly Sector Snapshot — 3/25/21
The Bespoke 50 Top Growth Stocks — 3/25/21
Every Thursday, Bespoke publishes its “Bespoke 50” list of top growth stocks in the Russell 3,000. Our “Bespoke 50” list is made up of the 50 stocks that fit a proprietary growth screen that we created a number of years ago. Since inception in early 2012, the “Bespoke 50” is up 445.8% excluding dividends, commissions, or fees. Over the same period, the Russell 3,000’s total return has been +245.0%. Always remember, though, that past performance is no guarantee of future returns. (Please read below for more info.) To view our “Bespoke 50” list of top growth stocks, please start a two-week trial to either Bespoke Premium or Bespoke Institutional.
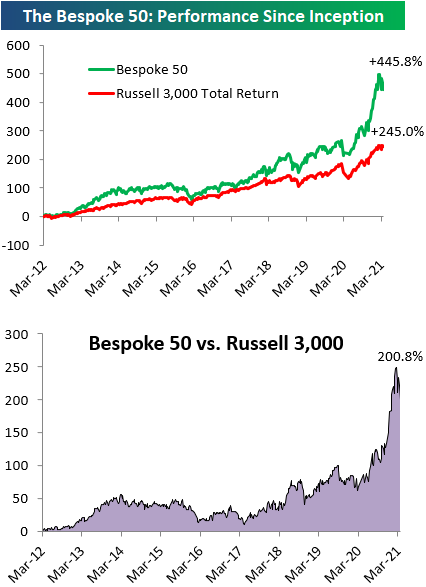
The Bespoke 50 performance chart shown does not represent actual investment results. The Bespoke 50 is updated weekly on Thursday. Performance is based on equally weighting each of the 50 stocks (2% each) and is calculated using each stock’s opening price as of Friday morning each week. Entry prices and exit prices used for stocks that are added or removed from the Bespoke 50 are based on Friday’s opening price. Any potential commissions, fees, or dividends are not included in the performance calculation. Performance tracking for the Bespoke 50 and the Russell 3,000 total return index begins on March 5th, 2012 when the Bespoke 50 was first published. Past performance is not a guarantee of future results. The Bespoke 50 is meant to be an idea generator for investors and not a recommendation to buy or sell any specific securities. It is not personalized advice because it in no way takes into account an investor’s individual needs. As always, investors should conduct their own research when buying or selling individual securities.
Bullish Sentiment Back Above 50% But Is That A Good Thing?
With the NASDAQ has put in a lower high and the Russell 2,000 touched the technical definition of a correction intraday today, sentiment has turned the other cheek. The AAII’s reading on bullish sentiment rose two percentage points moving back above 50% this week. Bullish sentiment is now at its highest level since the week of November 12th.

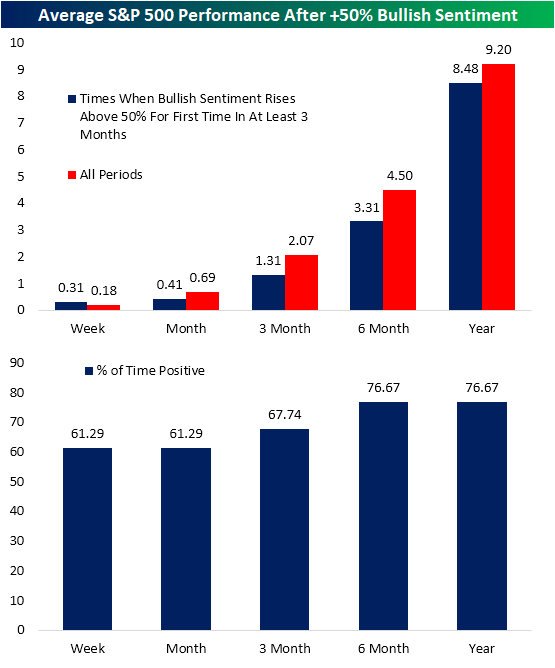
Since the AAII survey began in the late 1980s, there are plenty of instances (191 weeks) in which bullish sentiment has come in above 50%. As shown below, generally higher readings on bullish sentiment have resulted in weaker returns than when sentiment holds a more pessimistic outlook.
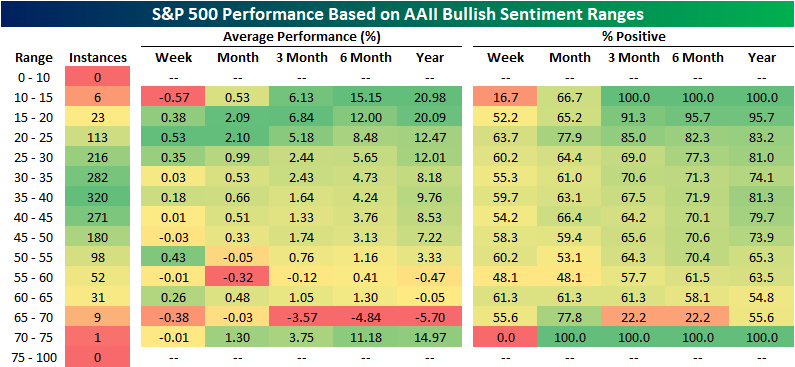
Given this, in the charts below we show the average performance of the S&P 500 in the weeks and months after bullish sentiment comes in above 50% for the first time in at least 3 months. Across those 31 past instances, while the index is frequently higher with positive returns better than three-quarters of the time six and twelve months later, the size of those gains are smaller than the norm. Only the one-week period has managed outperformance versus all periods with a 31 bps gain rather than the 18 bps gain for all other periods.
While a higher number of respondents reported as bullish, only 20.6% reported as bearish. That is the lowest level for bearish sentiment since December 2019 when it was only 0.1 percentage points lower than it is now. That is also the first time that less than a quarter of respondents have reported as bearish for three consecutive weeks since another three-week streak ending in the first week of 2020.

Given the high level in bullish sentiment and low level of bearish sentiment, the bull-bear spread rose back above 30 for the first time since the week of November 12th when it stood slightly higher at 30.97.

While both bullish and bearish sentiment are at notable levels, there was not a very large change in the percentage of respondents reporting as neutral. That reading rose only 1 percentage point to 28.5%. That leaves it right in the middle of its recent range. As recently as the first week of March this reading stood several percentage points higher at 34.4% whereas it is nearly equally as far away from its lows from early January.Start a two-week free trial to Bespoke Institutional to access our interactive economic indicators monitor and much more.

B.I.G. Tips – Activity Search Trends Starting to Bloom
Claims Come In At A New Low for the Pandemic
It took almost a year, but seasonally adjusted initial jobless claims have finally moved back below their pre-pandemic record level of 695K set in October 1982. At the lowest level in a year, this week’s print came in below expectations of 730K at 684K. That was a 97K decrease from last week’s upwardly revised level of 781K and the largest week over week decline since the week of February 19th when claims fell by just 1K more. We would also note that in this week’s release the BLS announced this will be the last week before revisions to the seasonal factors are made meaning next week the series will likely look slightly different as a result of those revisions.

On a non-seasonally adjusted basis, claims likewise improved dramatically. Regular state initial claims fell by just over 100K to 656.8K this week. Not only is that the lowest level for regular state claims in a year, but it was also the third-lowest reading on record for the Pandemic Unemployment Assistance (PUA) Program. The only lower weekly readings in PUA claims occurred in the very first week that they were introduced (April 17th, 2020) and the first week of 2021 when there were some lapses due to the signing of the spending bill. On a combined basis, total initial jobless claims between the two programs fell back below 1 million for the first time of the pandemic. As for the individual states that drove those declines, California, Illinois, and Ohio (which is an unwind of some very elevated levels for the state recently) saw some of the largest declines across both regular state and PUA programs. In regards to just the PUA programs, Indiana and Oregon also were large contributors to that decline.

Continuing claims are lagged one week to initial claims so the most recent print for the week of March 12th would not reflect that big drop in the most recent initial claims data. Nonetheless, seasonally adjusted continuing claims have extended the declines that have consistently come over the past several months. In fact, of the past half-year (26 weeks), there have only been two times that the continuing jobless claims were not lower week over week. This week’s decline marked a tenth consecutive week that claims were lower. Falling to 3.87 million, the current reading is the lowest of the pandemic and is now “only” about 2 million above levels from prior to the start of the pandemic.

Including all auxiliary programs adds an additional week’s lag to the data meaning the most recent data as of the first week of March would again not reflect the big drop in initial claims this week. As of the most recent data for the first week of March, total claims across all programs rose slightly to 18.99 million from 18.253 million at the end of February. That continues to be a somewhat elevated reading relative to the past few months though the recent drops in initial claims could mean that there is certainly potential for improvement on the horizon.
Pandemic Emergency Unemployment Compensation (PEUC) claims were the biggest contributor to that uptick as claims from that program rose 734.69K. While this data predated it, the signing of the American Rescue Plan Act extended this federal program through September after it was supposed to end in mid-March. This program in particular extends benefits once they have expired. That means the increase in continuing claims comes from people who have been long-term unemployed. In fact, of all continuing claims, those from the PEUC program accounted for 29.2% which is a new high for the pandemic. Combined with other extension-type programs like Extended Benefits, that share is also at a new high of almost 35% of all claims. Click here to view Bespoke’s premium membership options for our best research available.

