One of The Strongest Weeks of the Year
While earnings are likely to be a key catalyst over the next few days, from a seasonal perspective, the current week of the year has historically been one of the best. As shown in the snapshot from our Seasonality Tool below, the current week of the year (April 19th through April 26th) has seen the S&P 500 post a median gain of 1.44% over the last ten years. Going out a bit further, the one-month return is only slightly better with a median gain of 1.47%, which is more middling relative to all other one-month periods throughout the year. The same can be said for the 3-month period although it is a stronger period of the year which stands in the top quartile of all three month periods.

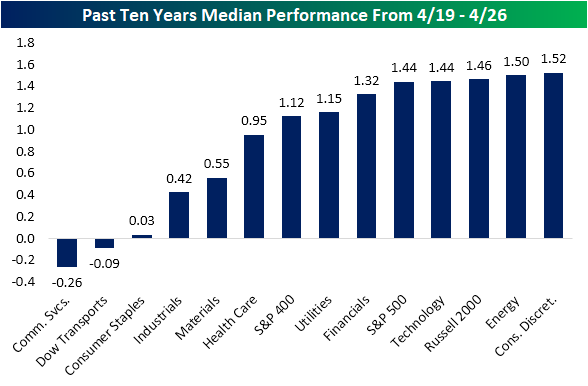
Expanding this beyond just the S&P 500, in the chart below we show the median performance across all sectors and market cap indices for the next week (4/19-4/26) based on the last ten years of trading. As shown, Technology is right in line with the S&P 500 with a 1.44% gain while the small-cap Russell 2,000, the Energy sector, and Consumer Discretionary have notched slightly stronger performance. While mid-caps (S&P 400), Utilities, and Financials have all managed to also typically rise over 1%, there has historically been some weakness from Communication Services and the Dow Transports as both have median declines. Consumer Staples has only marginally moved higher with a 3 bps gain.
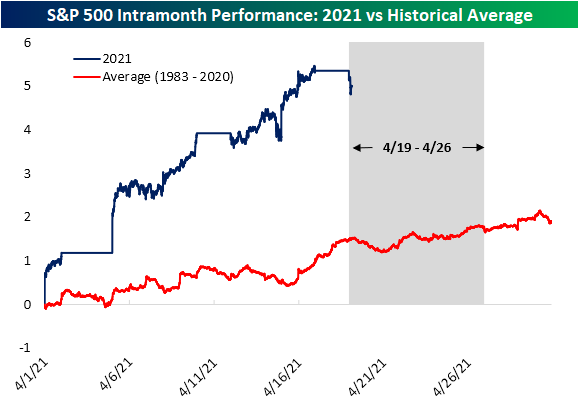
Taking a bit more of a granular look at this period, in the chart below we show the intra-month performance of the S&P 500 so far in April this year as well as a comparison to the historical average for the month of April since 1983. With the S&P 500 already up around 5% on the month, performance thus far is better than the average gain of around 1.5% by this time. Even though the next week has historically been a very strong time of the year from a seasonal perspective, the S&P 500 is starting off trading lower today. But we would note that it is not necessarily unusual. As shown below, even though it has been a strong period, the first couple of days typically have seen the S&P 500 drift lower before reversing higher in a move that typically lasts through the end of the month. Click here to view Bespoke’s premium membership options for our best research available.
Bespoke’s Morning Lineup – 4/19/21 – Another Streak
See what’s driving market performance around the world in today’s Morning Lineup. Bespoke’s Morning Lineup is the best way to start your trading day. Read it now by starting a two-week free trial to Bespoke Premium. CLICK HERE to learn more and start your free trial.
“I look at a streak as I don’t lose – literally.” – Tiger Woods
Futures are lower to start the week, and the economic and earnings calendars are both extremely quiet to start the week. Things will pick up intensely as the week goes on, though, so enjoy the calm while it lasts. After the close today, we’ll get earnings reports from IBM and United Air (UAL).
Read today’s Morning Lineup for a recap of all the major market news and events including a recap of the biggest overnight events including some key earnings reports, German elections, as well as the latest US and international COVID trends including our vaccination trackers, and much more.

Last week we were talking about the market’s ‘can’t lose’ pattern where SPY traded higher from the open to close for thirteen straight days. While that streak ended (for a day) another notable streak we’re tracking is the S&P 500’s consecutive streak of closes in ‘extreme overbought’ territory. Heading into today’s trading, the S&P 500 has closed more than two standard deviations above its 50-DMA for eleven straight days. That ranks as the longest streak of ‘extreme overbought’ readings for the S&P 500 since 2013 and just the 23rd such streak in the post-WWII period. While futures are down this morning, as long as the S&P 500 finishes the day down less than 0.55% the current streak will stretch to a cool dozen.

Bespoke Brunch Reads: 4/18/21
Welcome to Bespoke Brunch Reads — a linkfest of the favorite things we read over the past week. The links are mostly market related, but there are some other interesting subjects covered as well. We hope you enjoy the food for thought as a supplement to the research we provide you during the week.
While you’re here, join Bespoke Premium with a 30-day free trial!
Profiles
This Vegan Billionaire Disrupted the Crypto Markets. Stocks May Be Next. by Alexander Osipovich (WSJ)
The founder of FTX is introducing 24-hours-per-day stock trading, betting markets in anything, and more as he seeks to new markets for his exchange, FTX. [Link; paywall]
Quantum Leap by Akshat Rathi (Bloomberg)
One of the largest battery SPACs has spent a decade chewing through venture capital funding and is still years from a final product, despite being a lynchpin in VW’s plans for electrical vehicles. [Link; soft paywall]
Big Geography
China’s hydropower grab in the Himalayas by Michael Cruickshank (Substack)
A remote valley high in the largest mountain range on earth is the likely site of China’s next massive infrastructure project: the largest dam on the planet. [Link]
Google Earth is now a 3D time machine by Ron Amadeo (Ars Technica)
A new feature will allow users to move backwards in time as much as 20 years in order to see how landscapes are changing. [Link]
International Politics
Notes on the Political Economy of Britain by Matthew Zeitlin (Substack)
A dissection of what makes the UK such a complicated picture in terms of both economics and politics: a heavy reliance on services and a output highly concentrated in and around just one city. [Link]
The Dollar’s Sliding Share in Global Currency Reserves Is a Red Herring by Mike Bird (WSJ)
While the share of the dollar hit a 25 year low as a share of official reserves, driven by increases in the share of reserves held in euros and yen. But those shifts mask important details underpinning the dollar’s still-dominant role in the global financial system. [Link; paywall]
Texas Innovation
Fifty Years Ago a Texan Changed Happy Hour Forever by Patricia Sharpe (Texas Monthly)
Early in the 1970s, a young restauranter in Dallas gave up on blended margs and introduced the first frozen margarita, taking inspiration from 7-11’s ubiquitous Slurpee machines. [Link]
Domino’s, Nuro to begin autonomous pizza deliveries in Houston by Rebecca Bellan (TechCrunch)
An autonomous delivery company will start dropping pizzas off to customers without involving a driver this week in Houston. [Link]
Vaccines
CDC Identifies Small Group of Covid-19 Infections Among Fully Vaccinated Patients by Robbie Whelan (WSJ)
The CDC has been able to identify less than 6,000 COVID cases among the more than 66 million Americans who have been fully vaccinated against the disease. [Link; paywall]
How Long Do Covid-19 Vaccines Provide Immunity? by Sumathi Reddy (WSJ)
Follow-up studies to the initial approvals of COVID vaccines suggest immunity lasts at least six months, and could be significantly longer; unfortunately we won’t know how long the shots ward off the disease until more time has passed from the initial doses. [Link; paywall]
Sports
Pitcher Hope Trautwein Throws A Perfect Game Of All Strikeouts by Chad Campbell (NPR)
A softball hurler from the University of North Texas made history Sunday, striking out the entire opposing side in each at-bat; the feat has never been pulled off in NCAA Division 1 softball history. [Link]
The Pop Warner Offense That Confounded Sean Payton, and What It Says About Offensive Innovation in the NFL by Chris Brown (Grantland)
A Pop Warner coach managed to get the best of an NFL signal caller not once but twice thanks to a throwback offense that dates to the earliest days of the game. [Link]
Personal Finances
Two thirds of adults haven’t used cash in over 12 months by George Iddenden (Charged Retail)
A UK survey found that 64% of UK adults haven’t used physical cash in the past year, driven by the growing use of contactless payments. [Link]
New Investors Discover Tax Pitfalls of Robinhood and Other Trading Apps by Laura Saunders (WSJ)
Free-to-trade equity market apps make it easy to move in and out of positions, but a lot harder to optimize for taxes, which many new traders are finding out the hard way. [Link]
Read Bespoke’s most actionable market research by joining Bespoke Premium today! Get started here.
Have a great weekend!
The Bespoke Report – 4/16/21 – Only One Way To Go With Risks So Low?
Policy stimulus continues to run at full tilt, and has carved off some of the worst possible forward outcomes for the economy and markets. Meanwhile, interest rates have been falling after a meteoric rise in Q1, while the bull market in commodities continues to run. Manufacturing activity gauges are roaring and retail sales are soaring. What does all of this mean for investors looking ahead to the rest of the year given the already-impressive move higher for stocks in 2021?
We discuss in detail along with an earnings round-up, review of recent economic data, a look at housing, and more in this week’s Bespoke Report.
This week’s Bespoke Report newsletter is now available for members.

To read the report and access everything else Bespoke’s research platform has to offer, start a two-week free trial to one of our three membership levels. You won’t be disappointed!

Daily Sector Snapshot — 4/16/21
March Housing Data Rebounds
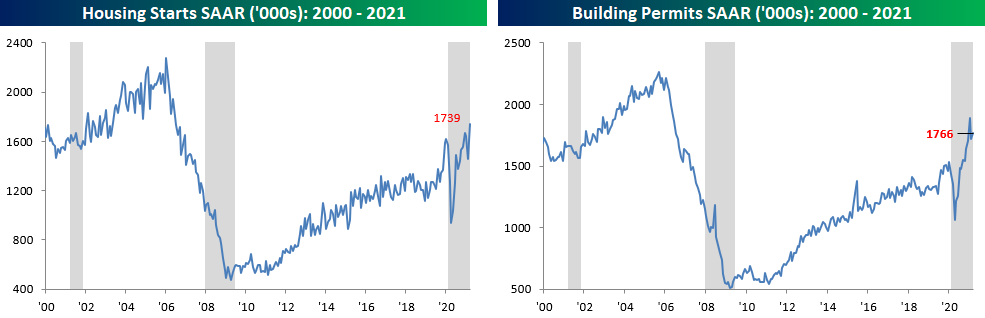
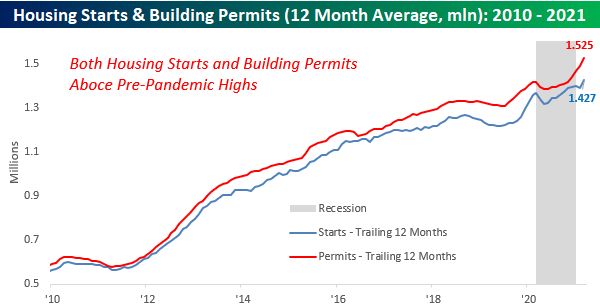
Data on Housing Starts and Building Permits for the month of March came in better than expected on Friday morning. That provided some relief to the concerns that surfaced from February’s weak and weather-impacted report. With March’s rebound, Housing Starts are now back at their highest levels since 2007. Building Permits still remain below January’s peak but also managed to rebound.
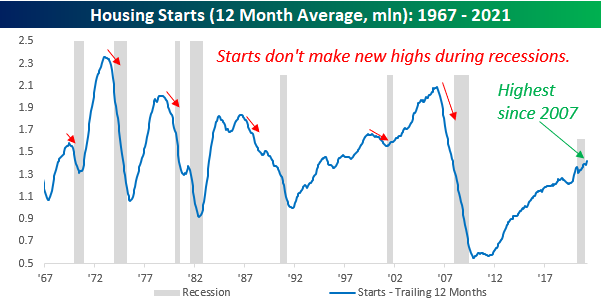
We pay a lot of attention to trends in residential real estate because it is such a large part of the US economy, and therefore has done a good job tracking trends in the overall economy. The chart below shows the 12-month average of Housing Starts relative to recessions going back to 1967. Looking at the chart, it’s easy to see how leading up to every prior recession, Housing Starts always started to roll over in advance of the recession. That didn’t happen leading up to the current recession, but given the suddenness of the contraction, there was really no way to anticipate it. Conversely, coming out of prior contractions, the recession was usually over before the 12-month average started to rebound. Here again, the current recession re-wrote the script. Not only did starts never meaningfully rollover, but they are also back at new post-financial crisis peaks. In the periods leading up to, during, and now after this current recession (even though the NBER hasn’t officially called, the COVID recession is over), the patterns of Housing Starts looks nothing like the trends we have seen in prior periods.
Taking a closer look at the current period, the chart below shows the 12-month average for Housing Starts and Building Permits going back to 2010. While Permits weren’t as strong as Starts in March, their 12-month average is actually considerably higher as both series climbed to new post-housing bubble highs.
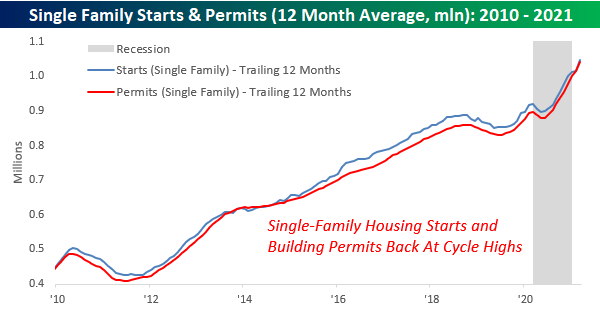
Within both the Housing Starts and Building Permits data, we have also broken out the trends in single-family units. In terms of their economic impact, single-family units are thought to have more of an economic impact than a multi-family unit. Here again, the current trend remains positive as both series reached their highest levels of the post-financial crisis period in March. Click here to view Bespoke’s premium membership options for our best research available.
Bespoke’s Morning Lineup – 4/16/21 – On the House
See what’s driving market performance around the world in today’s Morning Lineup. Bespoke’s Morning Lineup is the best way to start your trading day. Read it now by starting a two-week free trial to Bespoke Premium. CLICK HERE to learn more and start your free trial.
“It all comes down to interest rates. As an investor, all you’re doing is putting up a lump-sum payment for a future cash flow.” – Ray Dalio
The anti-gravitational pull higher in equities has continued this morning as some modest weakness in futures overnight has reversed with all of the major averages now looking to open in the green. Housing data has the spotlight this morning, and both Housing Starts and Building Permits topped consensus expectations. The latter saw only a small beat relative to expectations, while the former exceeded forecasts by more than 100K (1739K vs 1611K). The only other indicator on the calendar between now and the weekend is Michigan Confidence.
Read today’s Morning Lineup for a recap of all the major market news and events including a recap of the biggest overnight events including some key earnings reports, international economic data, as well as the latest US and international COVID trends including our vaccination trackers, and much more.
We’re already hard at work on this week’s Bespoke Report, but this morning we wanted to provide a quick update to a chart from last week’s report. The annotated chart below shows the yield on the 10-year US Treasury on an intraday basis over the last 15 trading days. Along with the move in yields, we’ve also annotated the chart with the releases of some key economic indicators over that time period. So, let’s recap them for you.
On 3/30, Consumer Confidence saw its biggest beat relative to expectations since at least 2000 and the third largest m/m gain on record. On 3/31, the Chicago PMI was the strongest since July 2018. The next day (4/1), the ISM Manufacturing report came in at the highest level in decades. The equity market was closed for Good Friday on 4/2, but Non-Farm Payrolls came in more than a quarter of a million above forecasts. The following Monday on 4/5, the ISM Services report, which goes back to the mid-1990s, came in at the highest level on record. After 4/5, there was a bit of a lull in the data, but last Friday (4/9), PPI saw its largest y/y increase since 2011 while this week’s CPI saw the largest m/m increase since 2009. Finally, in yesterday’s data dump, Jobless Claims dropped to their lowest level of the pandemic, Retail Sales came in at nearly twice consensus expectations with the second-largest m/m increase on record, and both the Philly and NY Fed Manufacturing indices surged.
With all of this great data following a period where the market was freaking out over interest rates, you could have expected to see a big jump in rates, but instead, we’ve seen the complete opposite with the yield on the 10-year at its lowest level since February. As Peter Lynch once said, “Nobody can predict interest rates”, or for that matter, “the future direction of the economy or the stock market.”

Bespoke’s Weekly Sector Snapshot — 4/15/21
Homebuilder Sentiment In The Doldrums
While housing data is still running hot, recently it has hit a bit of a rough patch as indicators like weekly purchase applications have shifted lower (we noted some of the reasons for this in last night’s Closer). This morning’s release of homebuilder confidence gave further pause. The NAHB’s Housing Market Index measuring homebuilder confidence rose by one point to 83 in April. Albeit higher month over month, the index has been in a couple of point range over the past few months and several points off the record high of 90 from November. While that range is still above any levels observed prior to the past year, it shows homebuilders are still optimistic but less so than last year.

Of the three indices contributing to the headline number, Present and Future sales have been a bit stagnant while Traffic has experienced a much more notable rise. That index has risen to 75 which is the highest level since the record of 77 in November. In other words, there still appears to be demand but it is not translating directly into sales.

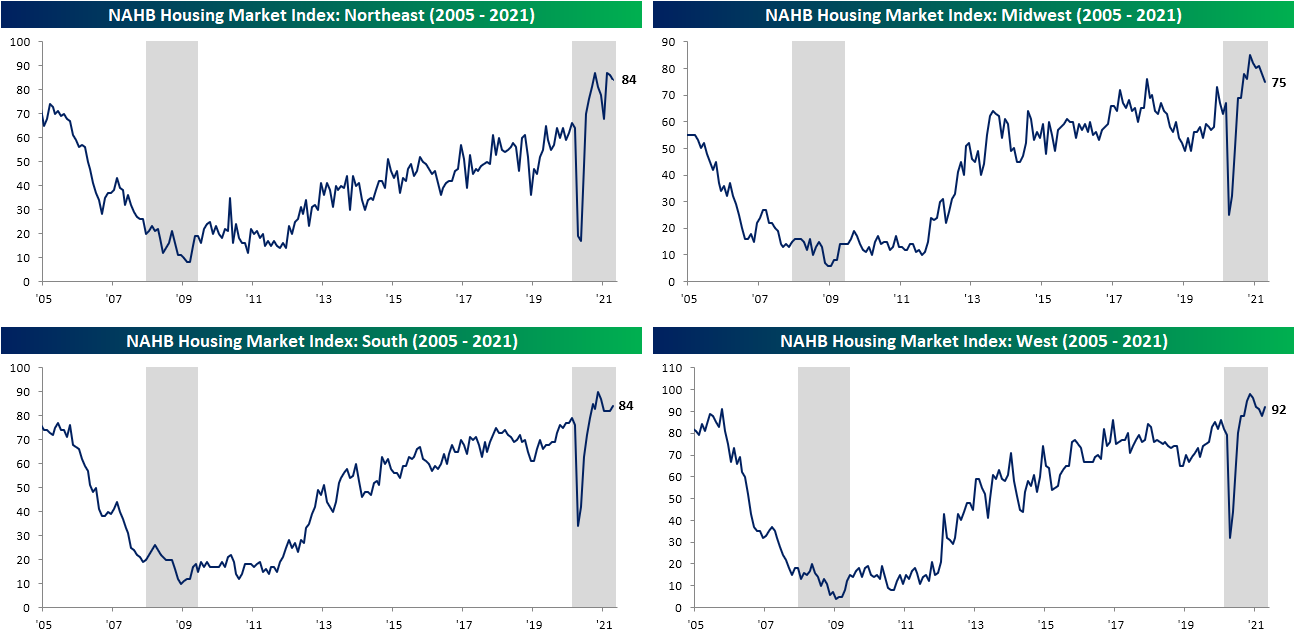
Breaking down sentiment by geographic region shows varying levels of optimism. Starting with the bad news, sentiment in the Midwest is the worst having fallen without much respite over the past several months. Meanwhile, the Northeast has also continued to pull back but sits just off the record highs of 87 from November and February. The South and West, on the other hand, both rebounded in April but remain further off their prior highs. Click here to view Bespoke’s premium membership options for our best research available.
The Bespoke 50 Top Growth Stocks — 4/15/21
Every Thursday, Bespoke publishes its “Bespoke 50” list of top growth stocks in the Russell 3,000. Our “Bespoke 50” list is made up of the 50 stocks that fit a proprietary growth screen that we created a number of years ago. Since inception in early 2012, the “Bespoke 50” is up 468.1% excluding dividends, commissions, or fees. Over the same period, the Russell 3,000’s total return has been +267.6%. Always remember, though, that past performance is no guarantee of future returns. (Please read below for more info.) To view our “Bespoke 50” list of top growth stocks, please start a two-week trial to either Bespoke Premium or Bespoke Institutional.
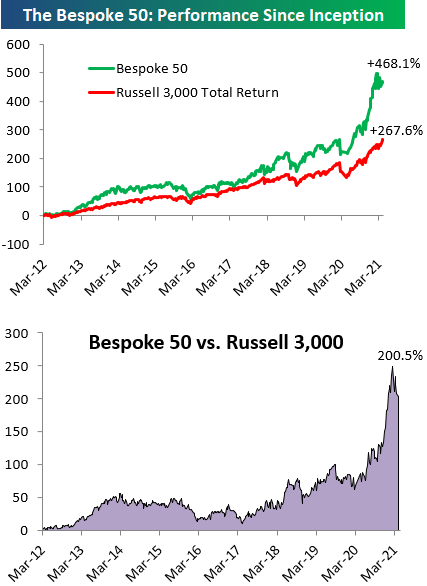
The Bespoke 50 performance chart shown does not represent actual investment results. The Bespoke 50 is updated weekly on Thursday. Performance is based on equally weighting each of the 50 stocks (2% each) and is calculated using each stock’s opening price as of Friday morning each week. Entry prices and exit prices used for stocks that are added or removed from the Bespoke 50 are based on Friday’s opening price. Any potential commissions, fees, or dividends are not included in the performance calculation. Performance tracking for the Bespoke 50 and the Russell 3,000 total return index begins on March 5th, 2012 when the Bespoke 50 was first published. Past performance is not a guarantee of future results. The Bespoke 50 is meant to be an idea generator for investors and not a recommendation to buy or sell any specific securities. It is not personalized advice because it in no way takes into account an investor’s individual needs. As always, investors should conduct their own research when buying or selling individual securities.