What is a 200-Day Moving Average Again?
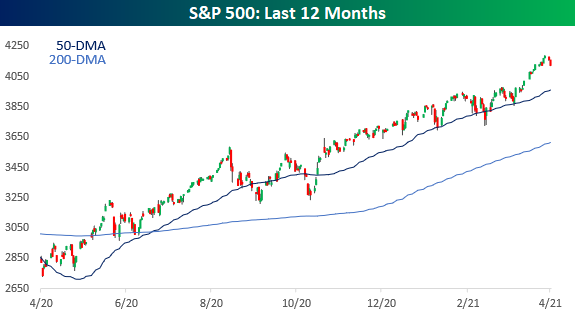
If we’ve learned anything over the last two trading days after what seemed like a one-way move higher for the S&P 500, it is that equities can also go down. Even after the declines of the last couple of days, though, the S&P 500 still remains close to 4% above its 50-day moving average (DMA) and more than 10% above its 200-DMA. While there have been a handful of days since the COVID lows where the S&P 500 has dipped below its 50-DMA, there hasn’t been a single day since last June where the S&P 500 came even close to testing its 200-DMA. We’re only in late April now, but as long as the S&P 500 doesn’t see a significant fall in the next two months, it has the potential to go a full year without closing below its 200-DMA. When the 200-DMA does finally come into play again, many investors may not recognize what it is.
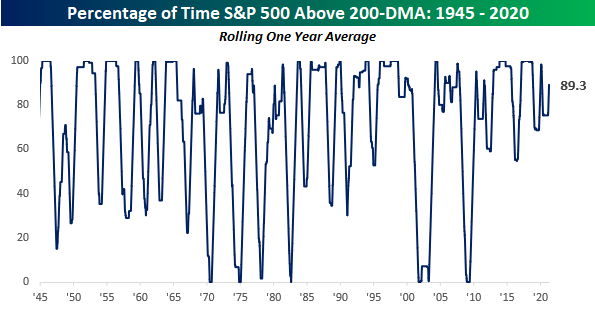
The chart below shows the percentage of time over a rolling one-year period that the S&P 500 traded above its 200-DMA. At 89% now, the current level is hardly remarkable by historical standards. Right before the COVID crash last year, the percentage reached as high as 97.6%, and three years ago in March 2018, it was up at 100%. What is remarkable about the chart, though, is how elevated this moving average has been for so long. The last time it was below 50% was back in December 2009!
It’s easy to tell by looking at the chart, but thanks to short and swift pullbacks in the post-financial crisis period, this current streak without a sub-50% reading is the longest on record. To put a little more meat on the example, after the current streak of nearly 11.5 years, the next longest streak stretched over a period of just under ten years spanning from April 1991 through March 2001 while the one behind that was less than five years (ending in May 2008). And you only thought the market had been defying gravity recently! Click here to view Bespoke’s premium membership options for our best research available.
Bespoke Stock Scores — 4/20/21
Netflix (NFLX) and Other Volatile Stocks on Q1 Earnings
In an earlier post, we highlighted the volatility of Netflix (NFLX) who is set to report first-quarter earnings tonight. As for where NFLX’s volatility stacks up to other comparable stocks reporting over the next month, in the table below we show the most volatile stocks of those with at least 5 years worth of data in our earnings database that have also beaten EPS and sales estimates 75% of the time in Q1 like NFLX has. In other words, it is a list of stocks that, like NFLX typically see volatile responses to earnings in spite of solid results. NFLX and its 10.78% average move ranks as the tenth most volatile name on the list. The company is also by far the largest of these with its market cap being more than five times larger than the next closest: Chipotle Mexican Grill (CMG) and Align Tech (ALGN).
There are also four names, SolarEdge (SEDG), Fluidigm (FLDM), Enova (ENVA), and Blucora (BCOR) that are more volatile than NFLX by more than five percentage points. Of these, only FLDM has more often than not, like NFLX, seen negative stock price reactions to Q1 earnings. While less volatile, Vocera (VCRA) and GrubHub (GRUB) have also dropped more often than they have risen on Q1 earnings days. On the other hand, SEDG, ENVA, Air Transport Services (ASTG), and Zillow (ZG) have frequently traded higher with some of the largest average gains on this list. Click here to view Bespoke’s premium membership options for our best research available.

Netflix (NFLX) Earnings Coming Up
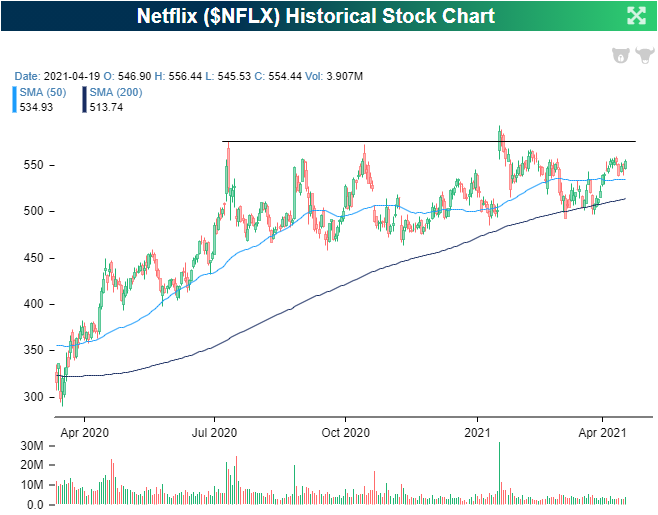
Netflix (NFLX) is one of the first mega-cap Technology/Communication Services stocks to report this earnings season with quarterly results due out after the closing bell tonight. As with a swath of other mega-cap Tech stocks, NFLX has been in consolidation for much of the last year. NFLX has failed at multiple points to break out above resistance around the $550-$575 range including a pump fake following the last earnings report earlier this year. Stuck below those levels, the stock has mostly been fluctuating around its 50-DMA with some successful tests of its 200-DMA last month.
Below we show a snapshot from our Earnings Explorer showing the aggregate summary of past earnings results for NFLX. Across all quarters, the stock has averaged an absolute move of 12.28% in reaction to earnings. But reactions are highly seasonal. For example, most of the positive reactions have come on Q4 earnings days (January reports) when the stock has averaged a gain of 10.72% with a move higher almost three-quarters of the time. Last quarter was a prime example of this with NFLX rising 16.85% on its earnings reaction day, and that was in spite of missing on the bottom line. Comparatively, Q1 earnings (April reports) are not the worst in terms of stock price reaction (Q2 holds that title), but results do hold a negative bias. Across all of NFLX’s past 18 Q1 reports, the stock has only seen a positive price reaction 39% of the time with an average decline of 1.04%. The last time that NFLX moved higher on Q1 earnings was in 2018 when it rallied 9.19%. Although reactions in Q1 have typically been negative, they are also the least volatile of any quarter (10.78%). Granted, that’s not saying much when it’s Netflix we’re talking about. We would note though that the past two Q1 reports have seen much more modest declines of 2.86% and 1.31%.


Given that historic volatility on earnings, there is a wide range of possibilities where NFLX could stand from a technical perspective after tomorrow’s reaction to earnings. While positive reactions are less likely, a positive reaction of a similar-sized move to the average volatility (+10.78%) could lead NFLX to break out above the past several months’ consolidation whereas a negative reaction of that size would see the opposite take place (yellow dot). An equivalent-sized move to the downside would result in NFLX falling below its 200-DMA and to the low end of its range (red dot). Assuming a move the same size as the average for past Q1 reports—which is also a realistic possibility when looking at the past couple of years’ Q1 reports—the 1% decline would still leave NFLX above its 50-DMA. Click here to view Bespoke’s premium membership options for our best research available.

Chart of the Day – Bitcoin Streak Bites the Dust
Bespoke’s Morning Lineup – 4/20/21 – Low Energy Market
See what’s driving market performance around the world in today’s Morning Lineup. Bespoke’s Morning Lineup is the best way to start your trading day. Read it now by starting a two-week free trial to Bespoke Premium. CLICK HERE to learn more and start your free trial.
“If a man didn’t make mistakes he’d own the world in a month. But if he didn’t profit by his mistakes he wouldn’t own a blessed thing.” – Edwin Lefevre
What had been a sideways market overnight in the US equity futures market turned into a steady grind lower right with the opening bell in Europe. S&P 500 futures are now indicated to open down about half of one percent. While that would only bring the two-day decline to about 1%, after the one-way higher market we have seen since late March, it seems a lot more painful. It’s all about perspective.
The economic calendar is quiet again today with no reports on the calendar. In earnings news, after the close, the key companies reporting include Intuitive Surgical (ISRG) and Netflix (NFLX).
Read today’s Morning Lineup for a recap of all the major market news and events including a recap of the biggest overnight events including some key earnings reports, economic data out of Asia, as well as the latest US and international COVID trends including our vaccination trackers, and much more.

Within the US equity market, two of the hottest areas in Q4 and earlier this year were small caps and Energy, but like the Technology sector late last summer, both of these have now run into some serious consolidation.
Starting with small caps, besides the Russell Micro-Cap ETF (IWC), the Russell 2000 (IWM) is the only other index ETF currently below its 50-DMA. Sure, it’s less than 1% below that level but when just about every other index ETF is 4% or more above that level, it’s a pretty wide performance gap. As shown in the chart below, the Russell 2000 is in a bit of limbo as it is smack dab in the middle of the range it has traded in since the start of the year.

Like small caps at the index level, Energy (XLE) is the only sector currently below its 50-DMA. Here again, it’s less than 1% below that level, but when the other ten sectors are trading anywhere from 3.3% to 7.4% above their 50-DMAs, Energy’s underperformance really stands out. The chart picture for Energy looks similar to small caps, although we would note that it is currently trading right at levels that have provided support multiple times since late February.

Daily Sector Snapshot — 4/19/21
Most Shorted Stocks Underperform But Not Without Exceptions
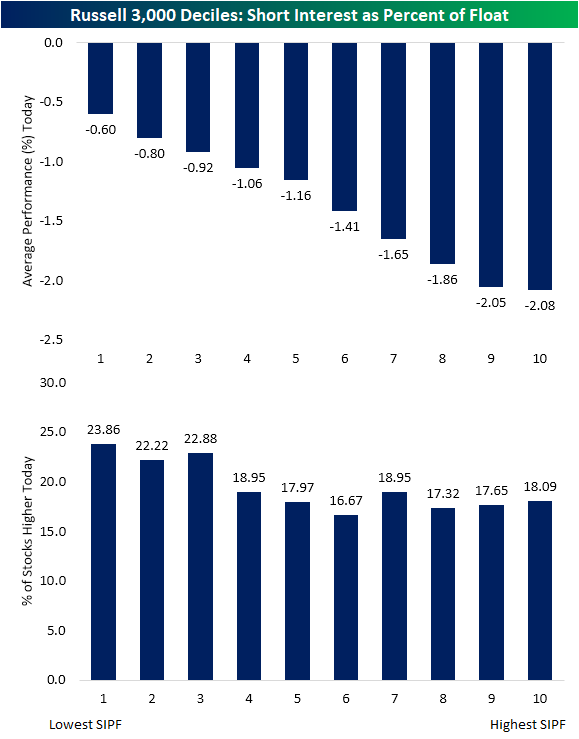
GameStop (GME) is in the news again today and rallying over 6% with the announcement that the company’s CEO, George Sherman, will be stepping down and that ‘roaring kitty’ has increased his stake. Earlier this year, the stock was the most heavily shorted stock in the Russel 3,000 with well over 100% of the float sold short. Today, ‘only’ 19.5% of shares are sold short. Although GME is seeing a decent-sized move higher, breaking the Russell 3000 into deciles based on short interest shows the stock is more of an outlier in terms of the relationship between performance and short interest. As shown below, the first decile comprised of the least shorted stocks in the index is outperforming averaging a decline of 60 bps while the tenth decile (which includes GME) of the most heavily shorted stocks is down the most at 2.08%. Alongside the ninth decile, these two groups of the most heavily shorted names are down an average of more than 2%.
Additionally, stocks belonging to the top three deciles of the least shorted stocks all have a higher percentage of stocks trading higher on the day, but that relationship is less consistent for the other deciles. As shown in the second chart, the decile of the most shorted stocks actually has a more middling reading of 18.09% while the sixth decile has the lowest percentage of stocks higher today.
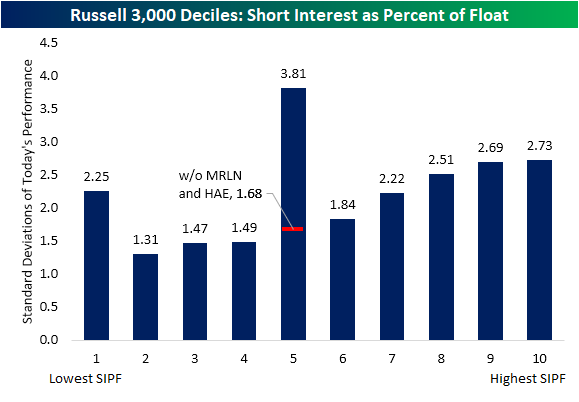
In other words, there is a wider range of performance of more heavily shorted stocks than the stocks that are less heavily bet against. The chart below shows these same deciles and the standard deviations of the groups’ performance today. The fifth decile has the largest range of performance today as a result of the two single biggest movers of the index both belonging to this decile. Those are Marlin Business Services (MRLN) and Haemonetics (HAE) which are up 48.95% and down 33.71%, respectively. Without those names, the reading is less extreme at 1.68. Again controlling for those names, the most shorted stocks would have the highest standard deviation of returns at 2.73.
To show this further, in the table below we show the 15 biggest gainers and decliners in today’s session. As previously mentioned, the biggest gainer is Marlin (MRLN) which is rallying almost 50% on news that it will be taken private. Meanwhile, Haemonetics (HAE) has been cut down by a third after a supply agreement was not renewed. Both of these stocks belong to the fifth decile in terms of short interest. As for the other biggest movers, many that belong to the top couple of deciles can be found on both sides of the ledger. So again, although the most heavily shorted stocks are on average the biggest decliners today and vice versa, there are a number of exceptions. Click here to view Bespoke’s premium membership options for our best research available.
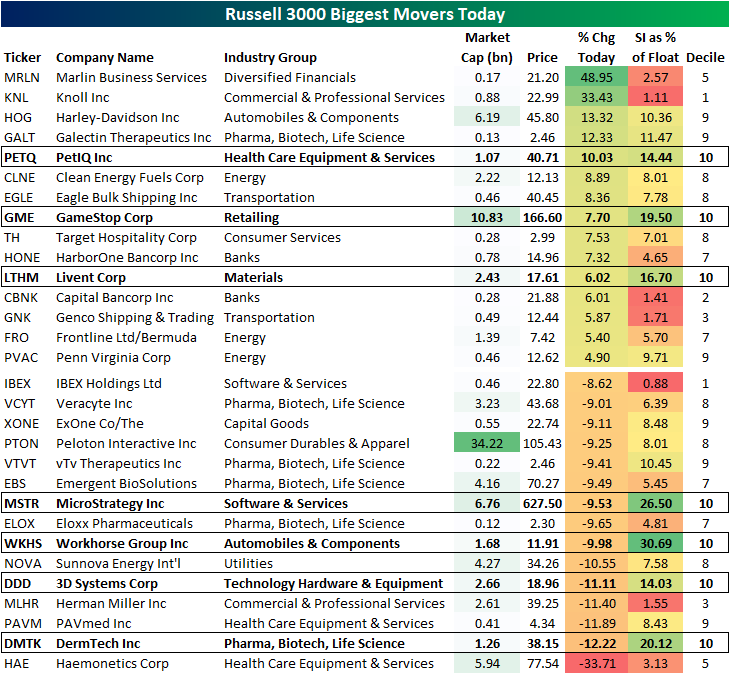
Chart of the Day – Extreme Overbought Short and Long-Term Readings
One of The Strongest Weeks of the Year
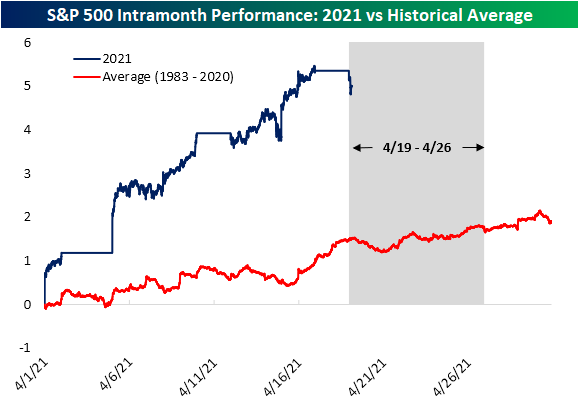
While earnings are likely to be a key catalyst over the next few days, from a seasonal perspective, the current week of the year has historically been one of the best. As shown in the snapshot from our Seasonality Tool below, the current week of the year (April 19th through April 26th) has seen the S&P 500 post a median gain of 1.44% over the last ten years. Going out a bit further, the one-month return is only slightly better with a median gain of 1.47%, which is more middling relative to all other one-month periods throughout the year. The same can be said for the 3-month period although it is a stronger period of the year which stands in the top quartile of all three month periods.

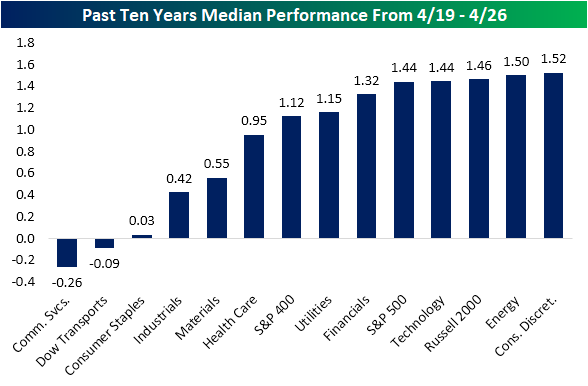
Expanding this beyond just the S&P 500, in the chart below we show the median performance across all sectors and market cap indices for the next week (4/19-4/26) based on the last ten years of trading. As shown, Technology is right in line with the S&P 500 with a 1.44% gain while the small-cap Russell 2,000, the Energy sector, and Consumer Discretionary have notched slightly stronger performance. While mid-caps (S&P 400), Utilities, and Financials have all managed to also typically rise over 1%, there has historically been some weakness from Communication Services and the Dow Transports as both have median declines. Consumer Staples has only marginally moved higher with a 3 bps gain.
Taking a bit more of a granular look at this period, in the chart below we show the intra-month performance of the S&P 500 so far in April this year as well as a comparison to the historical average for the month of April since 1983. With the S&P 500 already up around 5% on the month, performance thus far is better than the average gain of around 1.5% by this time. Even though the next week has historically been a very strong time of the year from a seasonal perspective, the S&P 500 is starting off trading lower today. But we would note that it is not necessarily unusual. As shown below, even though it has been a strong period, the first couple of days typically have seen the S&P 500 drift lower before reversing higher in a move that typically lasts through the end of the month. Click here to view Bespoke’s premium membership options for our best research available.