The Bespoke Report Weekly Newsletter– 4/23/21
This week’s Bespoke Report newsletter is now available for members.
At 1 PM ET on Thursday, the S&P 500 was trading up nicely on the day and then suddenly dropped on news headlines that President Biden’s upcoming infrastructure/tax hike proposal would include an increase in the capital gains tax on high earners from ~20% up to ~40%. It was curious that the market fell at all on this headline given that this type of tax hike was something Biden ran on during his campaign, but nevertheless, major US indices continued to fall for the remainder of the trading day to finish down roughly 1% on the day.
The worries — at least as far as the market is concerned — didn’t last long. 26 hours later at the close on Friday, the S&P 500 tracking SPY ETF closed exactly 1 cent below the level it was trading at as of 1 PM ET on Thursday!
Overall, US index ETFs were slightly lower on the week but remain up 3-6% in April and 8-20% YTD. Most sectors finished the week lower, although Health Care, Industrials, and Materials managed to post gains. China (ASHR) had a strong week, up 4.4%.
As usual, this week’s Bespoke Report covers the major forces that are driving equity markets right now. To read the report and access everything else Bespoke’s research platform has to offer, start a two-week free trial to one of our three membership levels. You won’t be disappointed!

Daily Sector Snapshot — 4/23/21
All Streaks Eventually End
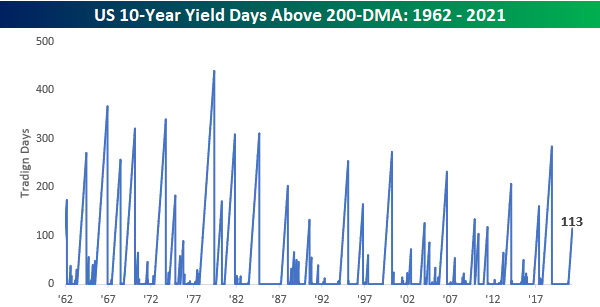
Interest rates have been steadily on the rise ever since last summer as optimism over the economy re-opening and concerns regarding ballooning federal deficits and potential inflation have pushed borrowing costs higher. In recent weeks, we have seen a bit of a reversal in this trend as the yield on the 10-year US Treasury has dropped from about 1.75% to just over 1.5% even as economic data has continued to come in very strong. What’s also notable about the recent decline in yields is that on Thursday, the yield on the 10-year actually closed marginally below its 50-day moving average (DMA) for the first time since August 21st.

At 166 trading days, the just-ended streak of days where the 10-year yield closed above its 50-DMA was the longest on record going back to at least 1962, eclipsing the prior record of 162 trading days from March 1966. Also, since 1962, there have only been five other streaks that lasted even 100 trading days with the last occurring all the way back in 1984.

While the 10-year yield just ended a record streak of closes above its 50-DMA, its current streak of closes above the 200-DMA is much more ‘normal’ relative to history. At 113 trading days, it doesn’t even rank anywhere near the top ten in terms of longest streaks. With the 200-DMA only barely above 1%, though, that streak isn’t in danger of coming to an end any time soon. Click here to view Bespoke’s premium membership options for our best research available.
Bespoke’s Morning Lineup – 4/23/21 – Hesitant into the Weekend
See what’s driving market performance around the world in today’s Morning Lineup. Bespoke’s Morning Lineup is the best way to start your trading day. Read it now by starting a two-week free trial to Bespoke Premium. CLICK HERE to learn more and start your free trial.
“Real knowledge is to know the extent of one’s ignorance.” – Confucius
It’s a mixed picture for equity futures this morning after Thursday’s drubbing. There’s been no economic data so far, but at 10 AM we’ll get flash readings on April Manufacturing and Services activity from Markit. Investors will be looking for signs of how serious or likely the Democrats will be to pass Biden’s plans to raise capital gains tax rates for the highest earners, but with some Democrats even voicing concerns, this plan may not be the slam dunk that the market feared yesterday.
Read today’s Morning Lineup for a recap of all the major market news and events including the biggest overnight events, some key earnings reports, economic data from around the world, as well as the latest US and international COVID trends including our vaccination trackers, and much more.

Economic data has generally been strong around the world lately, but don’t tell that to the 10-Year US Treasury. Yesterday, the yield on the 10-year US treasury closed below its 50-DMA for the first time since last August.

Records Across the Board Out of Kansas City
There has been no shortage of strong readings on the manufacturing sector of late and this morning’s release of the Kansas City Manufacturing index was yet another point of this. The index was already at a record high in March but it gained another 5 points this month. Expectations pulled back slightly but remain right around some of the highest levels in the history of the survey.

With overall growth accelerating at a record pace, half of the individual categories of the report also set new records. Even for those that did not set a new record, almost all of the April readings were at least in the top few percentiles of all readings. As shown below, every index is now showing expansionary readings after the index for Finished Good Inventories rose to 8 from -10 last month. Additionally, there were only two indices that were lower month over month: New Orders and Supplier Delivery Times. In spite of those declines, both of those indices are coming off of record or close to record highs. In other words, even after declining they remain historically elevated.

New Orders continue to grow at a historically strong rate albeit decelerated from March as that index fell 9 points to 29. Given the further growth in orders, backlogs are continuing to rise at an increasingly rapid pace. That index gained another 3 points to reach a new high of 35. This month marks the third in a row that the index for unfilled orders came in at a record high. To meet this demand, firms appear to have massively ramped up production as the index topped 40 after gaining 17 points month over month. Although production is rapidly accelerating, shipments are lagging a bit. That index is also at a strong level of 32 but it only rose 5 points.
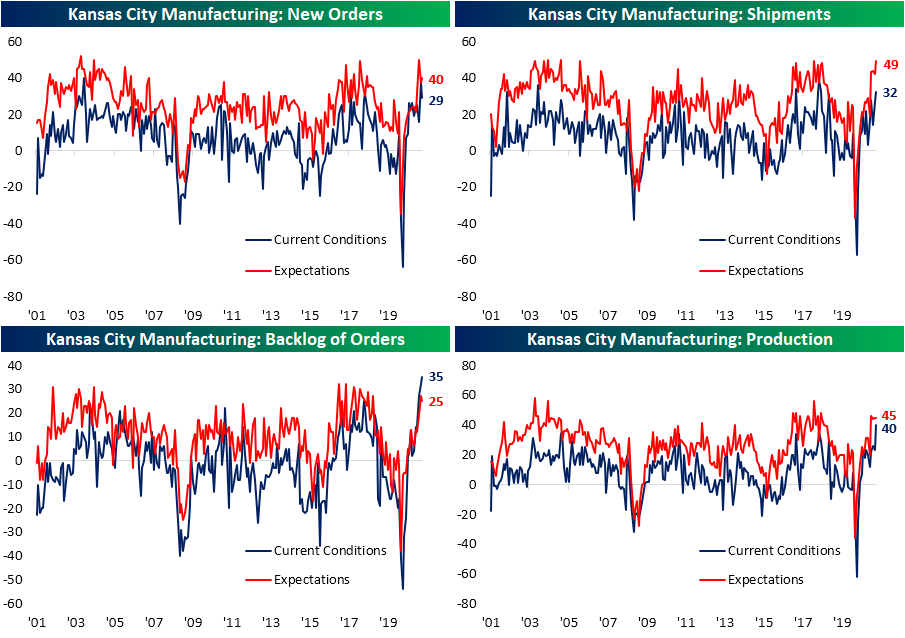
One likely reason for a more throttled reading on shipments is supply chain issues. As shown below, Delivery Times still remain extremely elevated. Even after pulling back in April, the index is well above anything observed prior to the past several months. Highlighted comments also make mention of these issues. For example, one comment states that “It is very difficult to handle the increased business with supply chain issues across all materials and finding anyone who wants to work” while another mentioned the company is, “facing significant supply chain problems due to COVID-19 issues, tariff issues, and the weather problems in Texas earlier this year”. On the bright side, expectations for Delivery Times plummeted in April as the index collapsed by 14 points. That is in the bottom percentile of all monthly moves.

Commentary also frequently mentioned increases in prices and the data backs up that anecdotal evidence. Both indices for Prices Paid and Prices Received rose to record highs this month. The same can be said for expectations of prices paid. The commentary gave a bit more color to this with mentions of inputs like steel contributing to those increases. Labor shortages were another area blamed for rising prices.

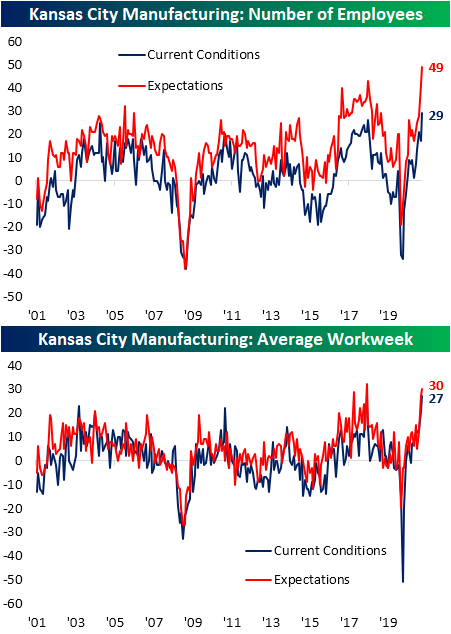
On the topic of labor, the indices for Number of Employees and Average Workweek are both at new highs. Expectations also remain extremely optimistic with the former at the highest level to date and the latter just off the prior high of 32 from June 2018. Again circling back to the commentary section, one firm noted that “Entry-level pay will need to be increased. This will create pressure on all other positions” and another stated that they “cannot get people to apply. We pay upwards of $20 or more per hour with full benefits”. In other words, even with employment metrics rising at a record rate, there is still plenty of demand on the part of employers. Click here to view Bespoke’s premium membership options for our best research available.
Bespoke’s Weekly Sector Snapshot — 4/22/21
The Bespoke 50 Top Growth Stocks — 4/22/21
Every Thursday, Bespoke publishes its “Bespoke 50” list of top growth stocks in the Russell 3,000. Our “Bespoke 50” list is made up of the 50 stocks that fit a proprietary growth screen that we created a number of years ago. Since inception in early 2012, the “Bespoke 50” is up 469.1% excluding dividends, commissions, or fees. Over the same period, the Russell 3,000’s total return has been +266.2%. Always remember, though, that past performance is no guarantee of future returns. (Please read below for more info.) To view our “Bespoke 50” list of top growth stocks, please start a two-week trial to either Bespoke Premium or Bespoke Institutional.

The Bespoke 50 performance chart shown does not represent actual investment results. The Bespoke 50 is updated weekly on Thursday. Performance is based on equally weighting each of the 50 stocks (2% each) and is calculated using each stock’s opening price as of Friday morning each week. Entry prices and exit prices used for stocks that are added or removed from the Bespoke 50 are based on Friday’s opening price. Any potential commissions, fees, or dividends are not included in the performance calculation. Performance tracking for the Bespoke 50 and the Russell 3,000 total return index begins on March 5th, 2012 when the Bespoke 50 was first published. Past performance is not a guarantee of future results. The Bespoke 50 is meant to be an idea generator for investors and not a recommendation to buy or sell any specific securities. It is not personalized advice because it in no way takes into account an investor’s individual needs. As always, investors should conduct their own research when buying or selling individual securities.
Dips in Short Supply
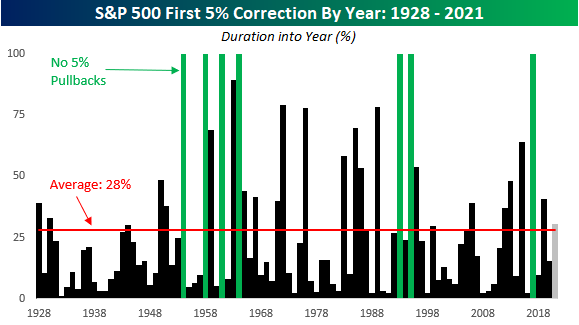
While many areas of the market have seen sizable pullbacks this year, the broader market has been stingier. Just this morning, a client was lamenting the fact that they had a decent amount of cash, but the market just wasn’t providing opportunities to get in. So far this year, the S&P 500’s largest decline from a peak (on a closing basis) has been 4.23%, and given that we’re not even four full months into the year, we initially thought that 4% seemed normal enough especially when the earlier months of the year tend to be positive.
In order to see how this year stacks up to prior years, the chart below shows the duration into each year (on a percentage basis) that the S&P 500 first closed down 5% or more from its YTD peak. Years in green indicate that there wasn’t a single point in the entire year that the S&P 500 experienced a 5% decline. The last occurrence was in 2017, and there have been a total of seven years since 1928. As we near the end of April, we’re nearly a third of the way into 2021, and compared to the ‘average’ year, we’ve already gone longer without a 5% pullback. Since 1928, the S&P 500 usually experiences its first 5%+ pullback 28% of the way into the year, which coincidentally enough works out to April 15th – the day before Federal taxes are typically due! In fact, at this point in prior years, the S&P 500 has already experienced its first 5%+ pullback more than 65% of the time. Believe it or not, in 30% of all years since 1928 the first 5% drop occurred in the month of January.
Based on prior years, the market to this point has in fact been stingy in terms of providing opportunities for investors to add exposure, although based on today’s reports of new capital gains tax increases from the Biden Administration, that window may soon open. Click here to view Bespoke’s premium membership options for our best research available.
A Majority of Investors Are Still Bullish
Sentiment continues to run in favor of the bulls though there has been some moderation in the past couple of weeks. Bullish sentiment as measured by the AAII weekly sentiment survey peaked at 56.9% in the second week of April but has since fallen in back-to-back weeks falling 4.2 percentage points to 52.7%. While lower recently, this is the first time since the last two weeks of 2017 and the first week of 2018 that bullish sentiment has remained above 50% for three weeks in a row. Before that, you would have to go back to early 2011 to find another period with bullish sentiment being above 50% for several weeks in a row. Outside of the early 2000s, such readings have been relatively uncommon.


Even though bullish sentiment has pulled back, fewer respondents are reporting bearish sentiment. Only 20.5% of respondents reported as pessimistic this week compared to 24.6% last week. That is 0.1 percentage points above the low of 20.4% from April 8th which was also the lowest level of bearish sentiment since April 2019.
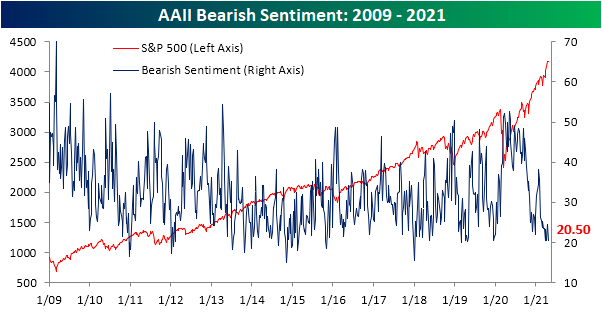
With both bullish and bearish sentiment lower, that means neutral sentiment picked up the difference rising 5.2 percentage points to 26.8%. That was the largest one-week increase in neutral sentiment since a 10 point rise from November 12th to November 19th of last year. Back then, neutral sentiment rose to a slightly higher level of 29.29%.

While individual investors have become less bullish over the past couple of weeks, the opposite is true of newsletter writers. The Investors Intelligence survey of this group has seen bullish sentiment rise for three weeks in a row reaching 63.7% this week. That is the highest level since at identical reading in the second week of the year. Although it has not been particularly long since the last comparable reading, we would note that it is elevated relative to history. In the chart below we show bullish sentiment over the past 50 years. Outside of now and late last year, the last time bullish sentiment was as high was in late 2017/early 2018. You would have to go all the way back to February of 1987 or earlier to find another time before that when sentiment was as high as it is now. Additionally, less than 20% of respondents are also looking for a correction. Readings around these levels were not necessarily uncommon in the early 2000s and prior, but relative to the past 15 years or so such a low reading has been rarer. Click here to view Bespoke’s premium membership options for our best research available.
