Gold (GLD) Extending Winning Streak to 10
Just over a week ago, gold, the SPDR Gold Trust ETF (GLD) closed above its 200-DMA for the first time since February 1st. The rally that took GLD above its 200-DMA has also broken the downtrend that had been approaching a year in age. Today, GLD is up another 0.22% to the highest level since January 7th.

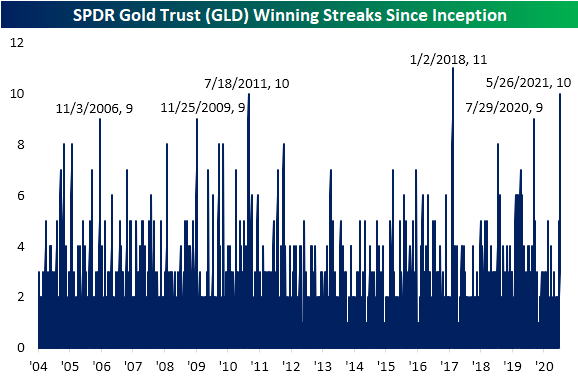
Given another move higher today, GLD is also on pace to close in the green for the tenth day in a row. That is not necessarily the case for other measures of the yellow metal like front-month futures which experienced a 2 bps decline on Monday, but with regards to GLD that is tied for the second-longest winning streak on record. At ten days long, the current streak of consecutive gains is the longest run since the 11-day streak ending 1/2/18. Prior to that, July 2011 was the only other double-digit streak with a few other nine-day-long steaks; the most recent of which ended in July of last year.
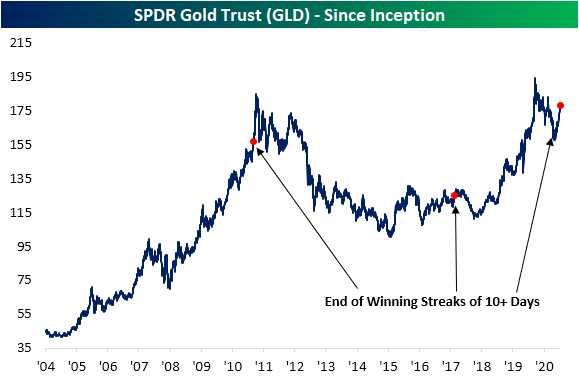
The recent rally in GLD continues to set up the over-decade-long cup and handle pattern that we have made note of in the past, though, GLD still needs to rally another 8.15% to take out last summer’s highs to complete the pattern. Given the nearly 8% rally over the course of the current winning streak, GLD has reached extremely overbought levels at more than 2 standard deviations above its 50-DMA and begs the question of how much steam is left.
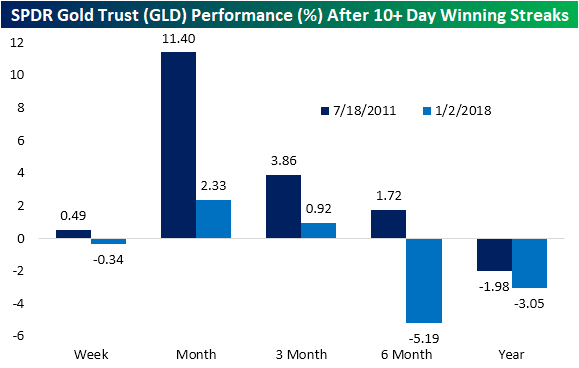
While it is certainly too small of a sample size to put too much weight on, looking at the streaks in 2011 and 2018 that also went on for 10 or more days there has been somewhat mixed performance. The instance in 2011 saw further gains one week later and particularly strong performance over the next month with an 11.4% move higher. Granted, those gains were erased over the course of the rest of the year after the streak came to a close. One year out, GLD was lower than where it stood at the end of the streak. The more recent streak on the other hand was lower one week after coming to an end. While there was a bit more upside in the next quarter, six and twelve months later it was again lower. In order for GLD to take out last year’s high, it’s going to have to buck its recent trend that followed prior extended streaks. Click here to view Bespoke’s premium membership options for our best research available.
Largest YTD Change in Prices at the Pump Since 2009
It’s that time of year again. Summer driving season kicks off this weekend with the Memorial Day holiday, and if you’re planning on doing a road trip, you may want to consider a trailer for the back of the car to hold all the gas money. The table below shows the AAA national average price of a gallon of gasoline on this day for every year since 2005. At the current level of $3.04, the national average is the highest it has been at this time of year since 2014, and since 2005 there have been just six other years where prices were higher. In terms of the YTD change, prices are already up 34.6% this year, which is the third-largest YTD increase since 2005 and the largest since 2009. That’s not only nearly twice the historical average but also a big swing from last year when prices were actually down 24% YTD as of 5/26.
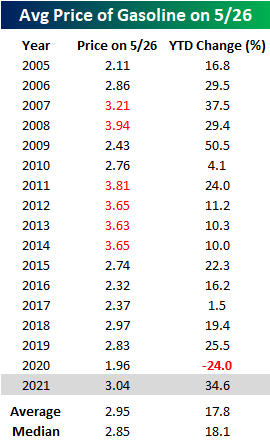
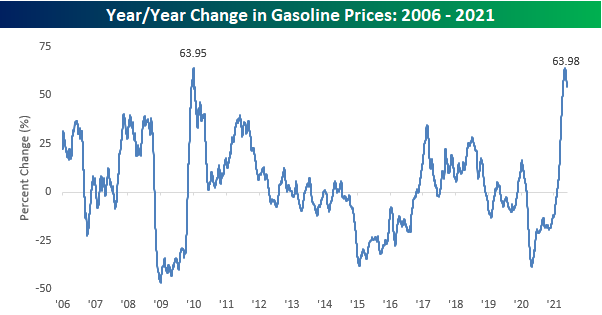
Given the big reversal from a 24% YTD decline last year to one of the largest YTD increases this year, you can imagine that gas prices are up a lot over the last year. Not only is the national average price up a lot, but it also just saw its largest y/y increase on record. Back on May 4th, the y/y increase in the national average topped out at 63.98%, which just barely eclipsed the prior record high of 63.95% from back in January 2010 coming out of the Financial Crisis. It should come as no surprise that the two largest y/y increases in gasoline prices since 2006 have both occurred coming out of major economic contractions. Crude oil and gasoline are notoriously volatile, and their direction is highly correlated to the business cycle.
There’s no arguing the downside of higher gasoline prices for the consumer, but what’s done is done. Looking ahead, seasonal trends suggest that barring a major disruption in supply, the upside potential for gasoline prices may be limited. The chart below compares the YTD change in crude oil prices so far in 2021 to a composite of the average YTD change for all years since 2005. While this year’s increase has been much steeper than the typical year, we have reached the time of year where gas prices typically start to peak out and trade sideways through the Summer before a steady decline to close out the year. Click here to view Bespoke’s premium membership options for our best research available.

Chart of the Day – The First 100 Days: On Borrowed Gains?
Bespoke’s Morning Lineup – 5/26/21 – Dollar on the Floor
See what’s driving market performance around the world in today’s Morning Lineup. Bespoke’s Morning Lineup is the best way to start your trading day. Read it now by starting a two-week free trial to Bespoke Premium. CLICK HERE to learn more and start your free trial.
“The history of mankind is the history of money losing value.” – Milton Friedman
It’s been a quiet news morning, but that hasn’t kept futures from rallying. Treasuries are essentially flat, equities are modestly higher, and bitcoin is bouncing in a big way and back above the $40,000 level (for now).
Read today’s Morning Lineup for a recap of all the major market news and events including a recap of some notable earnings reports, major economic data out of Asia and Europe, and the latest US and international COVID trends including our vaccination trackers, and much more.

After an initial surge in the early days of COVID, the dollar has been on the defensive for the last year now. We saw a modest bounce earlier this year, but the rally in the Bloomberg Dollar Index stalled out in March just shy of its 200-DMA and is now back to testing 52-week lows from earlier this year.

Current levels for the Bloomberg Dollar Index represent an important line in the sand as it’s nearing the lowest levels in more than five years. Looking at the Bloomberg Dollar Index on a longer-term basis, we can see just how important the 1,100 level is. From 2005 through late 2014, there were only a handful of days where it ever traded above that level, but after breaking above 1,100 in 2015, it hasn’t looked back since. If that level does not hold going forward, it could mark an important turning point from a strong to weak dollar environment, and that would have implications on many asset classes and investment strategies.

Daily Sector Snapshot — 5/25/21
Bespoke Stock Scores — 5/25/21
Chinese Equities Elevated
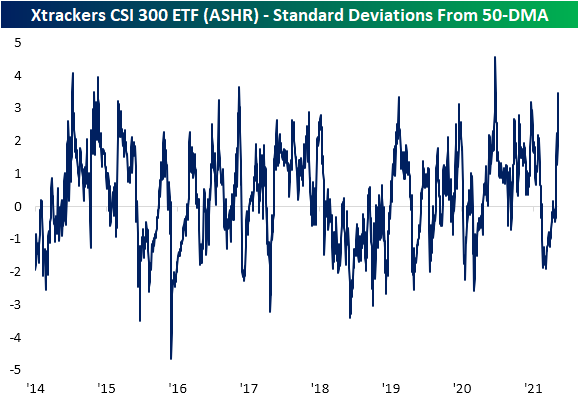
Last week, we highlighted how the Xtrackers CSI 300 ETF (ASHR) tracking Chinese A-Shares finally began to trend higher after being sandwiched between its 50 and 200-DMAs for most of 2021. After that breakout, ASHR did not see much of a further move higher but fast forward to today and the ETF is surging once again. After a strong session overnight, ASHR has risen almost 4% today for its best single-day performance since July 6th of last year when the ETF popped 11.24%. As previously mentioned, ASHR had been stuck between its 50 and 200-DMAs for most of the time since late February, and as such, up until the past week it had not seen an overbought reading since February 19th. With the huge move today, ASHR is trading 3.45 standard deviations above its 50-DMA. As with the size of the move today, the last time that ASHR was as extended above its 50-DMA as it is now was in July of last year following the massive single-day July 6th surge. Prior to that, you would have to go back to November 2016 to find as elevated of a reading. Click here to view Bespoke’s premium membership options for our best research available.

Most of ARKK Bouncing But Still Down Big
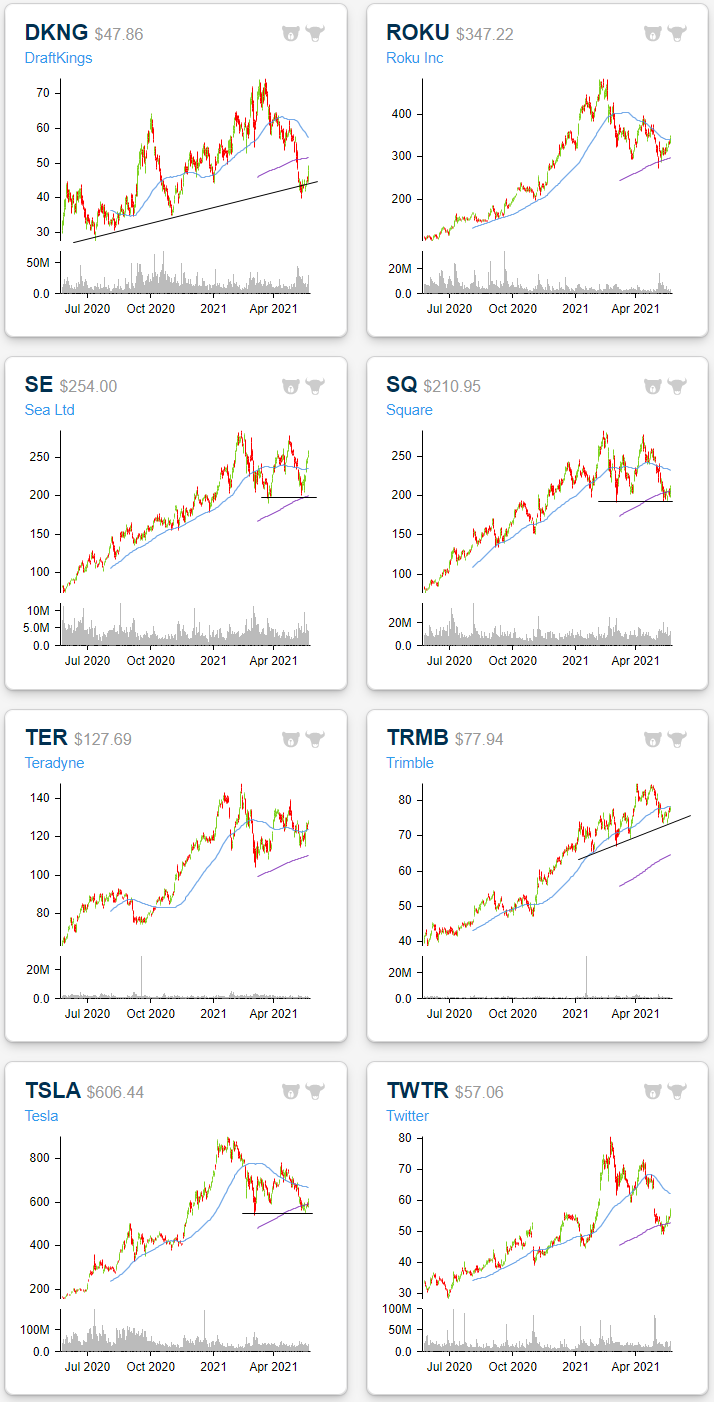
After trading deep into oversold territory, the past two weeks have seen the ARK Innovation ETF (ARKK) erase some of the losses of the past few months. Since the closing low on May 13th, ARKK has rallied a hair above 10%, although that still leaves it down over 30% from its 52-week high on February 12th. As for the holdings of the ETF, on a year-to-date basis there are just 10 stocks that are still in the green in 2021. Back in late January, nearly every ARKK holding was in the green.
Performance over the past week is essentially the inverse of year-to-date performance. Whereas there are only a handful of stocks up YTD, there are only a handful that have fallen over the past five days. Although it does not hold a large weight in the ETF (0.98%), by far the worst-performing stock has been Iovance Biotherapeutics (IOVA). The stock was hit with a double whammy of bad news recently when the company announced the CEO, Maria Fardis, would be stepping down in addition to delaying its biologics license application until the first half of next year following feedback from the FDA. That actually comes after a previous delay in the application back in October. As for the rest of the ARKK cohort, Coinbase (COIN), HUYA (HUYA), and Proto Labs (PRLB) are the only other names down at least 5% in the past five days ending yesterday. On the other end of the spectrum, there are ten stocks that have rallied at least 10% in the same span. Only one of these, Shopify (SHOP), has risen to more than one standard deviation above its 50-DMA while Sea (SE) is on the cusp of being able to say the same.
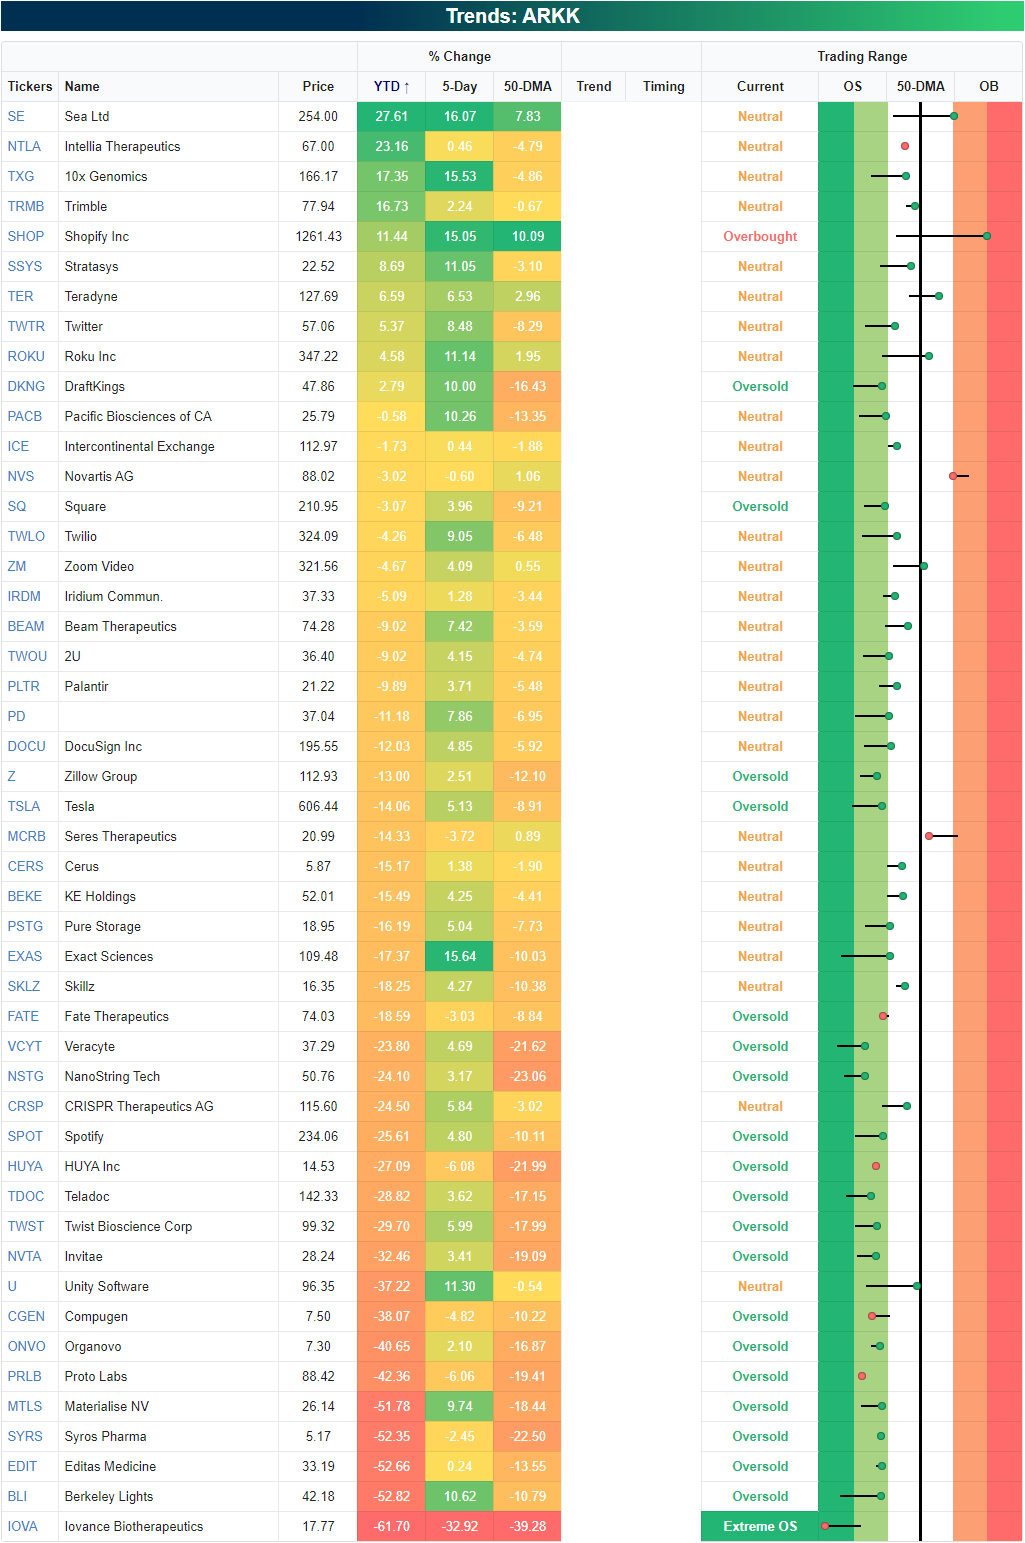
The charts of the ARKK holdings are all over the place ranging from still trending higher, to being in consolidation, to having totally collapsed. For holdings like DraftKings (DKNG), ROKU (ROKU), Teradyne (TER), Trimble (TRMB), or Twitter (TWTR), the past few months of declines have brought price back down to around the past year’s uptrend lines or their 200-DMAs. For others like Square (SQ), Sea (SE), or Tesla (TSLA), those long-term uptrends of the past year are less intact but the recent bounces have similarly come around their 200-DMAs or prior support from the lows earlier this year. The snapshot above is from our Trend Analyzer tool that Bespoke Premium members have access to. We have whited out two of the columns in the snapshot — our Trend and Timing scores. To access these two proprietary indicators, be sure to start a two-week Bespoke Premium trial. You’ll also have access to our Chart Scanner tool which is where the charts below are pulled from.
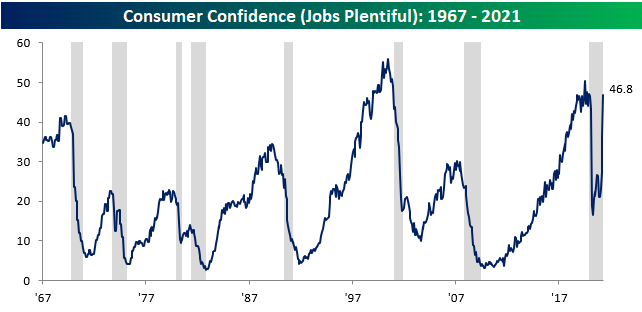
Jobs As Plentiful As They Were Right Before the Pandemic
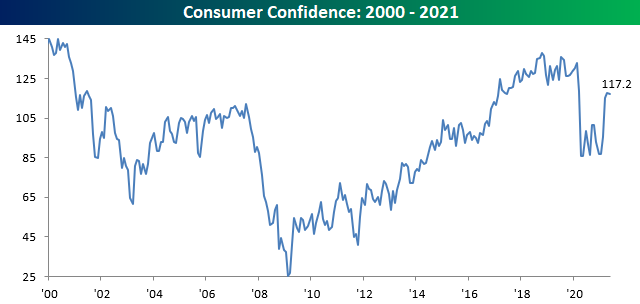
Consumer Confidence took a rest in May as the headline index dropped slightly falling from 117.5 (revised down from original 121.7) to 117.2 and more than a point and a half below consensus forecasts of 118.8. Despite the weaker than expected report, confidence levels have recovered more than half of the declines from the pre-COVID highs.
One very strong aspect of the report this morning was the Jobs Plentiful index which surged 29% versus April, marking the third straight m/m gain of over 19% during which time the index has doubled. That’s easily the largest ever three-month gain in the index. Jobs are so plentiful now that the index is actually higher than it was back in February 2020 when people were still figuring out what COVID was right before the WHO declared it a pandemic in March 2020. With a record number of job openings per the JOLTS survey and consumers viewing the ability to find a job just as easy now as it was before the pandemic, it once again leads back to the question of why there are 8.2 million fewer Americans working now than there were in February 2020?
On another note, it’s really just a matter of semantics at this point, but since the mid-1960s there has never been another period where the Jobs Plentiful index erased this much of its losses and the economy was still in a recession. The NBER is the organization in charge of dating recession start and end dates, and while it isn’t meant in any way to be a timing indicator, at this point the recession is not only over, but it has been for about a year now. Going back to 1980, the median number of days between the end of a recession and when the NBER makes the official announcement is 476 days. Based on that, we could expect the NBER announcement to come out sometime later this Summer. Click here to view Bespoke’s premium membership options for our best research available.