Daily Sector Snapshot — 7/2/21
The Bespoke Report – Equity Market Pros and Cons – Q3 2021
This week’s Bespoke Report is an updated version of our “Pros and Cons” edition for Q3 2021.
With this report, you’re able to get a complete picture of the bull and bear case for US stocks right now. It’s heavy on graphics and light on text, but we let the charts and tables do the talking!
On page two of the report, you’ll see a full list of the pros and cons that we lay out. We then provide slides for each “pro” or “con” that we’ve highlighted.
To read this report and access everything else Bespoke’s research platform has to offer, start a two-week trial to Bespoke Premium. Enter “THINKBIG” at checkout to receive a 10% discount once the trial ends.


Bespoke’s Morning Lineup – 7/2/21 – Happy Birthday!
See what’s driving market performance around the world in today’s Morning Lineup. Bespoke’s Morning Lineup is the best way to start your trading day. Read it now by starting a two-week free trial to Bespoke Premium. CLICK HERE to learn more and start your free trial.
“My dream is of a place and a time where America will once again be seen as the last best hope of earth.” – Abraham Lincoln
On a Friday before a holiday weekend, you would expect things to be quiet, and that’s exactly the way things are now ahead of the June jobs report. The release of that report will likely cause some ripples, but don’t expect much in the way of movement after the first couple of hours of trading as traders head for the exits to start the holiday weekend early. Have a Happy July 4th!
Read today’s Morning Lineup for a recap of all the major market news and events from around the world, a discussion of the latest round of OPEC talks, economic data from around the world, the latest US and international COVID trends including our vaccination trackers, and much more.

July 4th is typically a good time of year for the equity market, and the chart below showing the performance of the S&P 500 from the Friday before to the Friday after July 4th illustrates that point. Since 1945, the S&P 500’s median gain during the four trading day stretch has been a gain of 0.88% with positive returns 71% of the time. Last year was an especially strong July 4th week for the market as the S&P 500 surged 4.02%, ranking as the second-best July 4th week since 1945 (2010 was the best at 5.42%).
We have also highlighted years where the S&P 500 was up over 10% heading into the July 4th week in red. When equities were already up double-digits heading into July 4th, performance was even better with a median gain of 1.06% and positive returns 86% of the time (19 out of 22 times).

The Bespoke 50 Top Growth Stocks — 7/1/21
Bespoke’s Weekly Sector Snapshot — 7/1/21
B.I.G. Tips – First Half 2021 Decile Analysis
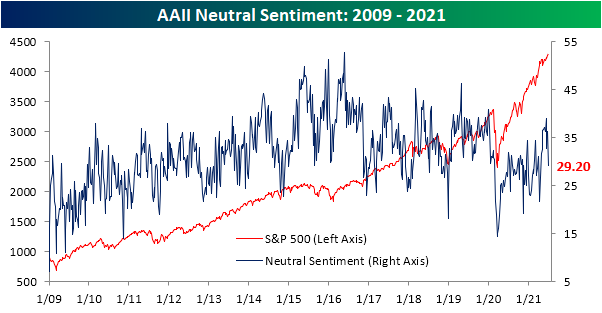
Sentiment Has Perked Up
Sentiment has taken a big step up in the past week. The AAII weekly sentiment survey saw 48.6% of respondents report as bullish this week, up 8.2 percentage points from last week for the highest reading since the week of April 22nd when over half of respondents reported as optimists. Not only is this week’s reading ten percentage points above the historical average, but the one-week increase was the largest since an 11.1 percentage point jump during the week of April 8th. Similarly, the Investors Intelligence survey of newsletter writers saw bullish sentiment jump from 56.5% last week to an eight-week high of 59.6%.

Considering bearish sentiment was already muted, that big increase in bullish sentiment was only met with a 1.1 percentage point decline in bearish sentiment. Only 22.2% of respondents reported as bearish this week, the lowest reading since June 10th.

While bearish sentiment did not experience a particularly large decline, it was an inverse move to bullish sentiment which resulted in the bull-bear spread climbing 9.3 points to the highest level since April 22nd. That means sentiment continues to largely favor the bulls. Prior to the past year, late 2017 and early 2018 was the only other period in recent years that the bull-bear spread was at similar levels to now.

Given the jump in bullish sentiment did not borrow from bearish sentiment, neutral sentiment took a significant hit this week falling 7.4 percentage points. That was both the biggest one-week decline and marks the lower level in neutral sentiment since April. Click here to view all of Bespoke’s premium membership options and to sign up for a trial.
Jobless Claims Back to Pandemic Lows
Initial jobless claims fell to 364K this week from last week’s upwardly revised level of 415K (originally 411K). That 51k decline was the biggest one-week drop since a 156K decline between the first and second week of April. Additionally, this week’s print leaves claims 10K below the previous low of the pandemic.
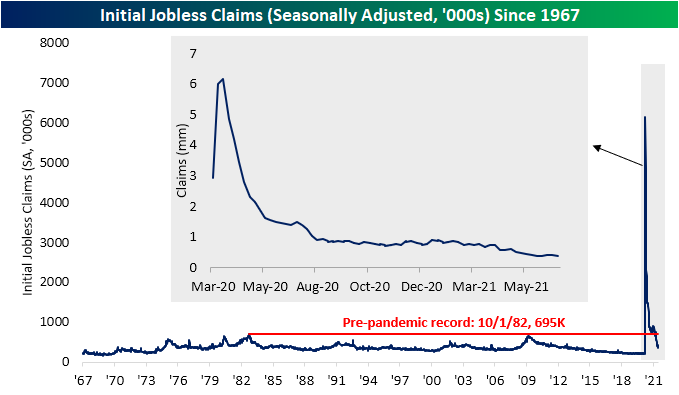
On a non-seasonally adjusted basis, claims were likewise lower falling from 397.4K to 359.1K. It is somewhat unusual for the current week of the year to experience a decline as historically it has seen claims rise three-quarters of the time. While regular state claims were lower, PUA claims rose for a third week in a row. Rising to 115.27K, PUA claims are at the highest level since the week of April 23rd. In spite of the two programs having moved in opposite directions, the drop in regular state claims was larger as total combined claims fell back below 500K and are roughly 40K above the low of 435.8K from three weeks ago.

Continuing claims were once again not as strong as the reading continues to flip back and forth between increases and decreases week to week. This week saw a small 56K uptick which left seasonally adjusted claims at 3.469 million. While higher and 56K off last week’s low, claims remain at a healthier level than the rest of the pandemic.

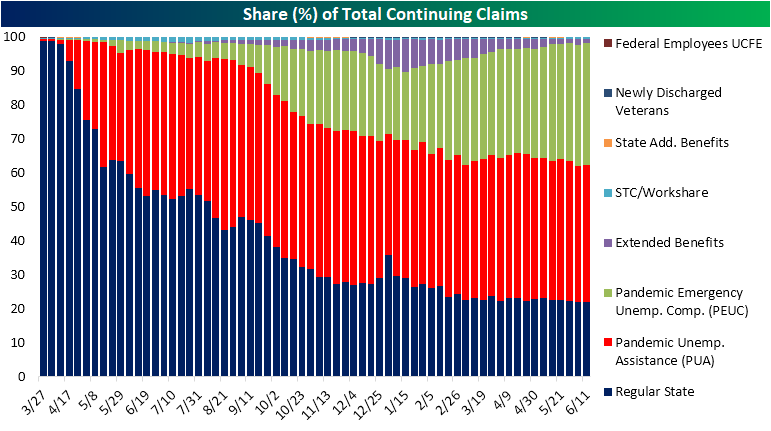
On a non-seasonally adjusted basis and including all other programs through the week of June 11th, claims fell from 14.87 million down to 14.68 million. That marked the seventh week in a row that total claims across all programs fell week over week. The Extended Benefits program was the biggest contributor to that decline as the program saw 86.82K fewer claims than the previous week. Regular state programs were the next biggest contributor to the overall decline with claims dropping 64.7K. With the consistent declines in regular state programs, pandemic era programs (PUA and PEUC) now account for 76.3% of all continuing claims. That share is likely to drop in the coming weeks though as there will be an acceleration in states withdrawing from those programs which will begin to be reflected in this data. Click here to view Bespoke’s premium membership options for our best research available.

Energy and Ethereum Lead The Way Higher in First Half
The first half of 2021 is now in the books. Below is a look at our Asset Class Performance Matrix highlighting total returns in June, Q2, and the first half of 2021 using key ETFs that we monitor on a regular basis.
Across asset classes, energy was the winning theme with commodities like oil (USO) and natural gas (UNG) boasting some of the strongest first-half returns alongside Energy sector stocks (XLE). USO was the top performer of these with its 51.11% total return since the start of the year. Alongside XLE and UNG’s over 40% gains, the Ethereum Trust (ETHE) also rallied 44.32%, albeit there has been a significant pullback in the past month. Although ETHE posted big gains, Bitcoin (GBTC) took a loss with a 6.84% decline in the first half. That is not to say it was not up significantly at one point during the first half as Q2 alone saw a 40.43% loss that brought it into the red for the half. The only other assets to have fallen by more than Bitcoin in the first half were the Japanese Yen (FXY), Gold (GLD), and long bonds (TLT). TLT saw the weakest returns of all of these over the course of the past six months but more recently it has experienced better performance relative to other assets. In fact, its 4.42% rally in June was almost double that of the S&P 500.
In the equities space, again Energy was the top performer while small caps and value outperformed as well in the first half. That was not necessarily the case in June though as there was evidence of rotation out of value and into growth. The NASDAQ 100 (QQQ) and S&P 500 Growth (IVEW) were two of the top-performing ETFs in June and Q2 while value stocks actually fell in June.
As for international equities, Canada (EWC) and Russia (RXS) were the strongest country ETFs in the first half. While it was not enough to lift its first-half gain to the high end of the range of countries shown, Brazil (EWZ) did see a large degree of outperformance in Q2 with a 23.05% gain. That is nearly double the next best performer, Russia. Additionally, these were the only two countries up significantly in June as most countries saw a loss. Year-to-date, China (ASHR) and Japan (EWJ) have been the weakest of the country ETFs. Click here to view Bespoke’s premium membership options.
