Bespoke’s Morning Lineup – 7/7/21 – Yield Plunge Continues
See what’s driving market performance around the world in today’s Morning Lineup. Bespoke’s Morning Lineup is the best way to start your trading day. Read it now by starting a two-week free trial to Bespoke Premium. CLICK HERE to learn more and start your free trial.
“Truly brilliant marketing happens when you take something most people think of as a weakness and reposition it so people think of it as a strength.” – Reed Hastings
While still higher versus yesterday’s close, US futures have given up some of those gains as the continued decline in long-term treasury yields picks up the pace. The yield on the 10-year US Treasury currently trades below 1.31% which is now lower than at any other point since 2/19. Lower interest rates are good for equity prices, but when the pace of the downside move picks up steam, equity investors take pause.
Read today’s Morning Lineup for a recap of all the major market news and events from around the world, a discussion of growth in the Delta variant, economic data from around the world, the latest US and international COVID trends including our vaccination trackers, and much more.

With the Russell 2000 down more than 1% over each of the last two trading days, small caps have really been lagging their large-cap peers. That underperformance continues a trend we have seen over the last several weeks where the S&P 500 has been increasingly outperforming the Russell 2000 on a daily basis. Over the last 50 trading days, the S&P 500 has outperformed the Russell 2000 56% of the time. That matches a number of other periods as the highest frequency of outperformance over a 50-trading day period since late March 2020. What makes the current period different, though, is that if the S&P 500 outperforms the Russell 2000 on any of the next three trading days, the current period will move into the lead as the highest consistency of large-cap outperformance since the end of March 2020. Just as large-cap tech was in the penalty box from early March through the end of Q1, now it appears as though small caps have found themselves in their own timeout.

Daily Sector Snapshot — 7/6/21
Amazon (AMZN) Primed and Popped
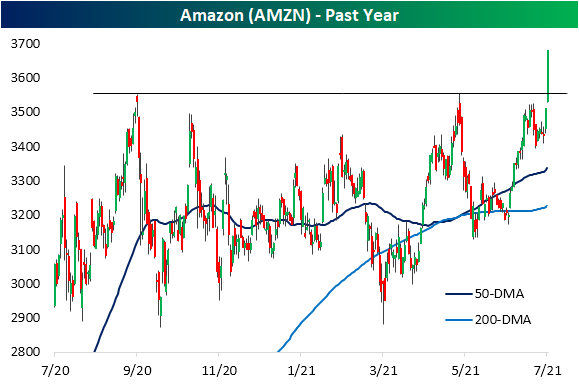
One returning trend that we have made note of recently has been the outperformance of mega-cap stocks on what has generally been moderate broader market breadth. Online retail giant Amazon.com (AMZN) is a good example of this today. Even though the S&P 500 is down 0.35% on 3:1 negative breadth as of this writing, AMZN is providing a boost as the index’s top performer up 4.55%. That puts the stock on pace for its best day since November 4th when it gained 6.32%. While today’s move is notable in its own right as that stands in the 93rd percentile of all daily moves since the stock began trading in 1997, even more impressive is that it marks a breakout to the upside of the past year’s range. As shown below, since last summer the stock has been rangebound between its lows around $2,870 set in late July—which were then retested in September and March—and the highs around $3,550 first reached in September which was then unsuccessfully tested earlier this spring.
While that range is finally broken, we would note just how tight it had gotten. With the lower readings from last spring having rolled off, the 52-week intraday high/low spread as of last Friday hit a record low of 23.79%. The breakout to new highs today has lifted that reading up to 28.14% which still does not have another period that can be compared to. While not as low as today, the only other times that the spread has come close to current levels was early 2020 right before the COVID crash, February 2015, and June 2013. Click here to view Bespoke’s premium membership options.
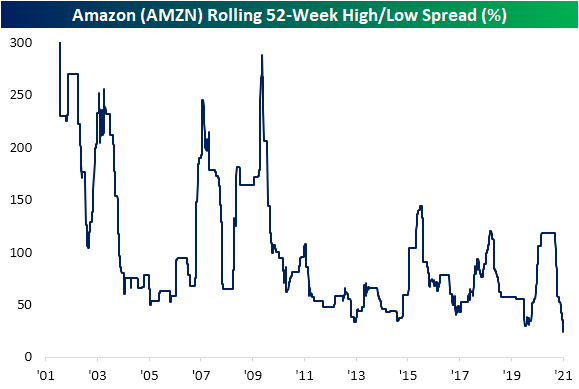
Chart of the Day – Netflix (NFLX) Chills
Chinese Equities Falling Behind
2021 saw Chinese equities get off to a strong start with the CSI 300 leading the way higher versus the US (S&P 500) and Europe (STOXX 600). By the time of the Chinese New Year on February 12th, the CSI 300 had already rallied 11.44% YTD, but the new (Chinese) year has seen a plague of regulatory risk resulting in a complete reversal in that earlier strength. From mid-February to March the index fell sharply and it has not done much since then. Chinese equities have now erased the entirety of the double-digit move from the first several weeks of the year as the CSI 300 is currently down 2.5% YTD. Meanwhile, the S&P 500 and STOXX 600 have both trended higher and are currently up 15.58% and 14.58% YTD, respectively. Given the weakness of the CSI 300, the relative strength lines of the S&P 500 and STOXX 600 versus the CSI 300 have taken off in recent months.


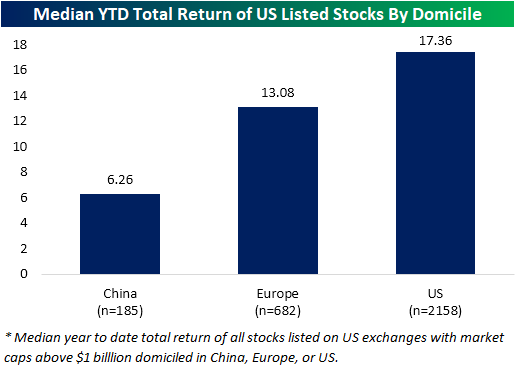
Taking another look at the underperformance of Chinese equities, in the chart below we show the median year-to-date total return of stocks listed on US exchanges with market caps greater than $1 billion grouped by the country, or region in the case of Europe, that they are domiciled in. As shown, US-domiciled stocks have the largest median return this year at 17.36%. European companies whose shares are traded in the US are not far behind in performance having posted 13% gains this year. While still having posted a positive total return, Chinese names are up by far less at only 6.26%. Click here to view Bespoke’s premium membership options for our best research available.
Bespoke Stock Scores — 7/6/21
Memory Lane: Some of The Best and Worst Days of This Week Through History
“Aggressive accounting does not mean illegal accounting” – Kenneth Lay, Enron CEO
“It was greed, pure and simple.” – Dennis Kozlowski, Tyco CEO
“I don’t know accounting.” – Bernard Ebbers, WorldCom CEO
With the July 4th holiday, the first week of July has historically been a rather quiet one for the US equity market, but the equity market don’t always follow the seasonal playbook, and a perfect case in point was the first week of July 2002 when the S&P 500 saw one of its best and worst days in history for that particular week of the year.
Friday, July 5th, 2002 (+3.67%)
With Americans still on edge following the September 11th attacks, the S&P 500 surged on the first trading day after the peaceful and uneventful July 4th holiday. Even a weaker-than-expected jobs report couldn’t dampen the sense of relief. The peaceful weekend coupled with two solid days of gains in European bourses and panic short-covering on a light volume holiday-shortened Summer Friday helped to exaggerate the upside. Relative to prior weeks, it was a rare positive day for the S&P 500. Breadth was positive as gainers outnumbered losers by a margin of more than 4 to 1, and semis surged more than 9%! With terrorism fears momentarily allayed, bulls pushed the S&P 500 to its largest one-day gain since May 8th. Would the post-July 4th rally serve as the catalyst to break the downtrend in US stocks?
Stock market declines in the first half of 2002 were driven by economic weakness as a result of 9/11 and numerous accounting scandals that surfaced in companies like Enron, Tyco, and WorldCom. July 5th provided some irony on that front, though, as The Great Atlantic and Pacific Tea Company (aka A&P grocery chain) disclosed its own accounting error. Only this one was in its favor as an audit showed that the grocer had improperly booked manufacturer discounts and promotions, and the restatement turned what was originally a loss to a gain.
The rally on July 5th also came just two trading days after the S&P 500 first closed below its 9/11 lows, and the bounce instilled some hope that perhaps this would mark the beginning of the elusive bottoming process. Unfortunately, there was no such luck. The following Monday, the S&P 500 dropped 1.22%, and that was followed the next Tuesday by a decline of 2.47%, erasing all of the prior Friday’s gain. The sellers still weren’t done yet, though. Over the next two weeks, the S&P 500 dropped an additional 16%+.
Wednesday, July 10th, 2002 (-3.40%)
After a strong rally on a holiday-shortened Friday (discussed above), stocks opened the following week with declines that reached a crescendo on Wednesday, July 10th when the S&P 500 fell 3.40% to levels not seen in nearly five years (November 1997). As mentioned above, accounting scandals, fears of terrorism, and the weak economy all merged to create one of the worst bear markets in decades, with stocks having their worst half-year performance since 1970.
The first two trading days of this week in July 2002 completely erased the big gains from the prior Friday, and then on Wednesday (7/10/02) equities immediately opened down and ground lower throughout the entire day, closing near the lows of the day. While the news items of the day certainly did not generate any positive sentiment (Qwest under federal investigation, President Bush delivering a speech on corporate responsibility that did not have any concrete steps to prevent future scandals), the market action seemed driven more by despondency than any specific catalyst. A report that investors pulled $11.8 billion out of stock mutual funds in June, the largest move since the prior September after the 9/11 attacks, provided concrete evidence of that sentiment. With so much pessimism and large outflows from mutual funds, a contrarian bet might be to take the other side, but it would be a few more weeks before stocks were able to show any signs of stabilization. Over the nine trading days to the eventual bottom of the July swoon, the S&P 500 fell seven times for an additional decline of 13.3%. Click here to view Bespoke’s premium membership options.

Bespoke Market Calendar — July 2021
Please click the image below to view our July 2021 market calendar. This calendar includes the S&P 500’s average percentage change and average intraday chart pattern for each trading day during the upcoming month. It also includes market holidays and options expiration dates plus the dates of key economic indicator releases. Start a two-week free trial to one of Bespoke’s three research levels.

Bespoke’s Morning Lineup – 7/6/21 – Leaders Lag
See what’s driving market performance around the world in today’s Morning Lineup. Bespoke’s Morning Lineup is the best way to start your trading day. Read it now by starting a two-week free trial to Bespoke Premium. CLICK HERE to learn more and start your free trial.
“The best time to plant a tree was 20 years ago. The second best time is now.” – Chinese Proverb
Happy Tuesday! If you were off yesterday, we hope you had a good long holiday weekend. There’s not much in the way of fireworks going on in the US equity markets this morning as futures are little changed. The only major item of note is the plunge in shares of the Chinese ride-hailing company, DIDI, after Chinese authorities ordered the removal of its app from various platforms in China. The only economic data of note for today is the ISM Services report at 10 AM. Anything could happen, but based on the current setup, we could be in for a quiet week.
Read today’s Morning Lineup for a recap of all the major market news and events from around the world, a discussion of the latest services sector PMI data, other economic data from around the world, the latest US and international COVID trends including our vaccination trackers, and much more.
We’ve talked a lot about the equity market’s impressive ability over the last several months to rotate between sectors and styles without causing too much in the way of a ripple in the overall market. The snapshot of major index ETFs below shows a great example of this rotation as last week’s leaders were the YTD laggards and the laggards were the YTD leaders. Two cases in point? With a decline of 2.43% last week, the Russell Micro-Cap ETF (IWC) remains the top-performing index ETF YTD even as it was the worst-performing ETF of the week. Conversely, even after its 2.63% gain last week, the Nasdaq 100 ETF (QQQ) is still up less than any of the other ETFs in the screen.

The scatter chart below shows the rotation in another way. Starting out at the top left, we have QQQ as the worst-performing index ETF YTD but the best performer last week. From there, as you move to the right, YTD performance increases while performance over the last week gets progressively worse.

Bespoke Brunch Reads: 7/4/21
Welcome to Bespoke Brunch Reads — a linkfest of the favorite things we read over the past week. The links are mostly market related, but there are some other interesting subjects covered as well. We hope you enjoy the food for thought as a supplement to the research we provide you during the week.
While you’re here, join Bespoke Premium with a 30-day free trial!
COVID
7 Ways Covid Has Changed Our World by Aaron Back (WSJ)
A series of articles detailing the 7 ways that COVID has changed the world: exurban growth, shopping habits, vaccine hesitancy, remote learning, the big business potential of vaccines, bigger government spending, and life insurance are the big ideas. [Link; paywall]
The Case Against the Covid-19 Lab Leak Theory by Lindsay Beyerstein (The New Republic)
A detailed takedown of the loose punditry which has surrounded the so-called lab leak hypothesis, which posits COVID originated in a Chinese lab rather than a vector from the natural world as other coronaviruses have. [Link]
Pfizer and Moderna Vaccines Likely to Produce Lasting Immunity, Study Finds by Apoorva Mandavilli (NYT)
While we will only know with the passage of time, initial studies assessing how long mRNA-based COVID vaccines protect recipients are very positive and indicate the shots could generate a lifetime of functional immunity. [Link; soft paywall]
Big Spending
Southwest Offers Workers Double Pay to Avoid July Travel Snags by Alison Sider (WSJ)
The airline is ramping up pay to make sure it has sufficient staff on hand to process the huge swell of customers which are drowning airports and flights with post-COVID demand for travel. [Link]
Tesla is well on its way to smashing last year’s sales record by Tim Levin (Business Insider)
Tesla delivered 201,250 vehicles to customers during Q2, by far its best quarter and putting it on track to easily hurdle its record 2020 sales pace of over 500,000 cars. [Link]
Global App Spending Approached $65 Billion in the First Half of 2021, Up More Than 24% Year-Over-Year by Stephanie Chan (Sensor Tower)
With consumer spending booming, mobile apps are increasingly grabbing share with a huge increase in the number of dollars spent on purchases of apps, in-app purchases, and subscriptions. Apple’s App Store is about twice as large as Google Play. [Link]
China
The deep roots of China’s financial conservatism (Andrew Batson)
High inflation during China’s civil war and the success of the communist government in taming it after defeating the nationalist opposition has deeply colored the fiscal and monetary perspectives of Chinese policymakers. [Link]
Investing
Inner Game with Steven Cohen (Stray Reflections)
A recorded Zoom seminar with Steve Cohen of Point72 Asset Management, focused on his process and the inner approach which has led to his success. [Link]
Retirement
What Peter Thiel’s Roth IRA Means for Yours by Laura Saunders (WSJ)
The revelation that billionaire Peter Thiel has managed to generate a Roth IRA balance of about $5bn is a catalyst for tax reform that cuts off the popular tax minimization strategy. [Link; paywall]
Older Americans Stockpiled a Record $35 Trillion. The Time Has Come to Give It Away. by Ben Eisen and Anne Tergesen (WSJ)
Wealth concentrated in the hands of aging Baby Boomers that will transfer to younger generations over coming years numbers in the tens of trillions of dollars, but the real big inheritances won’t kick off until the 2030s. [Link]
Read Bespoke’s most actionable market research by joining Bespoke Premium today! Get started here.
Have a great weekend!