The Bespoke 50 Top Growth Stocks – 6/24/21
Kansas City Fed Shows Cap Ex Is Ramping Up
The Kansas City Fed released the results of their June survey of the region’s manufacturing sector this morning. Like the Richmond Fed reading two days ago and the Markit PMI yesterday, the composite index saw an uptick in June indicating some acceleration in manufacturing activity. The index rose one point to 27 which also exceeded expectations that were calling for the composite to fall further to 24 after a five-point drop last month. Similar to other regional Fed surveys, while the readings on current conditions have peaked, outlooks are cheerier with the index for expectations reaching a record high of 37 in June.

While the composite index for future expectations was the only category of the survey to come in at a record high, many other indices are similarly in the top few percentiles of their historical ranges. Consistent with other regions, breadth in this month’s report was a bit mixed with more categories declining than rising month over month. Regardless, even after those declines, these indices point to robust growth, long lead times, higher prices, and attempts to take on more workers amidst worker shortages.

One of the main areas to have seen declines concern demand and output. New Orders saw a particularly large decline with the 13 point drop ranking in the bottom decile of all monthly changes. That brought the index to the lowest level in four months. Production and Shipments also saw deceleration although to a lesser extent than New Orders. With order growth hitting the brakes but still at healthy levels, backlogs continue to grow at a historic rate. Granted, that is not as bad as earlier this spring.

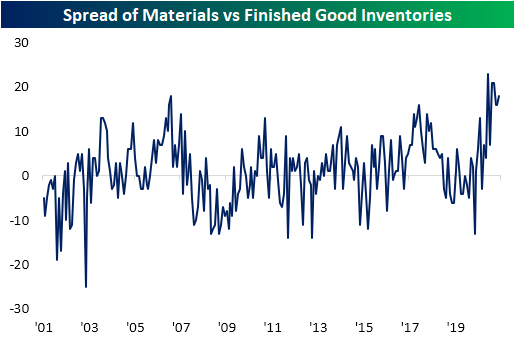
The indices tracking inventories for materials and finished goods both declined in June, but material inventories are growing at a much faster clip of the two and expectations are just off a record high. Additionally, while the region’s manufacturing firms report fairly modest growth in current finished good inventories, expectations are more positive with that index hitting the highest level in three years. Regardless, as shown in the chart below, the spread between inventory levels of inputs and outputs has been at some of the highest levels on record over the past several months with another uptick this month. In other words, manufacturers appear to be having some trouble building finished good inventories.
One theme of the report’s commentary and special questions was a labor shortage. That potentially could be a reason for the aforementioned disconnect in material and finished good inventories. In spite of that labor shortage, the index for Number of Employees rose 6 points in June to the top 1% of all readings. While expectations declined sequentially, this month’s reading was also still above any reading on record outside of the past three months. Similarly, Average Workweek continues to come in at strong levels while expectations tied June 2018 for a record high. So while firms are stating they cannot find workers, they are still taking on new employees at a historically strong clip.

As for the other side of the production function, firms are also rapidly increasing plans to increase Capital Expenditure. The index tracking this metric saw one of the biggest one-month increases on record which brought it to the highest level since September 2018. Additionally, in the special questions of the survey, 41% of respondents said they are planning to increase investment in labor-saving automation on account of labor shortages. Another 17% planned to keep the same pace of investment as in the past. Overall, manufacturers are reporting strong albeit slowing demand, and to keep up with it, they are trying to take on more workers but shortages are affecting an ability to hire. As a result, more businesses are beginning to invest in capital. Click here to view all of Bespoke’s premium membership options and sign up for a trial.
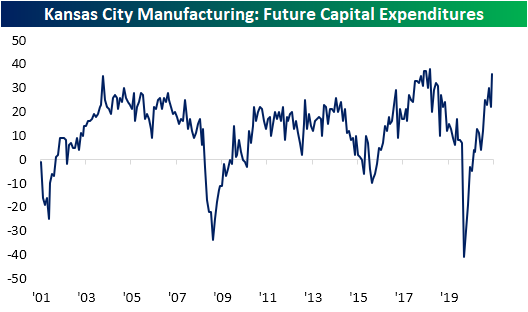
Chart sources: Federal Reserve Bank of Kansas City
Chart of the Day: How Do Fed Chairs Stack Up?
Housing: More Affordable Than It Looks
With the surge in home prices since the COVID pandemic hit, there are big concerns that housing has become much less affordable. But context is important. In addition to the price of a house, affordability should also take into account income supporting a given purchase and the interest cost of the debt borrowed to buy a home. In the first chart below, we take the median existing home sales price, assume a 20% down payment, and then calculate the implicit monthly payment cost to cover it based on national average mortgage rates. Then account for changes in income over time by expressing that dollar payment amount in terms of hourly wages, specifically the average hourly wage of production and non-supervisory employees. As shown in the chart, relative to labor income and interest rates, housing does not look particularly unaffordable at all, with 44.7 hours of work covering a monthly payment. That compares to around 55 hours in the early-2000s (prior to the subprime bubble) and 40 hours in the mid-2010s. Of course, lower interest rates do not help with down payments.
The median existing home’s down payment has soared in hours worked terms. It’s worth remembering, though, that first-time buyers can put down as little as 5%, and even twice that much down requires substantially fewer hours worked than a 20% down payment required in the late 1990s or early 2000s.
Taken together, we would argue that for existing homes, the current market is challenging, but that the level of home prices are not wildly unsustainable, and actually make quite a lot of sense.

While the new home market is a much smaller segment of the housing market and tends to target existing owners rather than new buyers, we still think performing a similar analysis is helpful. When we do, we see a very similar story as the one told by the existing home market but with a much longer-term data set. As shown, the monthly carrying cost of a new home is low versus history in hourly wage terms, though it has increased somewhat in the last few months. We also note that while the down payment for new homes is high versus wages, the current level is below the pre-COVID peak as well as the subprime bubble peak. New home prices have been far more under control than existing home prices, so if anything, affordability is even better for new home buyers. Bottom line: home prices are rising quickly and that appears to be stifling demand, but the rapid price increases of the last 18 months have largely been offset by large gains for hourly wages and the drop in interest rates over the same period. Click here to view Bespoke’s premium membership options.

Chart sources: National Association of Realtors, US Census Bureau, Bureau of Labor Statistics, Federal Reserve, Freddie Mac, FRED, Bespoke Investment Group Calculations
Bears in Hibernation
The S&P 500’s dip below its 50-DMA and the corresponding rally to new all-time highs did little to dramatically change investor sentiment. This week’s survey results from the AAII saw bullish sentiment fall slightly from 41.1% last week to 40.4%. That is once again within the past several weeks’ range at the lowest level since only two weeks ago.

Bearish sentiment was also lower this week, falling by 2.9 percentage points to 23.3%. As with bullish sentiment, that is the lowest level in two weeks. From a longer-term perspective, bearish sentiment is more than 7 percentage points below its historical average of 30.5%. In other words, while sentiment is not exuberant, it continues to skew optimistic.

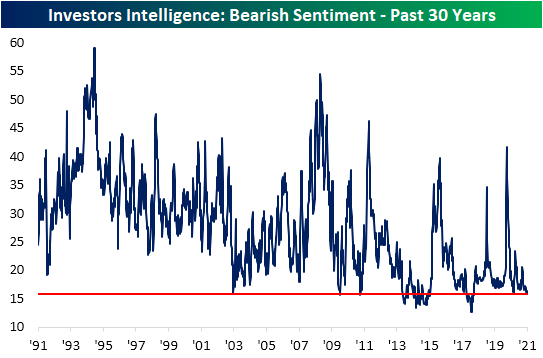
The historically muted level of bearish sentiment also shows up in the Investors Intelligence survey of newsletter writers. This week, that reading fell half of one percentage point to 15.8%. That is the lowest percentage of respondents reporting as bearish since March 14th, 2018. Over the past 30 years, there have been only a handful of other periods with lower levels of market pessimism.
Pivoting back to the AAII survey, with bearish sentiment historically muted, a larger share of investors are reporting as neutral. 36.6% of respondents reported as such this week, up 3.9 percentage points from the six-week low last week. Click here to view all of Bespoke’s premium membership options and sign up for a trial.

Claims Disappoint But Resume Improvements
Last week, jobless claims saw a significant one-week uptick off the pandemic lows, and while claims are still elevated around some of the highest levels since mid-May, there was an improvement this week with a 7K decline to 411K. Granted, that also did not live up to expectations of a decline back down to 380K which would have been just 6K above the pandemic low.

On a non-seasonally adjusted basis, claims through regular state programs actually came in below 400K falling 14.7K to 393.1K. A sequential decline in the non-seasonally adjusted number for the current week of the year is somewhat unusual as this reading on jobless claims has historically risen two-thirds of the time. While regular state claims were lower, claims through the Pandemic Unemployment Assistance (PUA) program were higher. The past several weeks have seen steady improvements in PUA claim counts with a low of 71.2K at the beginning of the month, but after rising for two straight weeks now, it is back above 100K for the first time since the first week of May.

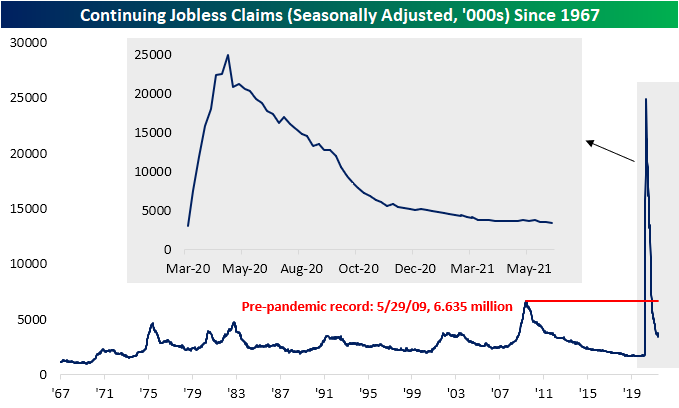
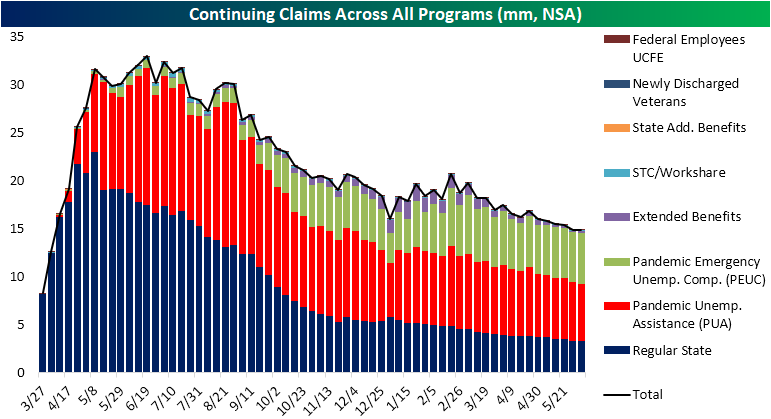
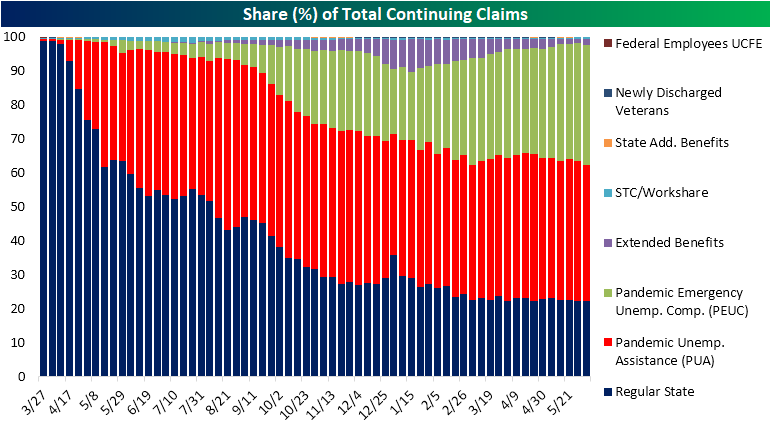
Since the last week of April, continuing jobless claims have been pretty choppy with every other week seeing a rise in claims. Granted, the weeks in between in which claims have fallen have seen larger declines than the previous week’s increase. This week was yet another example of this as claims fell 144K to erase last week’s 17K uptick which brought claims to a new pandemic low of 3.39 million. In other words, continuing claims are not improving in as consistent of a manner as they did for most of the past year, but nonetheless, they have continued to improve.
When including other programs on top of regular state claims, the improvements have been more consistent, but the most recent week (June 4th) did see a small uptick in total claims from 14.866K to 14.871K. In the charts below we show continuing claim counts (non-seasonally adjusted) for all programs. This data is lagged an additional week to the most recent release of claims for regular state programs, but the overall trend continues to be one of improvement. While total claims were higher, the PUA program did experience a large 175K decline, although that was offset by a 107.9K uptick in PEUC claims and a 97.7K increase in Extended Benefits. We would also note, as we did last week, that this is the last week of data before half of the states began to withdraw from pandemic era unemployment relief. that means data in the weeks to come is likely to see overall claim counts fall on account of fewer states reporting for certain programs. Click here to view Bespoke’s premium membership options.
Bespoke’s Morning Lineup – 6/24/21 – Semi Stall
See what’s driving market performance around the world in today’s Morning Lineup. Bespoke’s Morning Lineup is the best way to start your trading day. Read it now by starting a two-week free trial to Bespoke Premium. CLICK HERE to learn more and start your free trial.
“Altogether too often, people substitute opinions for facts and emotions for analysis.” – Andrew S. Grove
The Nasdaq is looking to make it four in a row today as US futures are higher across the board. Optimism on a possible breakthrough in infrastructure negotiations as well as some dovish commentary from the BoE are providing catalysts for today’s move. There’s a very big slate of economic data on the calendar, though, as well as a number of Fed officials scheduled to speak, so investors will have to navigate through all of these throughout the day. Early data released so far have generally been in line to weaker than expected, and the yield on the 10-year US Treasury is still below 1.5% down to 1.48%.
Read today’s Morning Lineup for a recap of all the major market news and events from around the world, updates on confidence data from Europe and Canada, the latest US and international COVID trends including our vaccination trackers, and much more.

We’ve seen the pattern below for the semiconductor index in a lot of areas of the market lately, especially the ones that were big winners last year. The Philadelphia Semiconductor Index isn’t far from its record highs in April, but it has essentially been in a sideways range for the last six months, a period in which it has traded in a relatively narrow range of 21.4%. As the group looks to bounce from here, if it can’t break out to new highs, or even stalls out short of its high a few days ago, look for technicians to start calling out a loose head and shoulders pattern.

Semiconductor stocks have become less volatile as the group has matured, but even the recent range is on the low side of the historical average. As shown in the chart below, the current six-month range for the stock is the narrowest since October 2018.
