June 2021 Headlines
Bespoke’s Morning Lineup – 7/12/21 – Grounded
See what’s driving market performance around the world in today’s Morning Lineup. Bespoke’s Morning Lineup is the best way to start your trading day. Read it now by starting a two-week free trial to Bespoke Premium. CLICK HERE to learn more and start your free trial.
“I believe that space travel will one day become as common as airline travel is today.” – Buzz Aldrin
While Richard Branson blasted himself into space over the weekend, futures are a lot more muted this morning as large-cap US equities are indicated modestly lower to start the week. One pocket of strength has been technology as the Nasdaq is trading moderately higher as a just-announced EU delay of implementing a digital tax has provided a boost.
Read today’s Morning Lineup for a recap of all the major market news and events from around the world, a discussion of economic data out of Japan, the latest US and international COVID trends including our vaccination trackers, and much more.

Friday was a good close to the week for small-cap stocks, but it wasn’t enough to erase the damage of the prior days as they were still the worst-performing market cap sector for the week. In the five days ending Friday, mega-cap dominated indices like the Nasdaq 100 and S&P 100 both rallied more than 1.5% and finished the week at either overbought or ‘extreme’ overbought levels. Other large-cap-oriented indices also rallied around 1% last week and also headed into the weekend at overbought levels. At the bottom of the list, all the small-cap focused index ETFs actually fell around 2% while the Micro-Cap ETF (IWC) dropped over 3%. So, while large caps are all overbought heading into the week, mid and small-cap index ETFs are either trading below or barely hanging on to their 50-DMAs.

Bespoke Brunch Reads: 7/11/21
Welcome to Bespoke Brunch Reads — a linkfest of the favorite things we read over the past week. The links are mostly market related, but there are some other interesting subjects covered as well. We hope you enjoy the food for thought as a supplement to the research we provide you during the week.
While you’re here, join Bespoke Premium with a 30-day free trial!
Collapse
Liquidity Risk in $1.2 Trillion of Bond Funds Exposed by Covid by Sam Potter (Bloomberg)
An argument that bond ETFs are a source of systemic risk because authorized participants who facilitate ETF creation and redemption have funding constraints. [Link; soft paywall]
Credit Suisse’s #Zoltan Warns of Trouble Ahead in Money Markets by Julia-Ambra Verlaine (WSJ)
An alarmist interpretation of the insights offered by Credit Suisse money market maven Zoltan Pozsar, the dean of analysts who follow the complex flow of funds through short-term funding markets and between various financial institutions. [Link; paywall]
The Collapse of Overend, Gurney, and Co. by Global Financial Data (Threadreader App)
How a bank with a simple, predictable, and reliable business model turned into a massive failure on the back of rampant railroad speculation during the middle of the industrial revolution. [Link]
GOATs
Spelling bee champ Zaila Avant-garde is basketball whiz — and Guinness World Record holder by Scott Gleeson (USA Today)
The most impressive 8th-grader we’ve ever come across is Zaila Avant-garde, a teenage phenom who not only won the national spelling bee this week but is also an impressive athlete who can shoot a basketball better than most adults. [Link]
Column: Don’t miss it. Shohei Ohhhhh-tani is delivering the best season in baseball history by Bill Plaschke (LAT)
Los Angeles Angels pitcher Shohei Ohtani is not only leading the majors in dingers and nears the top in runs, RBIs, and slugging, but is also 4-1 on the mound with an impressive 3.49 ERA and 87 Ks. [Link]
Regulation
FACT SHEET: Executive Order on Promoting Competition in the American Economy (White House)
This week the Biden Administration announced a new initiative focused on raising competition, especially in the labor market. The list is exhaustive and includes some areas that more conservative voices have focused on for years. Regardless of the political content, this is an interesting new approach to regulatory policy. [Link]
SEC Charges Three Individuals with Insider Trading (SEC)
Insider trading charges have been leveled against individuals connected to Long Blockchain Company, a penny stock that pivoted from iced tea to blockchain, driving a massive spike in shares. Two are already in litigation related to a prior stock manipulation scheme. [Link]
A third of Wisconsin’s wolves killed after losing protections this year, study says by Douglas Main (National Geographic)
After wolves had their protected species status revoked, Wisconsin allowed hunting of the animals and the end result was roughly one-third of the species was killed in the state in just one year. [Link; soft paywall]
Q2 Reports
Startups have never had it so good by Alex Wilhelm and Anna Heim (TechCrunch)
Second quarter data shows that strong venture dealmaking activity has continued with record dollar value for invested funds. As a result, deal multiples and overall sizes are surging. [Link]
Mall Index – Q2 2021 by Ethan Chernofsky (Placer.ai)
Compared to 2019, indoor mall visits were down 8.1% in June, versus a decline of as much as 29% in February 2021. Outdoor mall traffic has held up better but is still down versus 2019. [Link]
Research
Observing Many Researchers Using the Same Data and Hypothesis Reveals a Hidden Universe of Uncertainty by Breznau et al (MetaArXiv Preprints)
A hilarious paper that shows wildly different scientific results from the same initial data that cannot be explained by observable characteristics of models specified. The results suggest caution is warranted whenever interpreting scientific findings. [Link]
Stabbing
The Game That Ruins Friendships and Shapes Careers by David Klion (Foreign Policy)
A dive into the rough-and-tumble world of Diplomacy, a superficially simple board game that serves as a perfect training ground for the sort of realpolitik that dominates modern Washington. [Link]
Read Bespoke’s most actionable market research by joining Bespoke Premium today! Get started here.
Have a great weekend!
Daily Sector Snapshot — 7/9/21
The Bespoke Report – 7/9/21 – Earnings Season Awaits
This week’s Bespoke Report newsletter is now available for members.
The week of July 4th has historically been a good one for the stock market, but this year has been an exception. While the median S&P 500 gain during July 4th week has been a gain of 0.88% and even higher (1.06%) when the S&P 500 was already up over 10% YTD heading into the week, this year’s performance has been considerably less. Heading into Friday, the S&P 500 was down 0.72% on the week, although an early rally on Friday pushed the market to its highest levels of the week and into the black.
With the quiet, holiday-shortened week and the fact that we just published our quarterly Pros and Cons report last week, there isn’t a whole lot to cover, so for this week’s report, we wanted to provide a quick look at market performance this week, and then with earnings season coming up next week provide a preview of analyst sentiment heading into the reporting period and what it may mean for market performance. We’ll then close out with a review of sectors that we normally include with each week’s Sector Snapshot report.

To read the report and access everything else Bespoke’s research platform has to offer, start a two-week free trial to one of our three membership levels. You won’t be disappointed!

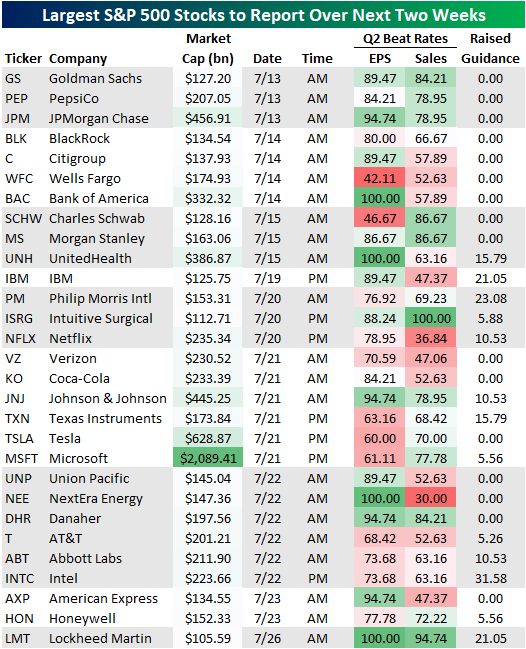
Largest S&P 500 Stocks Reporting Over Next Two Weeks
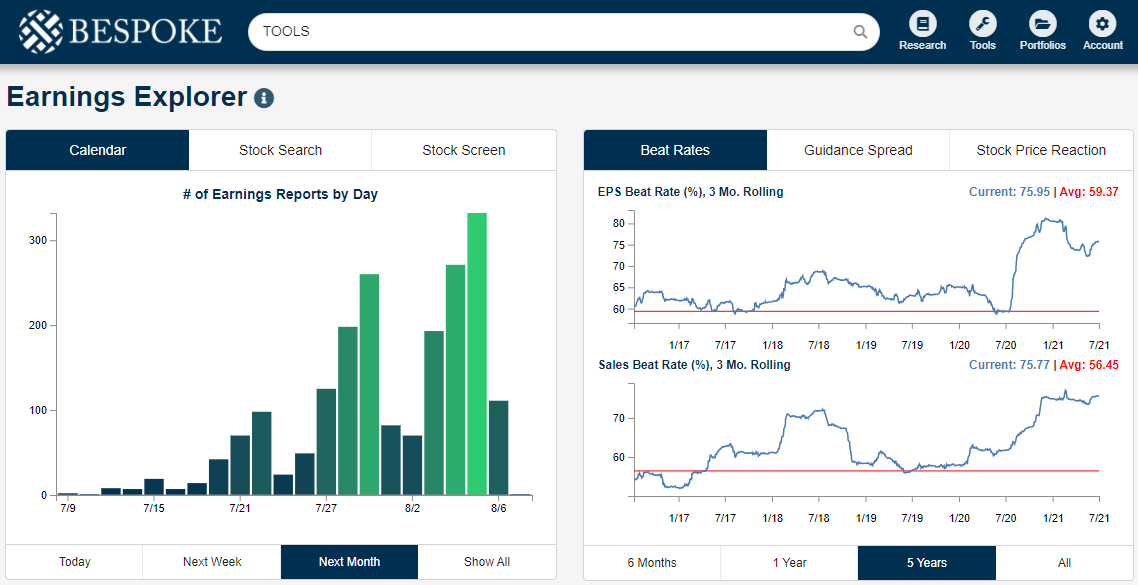
Earnings season begins in earnest next week with the first of the big banks out with Q2 results. In the table below, we show the 29 stocks set to report over the next two weeks with market caps above $100 billion. Using our Earnings Explorer, we show historical Q2 earnings and sales beat rates versus analyst expectations.
As shown, Goldman Sachs (GS), Pepsi (PEP), and JP Morgan (JPM) kick things off on Tuesday before the open. BlackRock (BLK), Citigroup (C), Wells Fargo (WFC), and Bank of America (BAC) all report on Wednesday before the open, and then Schwab (SCHW), Morgan Stanley (MS), and UnitedHealth (UNH) report on Thursday morning. The following week we’ll hear from a number of big blue-chips like IBM, Netflix (NFLX), Verizon (VZ), Coca-Cola (KO), Johnson & Johnson (JNJ), Tesla (TSLA), Microsoft (MSFT), Intel (INTC), American Express (AXP), and Lockheed Martin (LMT).
Of all the stocks set to report over the next couple of weeks, there are a handful that have never missed EPS estimates on Q2 earnings. Those names include Bank of America (BAC), UnitedHealth (UNH), NextEra Energy (NEE), and Lockheed Martin (LMT). Intuitive Surgical (ISRG) is the only one to have never missed Q2 sales estimates. Turning to a look at guidance, Intel (INTC) is the company on this list to most often raise guidance although its sales and EPS beat rates are more middling. LMT and Philip Morris (PM) also have raised guidance more often than other stocks on the list. For more in-depth analysis of earnings and how the stocks below have historically traded in reaction to their Q2 reports, join Bespoke Premium today!
The Most Volatile Stocks on Earnings — July 2021
The Q2 2021 earnings reporting period starts up next week with five of the six major banks reporting their quarterly numbers. As we do ahead of each earnings season, below is a look at the most volatile stocks on earnings. These are the stocks that have historically experienced the biggest one-day moves in reaction to their earnings reports.
While earnings season starts up next week, we really don’t start seeing a large number of daily reports until the end of July and the first week of August. (Track upcoming earnings reports and monitor earnings-related trends using our Earnings Explorer tool.)
Below is a list of the most volatile stocks on earnings that have at least 8 quarters (2 years) of historical earnings reports. These stocks have historically seen the biggest share-price reactions to their earnings reports on the first trading day following the report. (For stocks that report before the open, we are looking at its one-day change on that trading day. For stocks that report after the close, we are looking at its one-day change on the next trading day.)
As shown, Stitch Fix (SFIX) ranks first with an average absolute one-day change of +/-18.62% in reaction to earnings. Cardlytics (CDLX), Pinterest (PINS), Snap (SNAP), and Roku (ROKU) rank two through five on this list, all with average one-day moves of +/-17%. Other notable stocks on the list include Lovesac (LOVE), Groupon (GRPN), The Trade Desk (TTD), Nio (NIO), Cloudera (CLDR), and ZScaler (ZS).

The list above included any stock that has at least 2 years of quarterly reports. Below we show a list of the most volatile stocks on earnings that have at least 5 years (20 reports) of quarterly reports. (Stocks typically see decreasing earnings volatility over time simply because of more data points.)
Of the stocks with at least 5 years of quarterly earnings data, The Container Store (TCS) ranks as the most volatile on earnings with an average absolute one-day move of 16.80%. Impinj (PI) ranks 2nd followed by Groupon (GRPN), At Home Group (HOME), Infinera (INFN), and Fluidigm (FLDM). Other notable stocks on this list include Enphase Energy (ENPH), Yelp (YELP), Stamps.com (STMP), LendingTree (TREE), Twitter (TWTR), RH (RH), Wayfair (W), Netflix (NFLX), iRobot (IRBT), Chegg (CHGG), 3D Systems (DDD), and Etsy (ETSY).

Our final list of volatile stocks on earnings only includes names that have at least 10 years (40 quarterly reports) of earnings history. Amazingly, despite being well-established companies, they still experience an average one-day move of at least +/-10% on their earnings reaction days. In other words, they normally see their market value rise or fall by at least 10% at least once per quarter when they report earnings.
At the top of this list are Infinera (INFN), Stamps.com (STMP), Conn’s (CONN), Netflix (NFLX), and Fossil (FOSL). Other notables include iRobot (IRBT), 3D Systems (DDD), Overstock.com (OSTK), Align Tech (ALGN), Guess? (GES), Crocs (CROX), and TravelCenters of America (TA).
If you’re looking for action this earnings season, you’ll likely find it in the names listed in these tables. Unfortunately, without a crystal ball, there’s no way to know whether the big moves will be to the upside or the downside! Click here to start a trial to Bespoke Institutional and gain access to our Earnings Explorer tool.

Value Has Given Up The Ghost
In the last few months of 2020 and throughout 2021, the S&P 500 Value ETF (IVE) was consistently outperforming its growth counterpart (IVW). Since its most recent high in early June, though, IVE has given up the ghost falling 2.5%. Although not a dramatic decline, IVE’s drop has coincided with a rally of 7.3% in IVW and an even larger 12.5% rally off the May 12th lows.
With growth having gained so much ground on value, on Tuesday, IVW’s year-to-date performance actually moved above that of IVE. That has continued to be the case through the rest of the week as IVW is currently outperforming IVE on a year-to-date basis by almost a full percentage point. Additionally, looking at the past year’s relative strength between the two ETFs, the recent divergence in performance has resulted in relative strength reverting back to zero meaning growth and value have roughly performed in line with one another over the one year span. Click here to view all of Bespoke’s premium membership options and sign up for a trial to any one of them.

Bespoke’s Morning Lineup – 7/9/21 – Friday Already!
See what’s driving market performance around the world in today’s Morning Lineup. Bespoke’s Morning Lineup is the best way to start your trading day. Read it now by starting a two-week free trial to Bespoke Premium. CLICK HERE to learn more and start your free trial.
“Know what you own and know why you own it.” – Peter Lynch
Futures continue to rebound off Thursday’s lows as they look to erase most of yesterday’s losses at the open. Based on where they stand now, all of the major averages are set to finish the shortened week modestly in the red and bucking the positive seasonal trend in the process. Small caps are leading the charge this morning with Russell 2000 futures trading up by just over 1%. A positive showing today would snap what has been a four-day streak of 0.90%+ declines. The last time the Russell 2000 experienced a streak that long was in late February 2020 during the COVID crash. Granted, the magnitude of the losses was much larger back then, but it just helps to put the recent negative sentiment towards small caps into perspective.
10-Year US Treasuries are also trading lower this morning and that sets the stage for an end to the eight-day streak of falling 10-year yields. As we noted in the Closer report last night, over the last 20 years, there have been a number of streaks as long as the current one, but none have been longer.
On the regulatory front, the Biden administration just confirmed a number of executive orders aimed at competition in the agricultural, banking, health care, rail, technology, and transportation sectors, but futures are actually higher now than they were leading up to the releases.
Read today’s Morning Lineup for a recap of all the major market news and events from around the world, a discussion of economic data and policy actions in China, the latest US and international COVID trends including our vaccination trackers, and much more.
As the Technology sector has outperformed in recent weeks and US Treasury yields have declined, it almost seems as though the cyclical trade has been written off for dead, but a look at sector performance on a YTD basis provides some good perspective. Even after the recent outperformance, the Technology sector is still underperforming the S&P 500 on a YTD basis (14.8% vs 15.0%). At the same time, most of the cyclical sectors that surged in late 2020 and earlier this year are still handily outperforming the S&P 500 this year. The YTD gain in the Energy sector still dwarfs the S&P 500 and every other sector. Likewise, Financials still have a six percentage point lead on the Technology sector. Pullbacks in the Industrials and Materials sectors have moved them into the laggard camp on a YTD basis, but their gains are still solid. Like the period of consolidation that the technology/growth areas of the market experienced from September through earlier this year, one could just as easily take the view that these sectors are simply consolidating their monster gains of the prior months.
