B.I.G. Tips – Decile Analysis of Q3 So Far
Emerging Markets Leave China Behind
In last night’s Closer, we noted the record underperformance of Chinese equities relative to the US over the past six months. As a result of the weakness in Chinese equities, the MSCI Emerging Market ETF (EEM)—which has roughly a 37% weight in Hong Kong and Chinese stocks—is well off of its highs and has been trending lower over the past several months. Today, EEM is up a healthy 1.37%, but that brings it just short of its 50-DMA which recently fell below its 200-DMA. That is also at similar levels to the lower high from the start of this month.

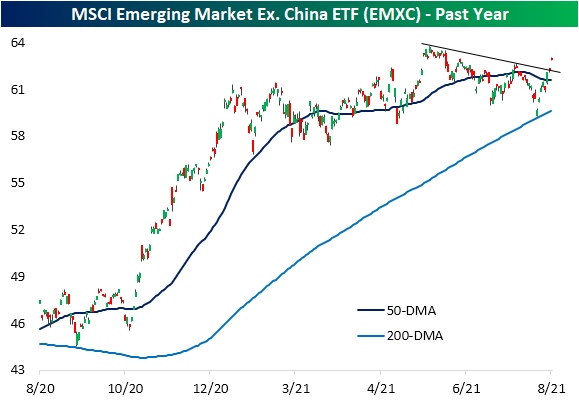
When factoring out China, emerging markets look much better. Again, the MSCI Emerging Market ETF that excludes China (EMXC) is currently 1.13% below its 52-week high, but the downtrend that has been in place since the early June highs has been on the ropes over the past couple of sessions. Yesterday saw the ETF trade and close right at that downtrend line, but the 1.15% gain today has smashed through it. That leaves EMXC at the highest level since June 15th. The ETF is also at some of the most overbought levels (1.8 standard deviations from its 50-DMA) since then.
Pivoting over to bonds, looking at the Fixed Income screen of our Trend Analyzer, the best performer over the past five days is also in the EM space. The USD Emerging Markets Bond ETF (EMB) had been mostly flat throughout the summer trending right alongside its sideways 50- and 200-DMAs. Significant gains last Friday and yesterday led EMB to break out of that range as it reaches some of the highest levels since February today.

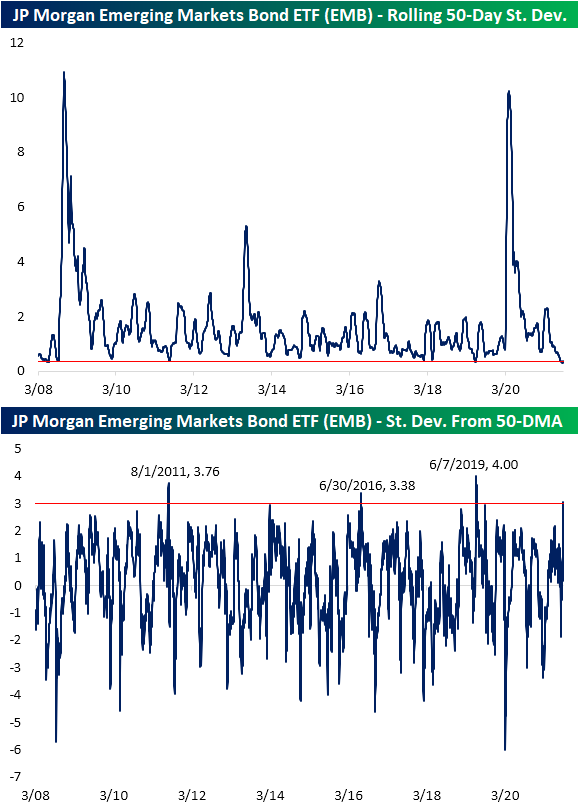
As previously mentioned, EMB has not ventured far from its 50-DMA recently. In fact, the rolling 50-day standard deviation has been right around some of the lowest levels on record since EMB began trading in 2008. Given that lack of volatility, the rip higher this week has resulted in the ETF moving well beyond the upper end of its narrow trading range. In fact, yesterday the ETF closed over 3 standard deviations above its 50-DMA. That joins only 14 other days where the ETF closed at least 3 standard deviations above its 50-DMA with the most recent of those back in June 2019 when it reached as high as 4 standard deviations above its moving average. Click here to view Bespoke’s premium membership options.
Mid-Caps Moderate
To round out the month of August, the major indices are slightly lower on the day. Overall, in the final week of the month, small caps like the Micro-Cap ETF (IWC) and Russell 2000 (IWM) have generally outperformed although they are coming from below their 50-DMAs, and yesterday they saw a reversal lower. Large caps have posted smaller gains but are reaching new record highs. The price action of mid-caps, on the other hand, has been a mix of small and large caps. Mid-caps, like the S&P MidCap 400 ETF (MDY) and Core S&P MidCap ETF (IJH), are broadly overbought and have also posted solid gains in the past several days of around 2%. Additionally, whereas this week they are on the cusp of extreme overbought territory, last week those same ETFs were still within one standard deviation of their 50-DMAs.

While mid-caps have made a solid move higher over the past five days, like small-caps, they have pivoted lower in the past couple of sessions. From a charting perspective, those moves lower also come right as IJH and MDY made a run at their highs from the final days of April. Having rejected that resistance, there is the potential for nearby support around the highs from earlier this month and early June and then the 50-DMA below that. Click here to view Bespoke’s premium membership options.


Bespoke’s Morning Lineup – 8/31/21 – That’s a Wrap
See what’s driving market performance around the world in today’s Morning Lineup. Bespoke’s Morning Lineup is the best way to start your trading day. Read it now by starting a two-week trial to Bespoke Premium. CLICK HERE to learn more and start your trial.
“I always tried to turn every disaster into an opportunity.” – John D. Rockefeller
We’re six and a half hours of trading from wrapping up the month of August and the seventh straight month of gains for the S&P 500. Futures have been drifting lower this morning after gains overnight, but so far the declines remain modest. One catalyst cited for the weakness has been comments from an ECB Governing council member (Holzmann) suggesting that the ECB should at least start to talk about how it will remove policy stimulus.
On a brighter note related to COVID, Bloomberg reports this morning that beginning tomorrow Citigroup will increase capacity in its Hong Kong offices to 90% from an already relatively high level of 75%. Citi’s move follows similar moves from Goldman Sachs and Bank of America earlier this Summer. While Hong Kong’s case burden is considerably less than most other areas of the world, it’s encouraging to see at least one area of the world returning somewhat back to normal.
Read today’s Morning Lineup for a recap of all the major market news and events from around the world, including the latest US and international COVID trends.
While the ECB now joins other central banks around the world in discussing or already starting to remove accommodation, we’d note that August data hasn’t looked particularly good so far. Overnight, we had reports out of China showing that activity in the Manufacturing and Services sector slowed considerably. Here in the US, regional manufacturing Federal Reserve surveys for the month of August also showed a notable deceleration in momentum. While the headline readings of the five Federal Reserve surveys all still showed growth (with some at healthy levels), they all decelerated relative to July, and only the KC Fed survey managed to exceed expectations. We’ll get a further read on the state of the economy in August with the Chicago PMI today at 10 AM and then the ISM Manufacturing report at 10 AM tomorrow.

Start a two-week trial to Bespoke Premium and read today’s full Morning Lineup.
Chart of the Day – Air Passenger Traffic: COVID or Seasonal?
Daily Sector Snapshot — 8/30/21
S&P 1500 States of Domicile
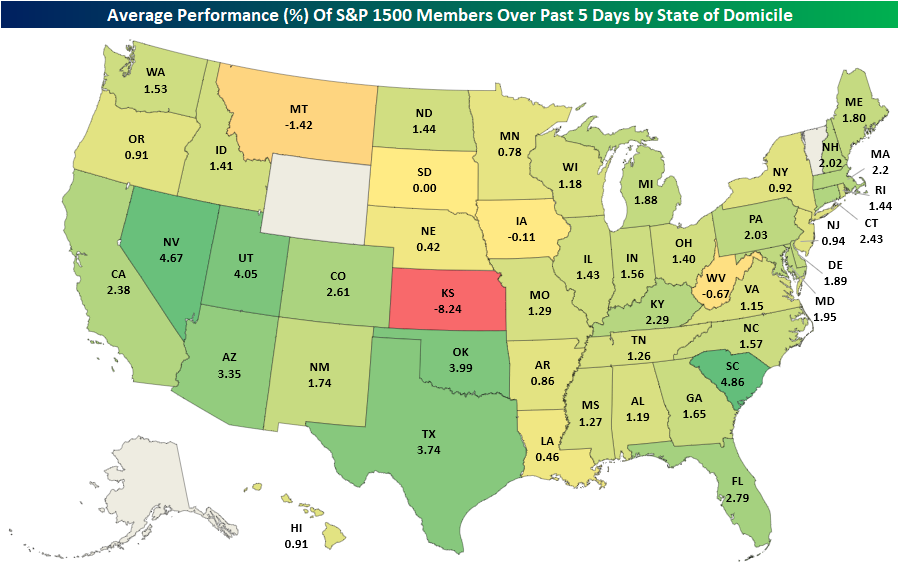
It’s hurricane season and leading the news to start the week has been the landfall of Hurricane Ida on the 16-year anniversary of Hurricane Katrina. In today’s Morning Lineup, we detailed the initial impact of the storm on what will likely be the most impacted sector: energy. As could be expected with a regionally focused event, equities are largely shrugging things off with the S&P 500 and Nasdaq both solidly higher and reaching new records today. As for a more particular look, in the heatmap below, we show the average five-day performance of S&P 1500 stocks based on their state of domicile.
Obviously, this is not an exact read-through of a stock’s geographic exposure—for example, a company may be headquartered in one state, but the bulk of its business is based in others—but Louisiana based equities have, on average, actually seen worse performance than neighboring states or the country more broadly. Of the average performance of stocks domiciled in the 48 applicable states plus DC (no S&P 1500 companies are domiciled in Alaska, Wyoming, or Vermont), Louisiana-based stocks rank as the eighth-worst performers over the past five days. The absolute worst state, though, has been Kansas, but that is primarily due to an over 36% decline in SelectQuote (SLQT). Admittedly, this is an imperfect measure of a company’s geographic exposure, and individual stories related to each specific business are of greater importance than where each company is domiciled. it is interesting to note that S&P 1500 companies domiciled in Louisiana have underperformed the broader market in the past week.
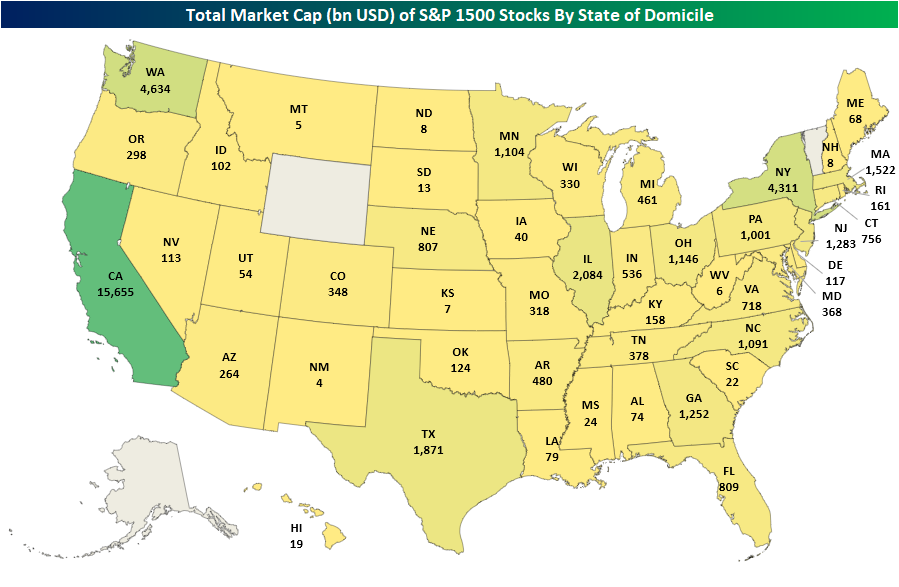
When looking at average performance, we would also caution that various states have dramatic differences in the actual number of stocks domiciled within each state. For example, there are just seven S&P 1500 companies domiciled in Louisiana, and their combined market cap is only $79 billion. That compares to neighboring Texas with 130 stocks that have a total market cap of $1.8 trillion. It also pales in comparison to California’s 223 stocks with a combined market cap above $15.5 trillion. So again, holding constant any more systemic or lasting effects of the storm, looking purely at where stocks are domiciled does not imply Hurricane Ida would necessarily have a massive impact on broad swathes of the market. Click here to view Bespoke’s premium membership options.

Dallas Fed Flops
Leading into today, the four already released results from regional Fed banks’ monthly manufacturing reports broadly showed a material slowdown in activity in August which we showcased in the most recent update of our Five Fed Manufacturing Composite in last week’s Bespoke Report. The fifth and final report out of the Eleventh District added more confirmation to that slowdown with its release this morning. The Dallas Fed’s headline index peaked back in April at 37.3 and has declined each consecutive month since then including in August. In fact, this month’s decline was by far the most severe as the indicator dropped 18.3 points versus only 3.8 point declines the prior two months and a 2.4 point decline in May. The 18.3 point decline month over month also ranks as the eighth largest MoM decline on record and the largest since last March when it fell by a record 70.4 points. Another decline had been penciled in this month with the index forecasted to fall from 27.3 to 23, but the drop to 9 made for the eleventh biggest miss versus expectations since at least 2009.

Looking across the various categories of the report, declines were broad across categories with only unfilled orders, inventories, hours worked, and prices paid higher relative to July. Those declines are largely coming off of historically strong readings, though, with many in the top decile of their historical range last month. Even after falling, every category is still above their historical median readings with many still in the upper deciles. In other words, manufacturing activity slowed but remains at solid levels.

Order growth and shipments are the areas to have seen the greatest moderation over the past few months. In August, these indices all saw some of the largest declines in point terms and are now much less elevated than other readings. For example, new orders are only in the 72nd percentile and Shipments are only in the 65th. Those declines leave the indices at similar levels to the start of this year. Again, the declines in these indices do not mean activity is contracting, but rather is decelerating meaning orders are still growing at a healthy level. One example of this is unfilled orders. With order growth at a solid clip, unfilled orders actually ticked higher, remaining at unprecedentedly high levels. We would also note, while businesses reported order backlogs are continuing to grow at historic rates, they do not foresee that to remain the case. Expectations for the category dropped into negative territory this month (the only reading across current conditions and expectations to do so).
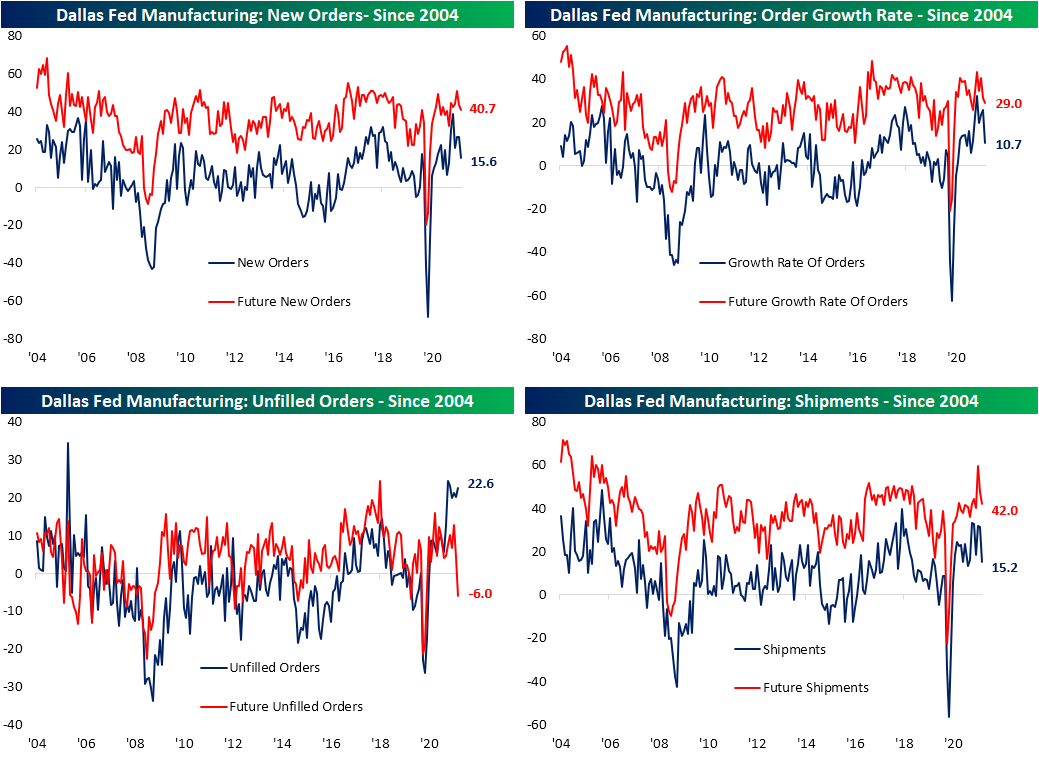
Prices and supply chains also appeared to have gotten some relief in August and could be playing a role as to why businesses appear optimistic to work off order backlogs. While still right around record highs, prices received and delivery times were both lower. Unfortunately, while customers saw some price relief, prices paid were slightly higher. Meanwhile, Inventories are starting to grow again as the index rose 12.9 points to go back into positive territory for the first time since March 2019.

Employment-focused categories were a somewhat dour point of the survey. Readings on Employment and Wages & Benefits were both lower in August which was met with a decline in capital expenditures. On the bright side, current readings are still at healthy levels and the expectations index for wages and benefits actually hit a record.

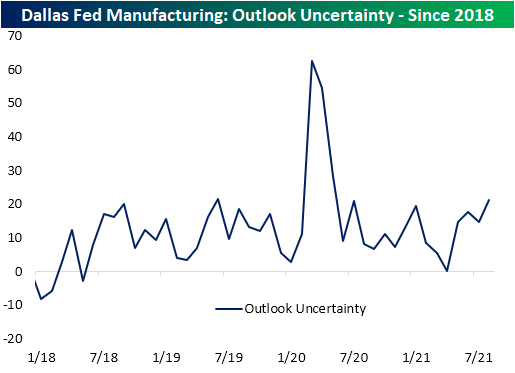
One other point to watch is uncertainty. The Dallas Fed’s reading on uncertainty does not have much in the way of an extensive history, only dating back to the start of 2018, but the index did rise to 21.1 as COVID cases rose through the summer. Those levels are well below the highs reached earlier in the pandemic, but are once again at the upper end of the past few years’ range. Click here to view Bespoke’s premium membership options.
Bespoke Matrix of Economic Indicators – 8/30/21
Our Matrix of Economic Indicators provides a concise summary analysis of the US economy’s momentum. We combine trends across the dozens and dozens of economic indicators in various categories like manufacturing, employment, housing, the consumer, and inflation to provide a directional overview of the economy.
To access our newest Matrix of Economic Indicators, start a two-week free trial to either Bespoke Premium or Bespoke Institutional now!
Bespoke’s Morning Lineup – 8/30/21 – Slow Start to the End of August
See what’s driving market performance around the world in today’s Morning Lineup. Bespoke’s Morning Lineup is the best way to start your trading day. Read it now by starting a two-week trial to Bespoke Premium. CLICK HERE to learn more and start your trial.
“The roots of education are bitter, but the fruit is sweet.” – Aristotle
It’s hard to get closer to unchanged in the futures markets this morning than we are now. The S&P 500 is indicated to open up by 3 points, the Nasdaq by 12, and the Dow higher by 10 points. While Hurricane Ida continues to slam Louisiana and the deadline for the US withdrawal from Afghanistan approaches, market-moving news is scarce this morning. In terms of economic data, Pending Home Sales will be released at 10 AM, and the Dallas Fed Manufacturing report comes out a half-hour later.
Last week was a good one for the US equity market with the S&P 500 rallying about 1.5% and the Russell 2000 surging more than 5%. Across individual sectors, though, returns for the week were mixed. For sectors like Energy, Financials, and Materials, it was a great week with all three rallying more than 2.5% and Energy surging by triple that rate. Despite the surge in Energy stocks, though, it is still the only sector that heads into the week below its 50-day moving average.
On the other end of the spectrum, Utilities, Consumer Staples, and Health Care all actually fell more than 1% while Real Estate was also lower. Given its weighting in the overall market, the sector that really matters is Technology, and with a gain of 1.45% that was actually up pretty much right in line with the broader market.

Start a two-week trial to Bespoke Premium and read today’s full Morning Lineup.