Bespoke’s Weekly Sector Snapshot — 7/29/21
Chart of the Day: GDP Devil Is In The Details
Neutral Sentiment Surge Continues
The AAII’s weekly sentiment survey saw an equal percentage (30.6%) of respondents report as bullish and bearish last week. This week saw a much more optimistic pivot as 36.2% of respondents reported bullish sentiment. While higher, bullish sentiment is still at one of the lowest levels since last fall. At 36.2%, bullish sentiment is also now just below the historical average of 38%. While the AAII reading on bullish sentiment was higher but still muted, the Investors Intelligence survey of newsletter writers showed bullish sentiment fall 8.1 percentage points to 53.1%. While that is not a particularly low reading (the lowest since only the end of May), it was the largest one week decline since October 2019. In other words, bullish sentiment is not necessarily collapsing, but it has lost some footing.

With more bulls in the AAII survey, fewer respondents reported bearish sentiment. In fact, less than a quarter of investors reported bearish sentiment this week. That is down 6.5 percentage points from the prior week; the largest one-week decline since a 6.6 percentage point decline in the first week of June.

The inverse moves in bullish and bearish sentiment resulted in the bull-bear spread to rise 12.1 points. While off the lows, it is still not as strong of a reading as has been seen for most of this year. In fact, the current reading is 5.5 points below the average since the start of the year.

The most impressive sentiment reading this week was neutral sentiment. Over the past four weeks, neutral sentiment has risen 10.5 percentage points without a single decline in that time. That is the biggest four-week rise since mid-May when it had risen 14.9 percentage points. Now as the predominant sentiment with just below 40% of respondents reporting as such, neutral sentiment is at the highest level since the first week of 2020 when this reading was 1.2 percentage points higher. Click here to view Bespoke’s premium membership options.

The Bespoke 50 Top Growth Stocks — 7/29/21
State Oddities and Claims
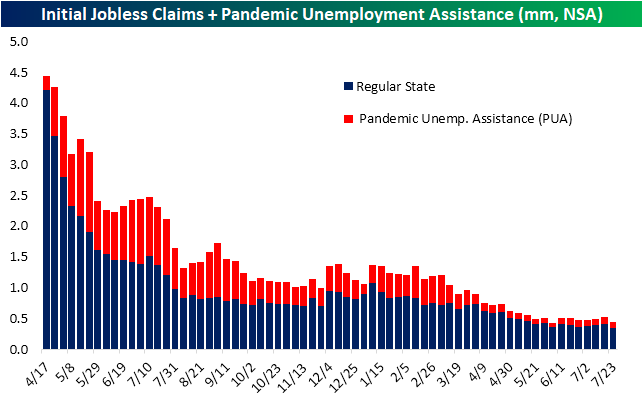
While last week’s jobless claims number was already disappointing on account of increases in layoffs in the manufacturing and automobile industries in Michigan, Texas, Missouri, Illinois, and Ohio, and this week that reading was revised higher by 5K to 424K. Fortunately, the most recent print saw an improvement with claims falling to 400K. That compares to expectations of a drop back below 400K to 385K.

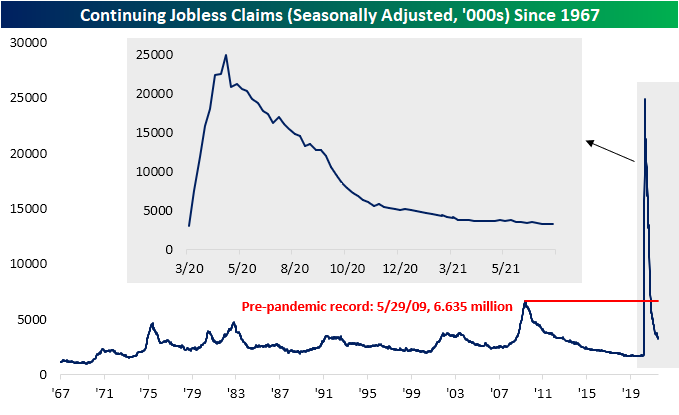
While the seasonally adjusted number did not improve by as much as expected, the non-seasonally adjusted number was much stronger at 344.7K. That leaves initial claims within 100K of the last sub-one million claims print from March 13th of last year. Given that disconnect between the seasonally adjusted and unadjusted numbers, it goes without saying that drops in the NSA number are due to seasonality and typical for this time of year. In fact, as shown in the second chart below, since 1967 when the data begins, claims have risen only 11% of the time during the current week (30th) of the year. That ranks sixth as the week of the year in which claims have most often fallen week over week.
Since mid-June, PUA claims have been fluctuating around 100K. Last week saw a rise up to 109.9K thanks to a big jump in Indiana following a judge’s order for the program to be restarted. Indiana claims started to normalize this week and saw the largest drop of any state, national PUA claims came in back below 100K at 95.17K. That is the lowest level since the first week of June when PUA claims put in a low of 71.23K.

Lagged an additional week to initial claims, continuing claims snapped a streak of three weeks of improvement. Continuing claims rose to 3.269 million from 3.262 million in the prior week. That is only the highest level since the end of June.
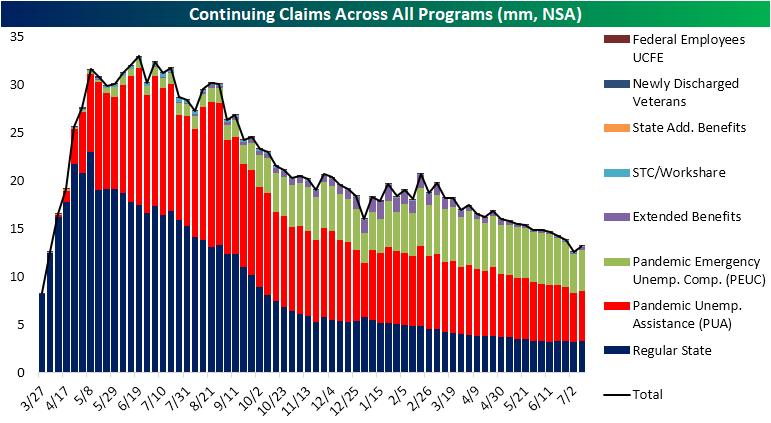
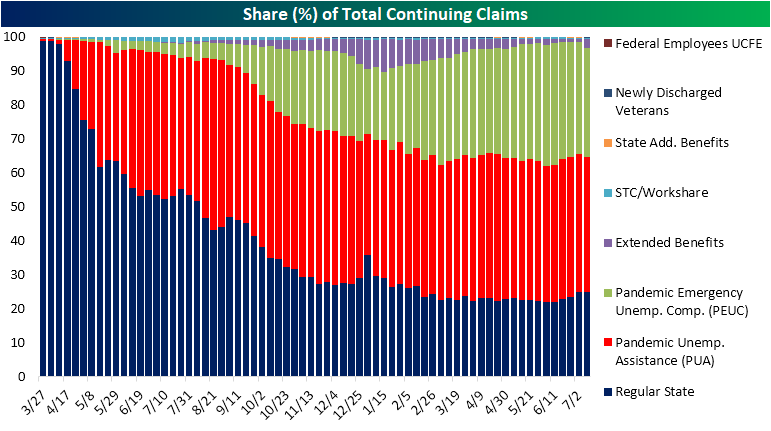
Factoring in all other programs creates an additional week of lag making the most recent reading through July 9th. Continuing claims broadly saw a move higher across programs that week bringing total claims to 13.17 million from 12.59 million. That brought to an end a streak of ten consecutive weeks of declines. As for which programs, in particular, accounted for that uptick in claims, the biggest contributor was the Extended Benefits program. This program saw claims go from under 100K all the way up to 343.5K. While we cannot point to any particular reason for each state’s increase, that large move higher was particularly thanks to two of the most populous states: Texas and California which saw weekly claims rise 180K and 67.1K, respectively. Throughout recent claims reports, there have been a handful of state-level idiosyncracies which impact aggregate claims counts, but overall the trend of improving claims on a national level remains in place. Click here to view Bespoke’s premium membership options.
Bespoke’s Morning Lineup – 7/29/21 – GDP on Deck
See what’s driving market performance around the world in today’s Morning Lineup. Bespoke’s Morning Lineup is the best way to start your trading day. Read it now by starting a two-week trial to Bespoke Premium. CLICK HERE to learn more and start your trial.
“It’s all about the journey, not the outcome.” – Carl Lewis
Twenty-five years ago today, Olympian Carl Lewis completed one of the most impressive streaks in US track and field history when, at the age of 35, he won the gold medal in the long jump. That victory marked the fourth straight Olympics in which Lewis stood at the top of the podium for the long jump and the ninth time overall. In winning the long jump for the fourth time, Lewis became the first American since Al Oerter to win back to back to back to back golds in the same event.
With two days left in the month, the S&P 500 is also in the middle of its own streak with six straight monthly gains. That’s far from a record but still pretty impressive nonetheless. Futures are higher this morning as equities look to add to their gains for July, as optimism over a bipartisan infrastructure deal boosts sentiment along with positive words from China regarding its crackdown on tech companies in the country.
There is also a good deal of economic data today with the first read on GDP kicking things off with a big miss (+6.5% vs +8.4%) and both initial and continuing jobless claims coming in higher than expected. At 10 AM, we’ll get Pending Home Sales. During the day, we’ll also have the Robinhood (HOOD) IPO which priced at the low end of the expected range, and then after the close, the headline earnings report will be from Amazon.com (AMZN), which will round out the reports of the ‘big five’ mega-caps. So far, the markets have gotten through these reports relatively well, so just one more day to go.
Read today’s Morning Lineup for a recap of all the major market news and events from around the world, the latest US and international COVID trends including our vaccination trackers, and much more.

So far this earnings season, it hasn’t been just the mega-caps that have reported strong results. As shown in the snapshot below, of the 339 companies that have reported since the start of July (through Tuesday), 84% have topped EPS forecasts, 80% have exceeded sales estimates, and a net of 17% have raised guidance. Despite those strong results, companies reporting earnings have gapping down an average of 0.10% at the open on their earnings reaction day. During the trading day, though, buyers have stepped in pushing shares higher by 0.15% for a full day gain of 0.05%. That’s hardly a strong reaction, but at least it’s positive-something we haven’t been able to say consistently over the last couple of earnings seasons.

Daily Sector Snapshot — 7/28/21
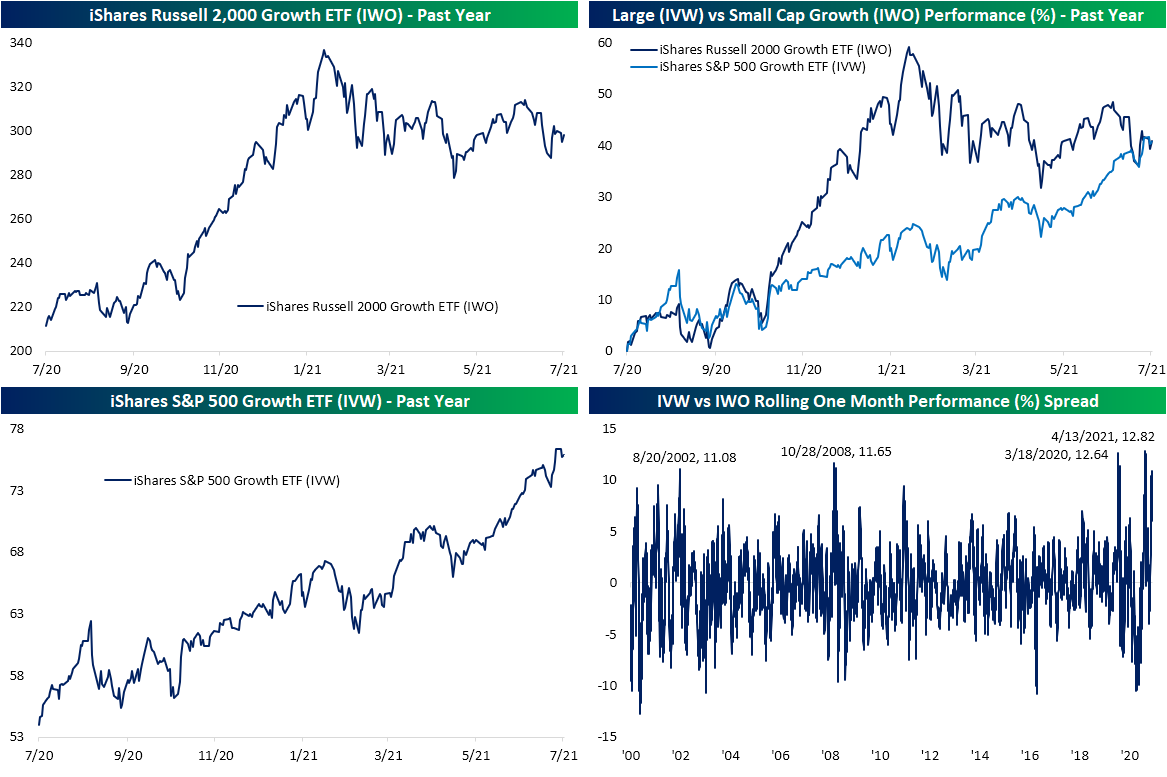
Large Cap Growth Leaves Small Cap Growth in the Dust
Looking at the styles screen of our Trend Analyzer, growth stocks have been clear winners of late, but that does not necessarily include all growth stocks. Whereas the Growth ETF (VUG) or S&P 500 Growth ETF (IVW) are up over 2% over the past five days through yesterday’s close and are sitting on year to date percentage gains in the high teens, the small-cap focused Russell 2000 Growth ETF (IWO) is actually down over the past week and is barely up on the year.

Taking a closer look at the dynamic between small and large-cap growth, as shown below IWO has been trending lower for basically all of 2021 after a strong run higher at the end of last year. Meanwhile, IVW has been trending in a steady, largely uninterrupted, uptrend. Given that strong run at the end of last year, IWO had been outperforming IVW by a large degree for most of the past year. But small-cap weakness and large-cap strength has meant the two are now up by roughly the same amount (~40%) versus one year ago.
A massive degree of that outperformance has come in the past month alone. In the bottom right-hand chart below, we show the rolling one-month performance spread of the two ETFs. While it has come back down slightly today, at yesterday’s close, there was a 10.9 percentage point spread between the one-month performance of IVW and IWO. That is the widest dispersion between the one-month performance of the two ETFs since April’s record level when the spread reached 12.82 percentage points. Since the Russell 2000 Growth ETF began trading exactly 21 years ago, there have only been a handful of other periods in which small-cap growth underperformed by such a wide degree. The other most recent period was March of last year, October 2008, and then late summer of 2002. Click here to view Bespoke’s premium membership options.
Advanced Micro Surges into a Record Narrow One Year Range
After three straight quarters where the stock has declined in reaction to earnings, shares of Advanced Micro (AMD) are surging over 6% today bring the share price within striking distance of the $100 level. Despite the stock’s strong reaction to earnings today, what’s perhaps even more notable regarding AMD share’s price is that remains stuck in the range it has traded in for a full year now since spiking higher on earnings last July. With an intraday peak of $99.23 in January and an intraday low of $72.5 back in May, AMD has traded in a one-year range of 36.9%.

For most stocks, a one-year range of over 35% wouldn’t raise eyebrows. For a stock like AMD, however, 36.9% is not only narrow but it’s the most narrow in the history of the stock. Since 1991, the average spread between AMD’s 52-week high and 52-week low has been over 200%, and there are multiple periods where the spread topped 500%. On the downside, though, prior to the current period, there was never another period where the one-year range was even less than 50% as in 1995, the spread only dropped down as low as 52%. A one-year range of 36.9% may not exactly be like watching paint dry, but for AMD stockholders, it has been a snoozefest. Click here to view Bespoke’s premium membership options.
